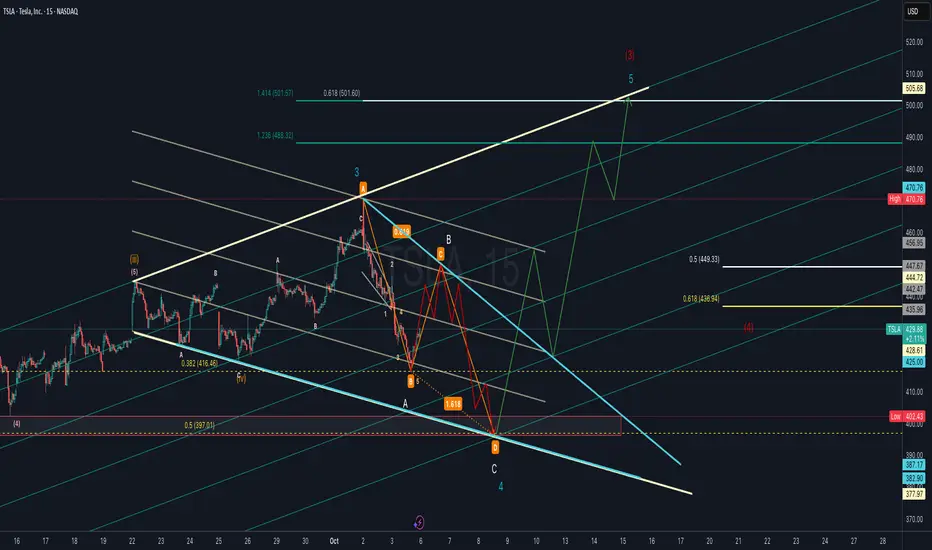
TSLA Elliott Wave Count with ABC Harmonic or Flat Corrective Tesla (TSLA) is forming a potential Wave 4 correction that aligns with an ABC harmonic structure. Price action suggests a possible deeper retracement into the 0.5–0.618 Fibonacci support zone (436–449 area) before resuming its larger uptrend.
If Wave 4 completes near the harmonic “D” zone (highligh
Key facts today
Next report date
—
Report period
—
EPS estimate
—
Revenue estimate
—
1.89 USD
7.13 B USD
97.69 B USD
2.80 B
About Tesla, Inc.
Sector
Industry
CEO
Elon Reeve Musk
Website
Headquarters
Austin
Founded
2003
ISIN
US88160R1014
FIGI
BBG000N9MNX3
Tesla, Inc. engages in the design, development, manufacture, and sale of electric vehicles and energy generation and storage systems. The company operates through Automotive and Energy Generation and Storage. The Automotive segment includes the design, development, manufacture, sale, and lease of electric vehicles as well as sales of automotive regulatory credits. The Energy Generation and Storage segment is involved in the design, manufacture, installation, sale, and lease of stationary energy storage products and solar energy systems, and sale of solar energy systems incentives. The company was founded by Jeffrey B. Straubel, Elon Reeve Musk, Martin Eberhard, and Marc Tarpenning on July 1, 2003 and is headquartered in Austin, TX.
Related stocks
Tesla - The massive triangle breakout!🪩Tesla ( NASDAQ:TSLA ) is breaking out:
🔎Analysis summary:
Last month, we witnessed an incredible but expected rally of about +35% on Tesla. Furthermore, with this move Tesla is attempting to break above the previous all time highs. After bullish confirmation, this would also lead to a massiv

TSLA SELL++++ $360-370 to be testedAs I posted last week, and, clearly too early TSLA needs to test the $370 range where it broke out from. I do pat myself on the back for the epic bounce off support at $324.80 that needed to hold to see $426's and TSLA always goes further then we think both ways. We're way overdone and todays reve

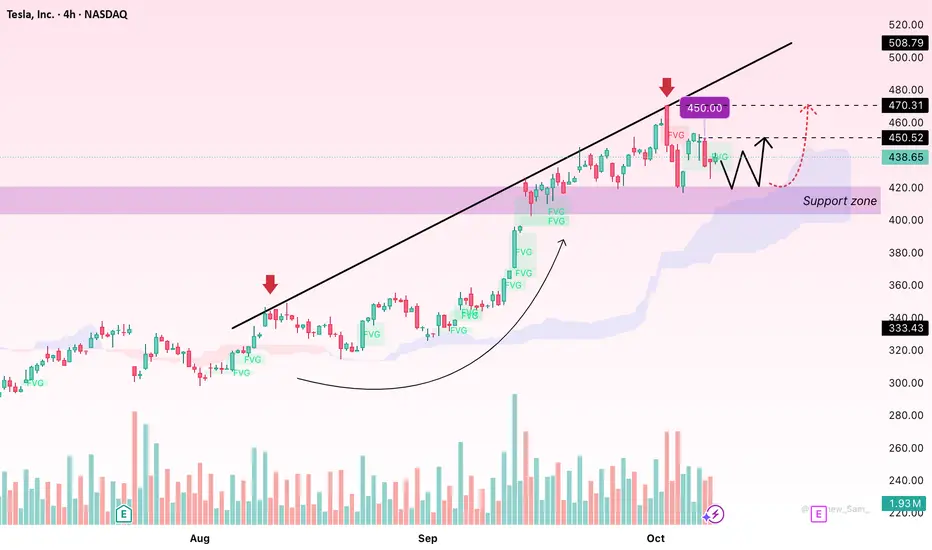
TSLA – Mild Pullback Before Resuming Its Upward TrajectoryHello everyone,
Tesla (TSLA) is showing a healthy technical pullback after an impressive rally, yet the broader bullish trend remains intact. The stock is currently hovering around $438.69, down 4.5% in the latest session — a move that reflects short-term profit-taking rather than a shift in marke
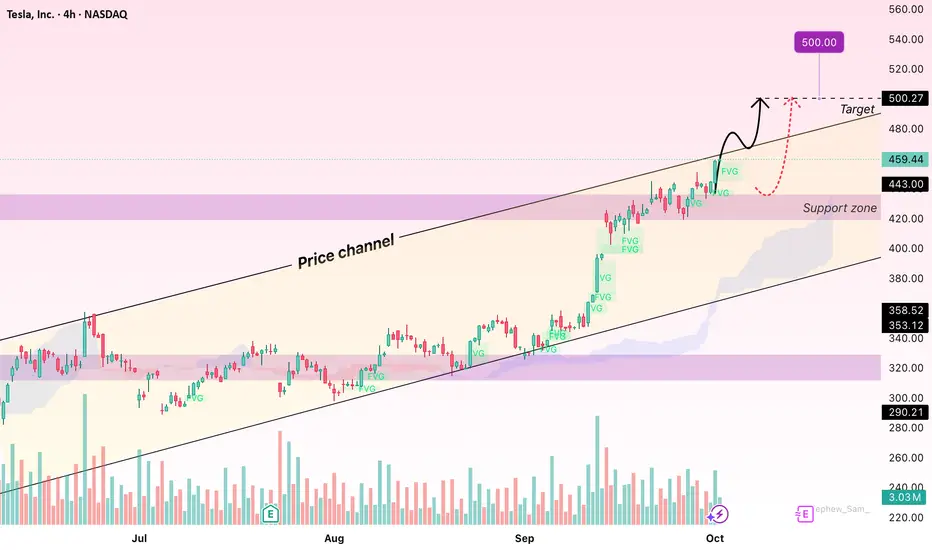
Tesla: Uptrend Intact – Eyeing the 470 Target AheadHello everyone,
Tesla (TSLA) has been extending its rally since mid-July. On the H4 chart, the uptrend remains intact with a clear sequence of higher highs and higher lows, signalling that buying pressure continues to dominate. The recent breakout above the $460 mark further strengthened the bulli
SMA 20: The most used, simple, and useful indicatorThe 20-period Simple Moving Average ( SMA 20 ) is easy to calculate and widely used, though often undervalued by traders eager for novelty. Its presence is notable in popular technical indicators like Bollinger Bands and Donchian Channels. Even the most purist price action traders include it on thei
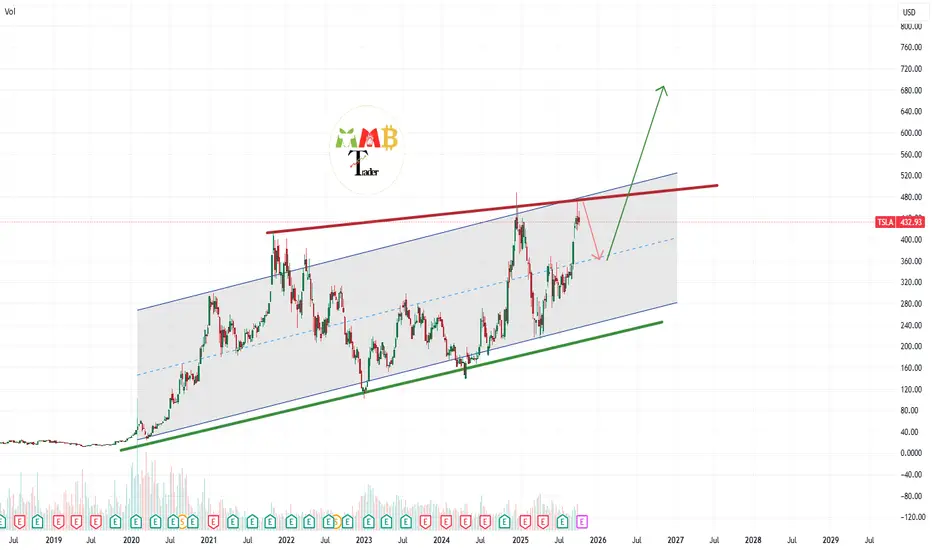
TSLA maybe retest support near 360$ but target is 700$Price is near channel resistance and red trendline sell pressure zone so we can expect short-term fall here like the red arrow but soon after that short-term fall we can expect heavy gain here like the green arrow on chart and targets like 600$ and more also if the red trendline break valid to the u
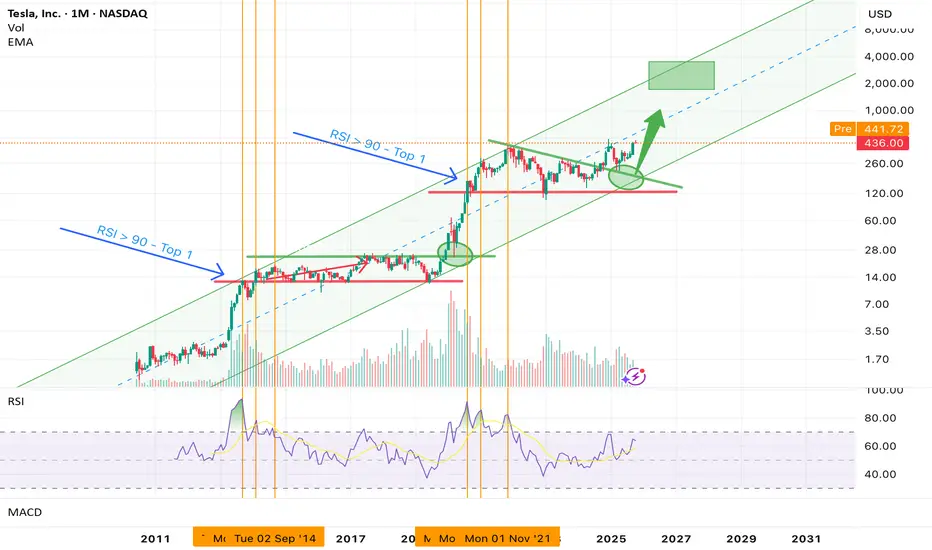
Tesla (TSLA) – RSI Signals New Bull Cycle, Not Near the TopTechnical View: Trend intact. Momentum constructive. Cycle still maturing. The RSI roadmap suggests the story is far from over — and the most explosive phase may still lie ahead.
Summary:
Back in April , we identified the $270–$320 region as a decisive long-term support zone — a confluence of t
Smart Money Support/Resistance + ATAI Volume Analysis —PracticalApplication
When these two indicators work together — Smart Money Support/Resistance (Lite) and ATAI Volume Analysis with Price Action — the chart begins to speak a clearer language: one defines where the reaction zones form, and the other explains what happens inside them. The purpose is not predi
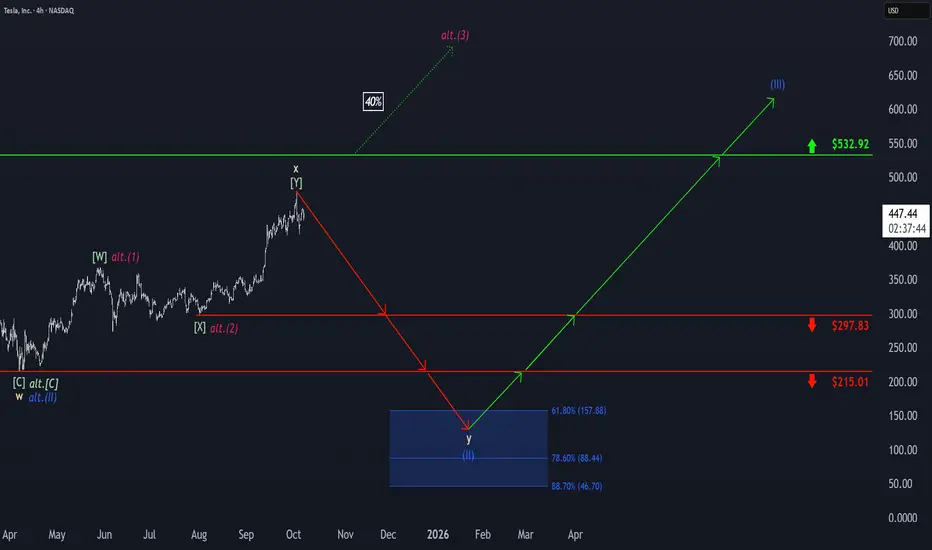
Tesla: Top Established!Tesla initially hit a new high before quickly reversing course with a notable move to the downside. As a result, we now view the corrective upward movement of beige wave x as complete and anticipate further sell-offs as part of wave y. The stock is expected to gradually break below the support level
See all ideas
Summarizing what the indicators are suggesting.
Neutral
SellBuy
Strong sellStrong buy
Strong sellSellNeutralBuyStrong buy
Neutral
SellBuy
Strong sellStrong buy
Strong sellSellNeutralBuyStrong buy
Neutral
SellBuy
Strong sellStrong buy
Strong sellSellNeutralBuyStrong buy
An aggregate view of professional's ratings.
Neutral
SellBuy
Strong sellStrong buy
Strong sellSellNeutralBuyStrong buy
Neutral
SellBuy
Strong sellStrong buy
Strong sellSellNeutralBuyStrong buy
Neutral
SellBuy
Strong sellStrong buy
Strong sellSellNeutralBuyStrong buy
Displays a symbol's price movements over previous years to identify recurring trends.
TSLA4317805
Tesla Energy Operations, Inc. 5.45% 17-DEC-2030Yield to maturity
10.02%
Maturity date
Dec 17, 2030
TSLA4296328
Tesla Energy Operations, Inc. 5.45% 16-OCT-2030Yield to maturity
9.28%
Maturity date
Oct 16, 2030
TSLA4290558
Tesla Energy Operations, Inc. 5.45% 01-OCT-2030Yield to maturity
8.99%
Maturity date
Oct 1, 2030
TSLA4247202
Tesla Energy Operations, Inc. 5.45% 21-MAY-2030Yield to maturity
8.69%
Maturity date
May 21, 2030
TSLA4324758
Tesla Energy Operations, Inc. 4.7% 14-JAN-2026Yield to maturity
8.00%
Maturity date
Jan 14, 2026
TSLA4286421
Tesla Energy Operations, Inc. 5.45% 17-SEP-2030Yield to maturity
7.89%
Maturity date
Sep 17, 2030
TSLA4231716
Tesla Energy Operations, Inc. 5.45% 23-APR-2030Yield to maturity
7.60%
Maturity date
Apr 23, 2030
TSLA4250220
Tesla Energy Operations, Inc. 5.45% 29-MAY-2030Yield to maturity
7.40%
Maturity date
May 29, 2030
TSLA4313161
Tesla Energy Operations, Inc. 5.45% 03-DEC-2030Yield to maturity
7.15%
Maturity date
Dec 3, 2030
TSLA4224815
Tesla Energy Operations, Inc. 5.45% 26-MAR-2030Yield to maturity
6.78%
Maturity date
Mar 26, 2030
TSLA4265473
Tesla Energy Operations, Inc. 5.45% 16-JUL-2030Yield to maturity
6.72%
Maturity date
Jul 16, 2030
See all TSLA bonds
Curated watchlists where TSLA is featured.


Frequently Asked Questions
The current price of TSLA is 435.54 USD — it has decreased by −1.97% in the past 24 hours. Watch Tesla, Inc. stock price performance more closely on the chart.
Depending on the exchange, the stock ticker may vary. For instance, on NASDAQ exchange Tesla, Inc. stocks are traded under the ticker TSLA.
TSLA stock has fallen by −8.60% compared to the previous week, the month change is a 23.42% rise, over the last year Tesla, Inc. has showed a 78.63% increase.
We've gathered analysts' opinions on Tesla, Inc. future price: according to them, TSLA price has a max estimate of 600.00 USD and a min estimate of 120.00 USD. Watch TSLA chart and read a more detailed Tesla, Inc. stock forecast: see what analysts think of Tesla, Inc. and suggest that you do with its stocks.
TSLA reached its all-time high on Dec 18, 2024 with the price of 488.54 USD, and its all-time low was 1.00 USD and was reached on Jul 7, 2010. View more price dynamics on TSLA chart.
See other stocks reaching their highest and lowest prices.
See other stocks reaching their highest and lowest prices.
TSLA stock is 2.94% volatile and has beta coefficient of −0.16. Track Tesla, Inc. stock price on the chart and check out the list of the most volatile stocks — is Tesla, Inc. there?
Today Tesla, Inc. has the market capitalization of 1.46 T, it has increased by 1.92% over the last week.
Yes, you can track Tesla, Inc. financials in yearly and quarterly reports right on TradingView.
Tesla, Inc. is going to release the next earnings report on Oct 22, 2025. Keep track of upcoming events with our Earnings Calendar.
TSLA earnings for the last quarter are 0.40 USD per share, whereas the estimation was 0.40 USD resulting in a 0.70% surprise. The estimated earnings for the next quarter are 0.53 USD per share. See more details about Tesla, Inc. earnings.
Tesla, Inc. revenue for the last quarter amounts to 22.50 B USD, despite the estimated figure of 22.28 B USD. In the next quarter, revenue is expected to reach 25.96 B USD.
TSLA net income for the last quarter is 1.17 B USD, while the quarter before that showed 409.00 M USD of net income which accounts for 186.55% change. Track more Tesla, Inc. financial stats to get the full picture.
No, TSLA doesn't pay any dividends to its shareholders. But don't worry, we've prepared a list of high-dividend stocks for you.
As of Oct 9, 2025, the company has 125.67 K employees. See our rating of the largest employees — is Tesla, Inc. on this list?
EBITDA measures a company's operating performance, its growth signifies an improvement in the efficiency of a company. Tesla, Inc. EBITDA is 11.50 B USD, and current EBITDA margin is 13.44%. See more stats in Tesla, Inc. financial statements.
Like other stocks, TSLA shares are traded on stock exchanges, e.g. Nasdaq, Nyse, Euronext, and the easiest way to buy them is through an online stock broker. To do this, you need to open an account and follow a broker's procedures, then start trading. You can trade Tesla, Inc. stock right from TradingView charts — choose your broker and connect to your account.
Investing in stocks requires a comprehensive research: you should carefully study all the available data, e.g. company's financials, related news, and its technical analysis. So Tesla, Inc. technincal analysis shows the buy rating today, and its 1 week rating is buy. Since market conditions are prone to changes, it's worth looking a bit further into the future — according to the 1 month rating Tesla, Inc. stock shows the buy signal. See more of Tesla, Inc. technicals for a more comprehensive analysis.
If you're still not sure, try looking for inspiration in our curated watchlists.
If you're still not sure, try looking for inspiration in our curated watchlists.