LONG NIFTY 50 and BANK NIFTY TodayGood time to LONG Bank Nifty and Nifty today… at its decent Support. OVERSOLD condition in both
BANKNIFTY trade ideas

Caught in a tight zone Bank Nifty is stuck in a difficult zone from where it has a lot more to fall than NIFTY before we can say it's with the bears.


BANKNIFTY: Choose Noise or Less!Place of action and attraction. Piece of Misery and Mystery.
Some choose a day, some choose week, some choose months, the end is the channel, but inability to channel one's thoughts and resultant actions.
Blame hunting, stops, Algo. Algo is GIGO. It does not do anything that you did not ask for!
While short term moves are nothing but noise, there are ways and means to reduce that decibel and find your solace.
This is where the noiseless charts come handy. The tell a story that can be seen differently
The channel looks different, while one can pencil the area of support.
Last support for the bulls is 47200 while the bears it is 48800
Some places rosy, some moody. Net this will go along with others than these leading others. PSU banks showing stress and supply, some places the 14-year supply line holding the incremental gain, despite the big picture being intact.
That circles the near term 47300-48300 range.

BANK NIFTY INTRADAY LEVELS FOR 09/05/2024BUY ABOVE - 48220
SL - 48050
TARGETS - 48460,48660,48800
SELL BELOW - 47900
SL - 48050
TARGETS - 47730,47560,47400
NO TRADE ZONE - 47900 to 48220
Previous Day High - 48220
Previous Day Low - 47900
Based on price action major support & resistance's are here, the red lines acts as resistances, the green lines acts as supports. If the price breaks the support/resistance, it will move to the next support/resistance line. White lines indicates previous day high & low, high acts as a resistance & low acts as a support for next day.
Trendlines are also significant to price action. If the price is above/below the trendlines, can expect an UP/DOWN with aggressive move.
Please NOTE: this levels are for intraday trading only.
Disclaimer - All information on this page is for educational purposes only,
we are not SEBI Registered, Please consult a SEBI registered financial advisor for your financial matters before investing And taking any decision. We are not responsible for any profit/loss you made.
Request your support and engagement by liking and commenting & follow to provide encouragement
HAPPY TRADING 👍

BANKNIFTY Trading Plan for 09-May-2024
Gap Up Opening:
Consider buying if BANKNIFTY opens above 48300 and sustains with support at 48200, targeting 48531 – 48621 with a stop loss at 48150. Short trades can be considered if the price sustains below 47950, targeting 47824 – 47574.
Flat Opening:
If BANKNIFTY opens flat and sustains above 48177 for the first trading hour, consider buying with targets at 48300 – 48531 – 48621. Short trades can be initiated if the price breaks down below 47824, targeting 47574, with a reversal trade possibility and a stop loss set 70 points below the entry point.
Gap Down Opening:
In case of a gap down below 47900, consider buying if the price takes support near 47824-47800, targeting 48209 – 48304. Short trades can be initiated if the price starts trading below 47800, targeting 47574 with a stop loss at 47900.
Conclusion:
The trading plan provides guidelines for buying and shorting opportunities based on the opening price and key support/resistance levels. It emphasizes setting appropriate stop losses to manage risk effectively.
Disclaimer:
Trading in the stock market involves risks and may not be suitable for everyone. The trading plan provided is for informational purposes only and should not be considered as financial advice. Traders should conduct their own research and consult with a financial advisor before making any trading decisions.

BANK NIFTY S/R for 9/5/24Support and Resistance Levels: In technical analysis, support and resistance levels are significant price levels where buying or selling interest tends to be strong. They are identified based on previous price levels where the price has shown a tendency to reverse or find support.
Support levels are represented by the green line and green shade, indicating areas where buying interest may emerge to prevent further price decline.
Resistance levels are represented by the red line and red shade, indicating areas where selling pressure may arise to prevent further price increases. Traders often consider these levels as potential buying or selling opportunities.
Breakouts: Breakouts occur when the price convincingly moves above a resistance level (red shade) or below a support level (green shade). A bullish breakout above resistance suggests the potential for further price increases, while a bearish breakout below support suggests the potential for further price declines. Traders pay attention to these breakout signals as they may indicate the start of a new trend or significant price movement.
Disclosure: I am not SEBI registered. The information provided here is for learning purposes only and should not be interpreted as financial advice. It is important to consult with a qualified financial advisor before making any investment decisions. Tweets neither advice nor endorsement.

BANKNIFTY in 1Hour TF AnalysisBanknifty at present trading in chanel we all can see clearly so according to chanel 47400-47500 is support area so we can expect bounce from this zone and if break this zone then we may see another fall

Ritual pendingIf the ritual we mentioned yesterday plays out, a PUT buy in Bank nifty could be the trade of the year. But again Bank Nifty is also at a crucial FVG level. And to the bottom of the channel, it has a long way to go.

NIFTYBANK: Precarious RangeFall shaper, all round. Bulls were in loss of shape, loss of words, circular search.
No google, only Wobble.
The big picture is in a Range, short term is precarious. Fall looks impulse. Close near the vital area of 48200-300.
Next level of support 47900 that is the hope. Will this support cushion means fall somewhere else? PSU and Real Estate took the beating, FMCG bounce back. Discretionary going up means market is risk off, hiding for safety. This can percolate to the select IT. Watch for the same.
Australian Central Bank kept rates unchanged, BOC commentary, other data of less relevance. Markets negatives will consider, positives ignore.
Next phase of polling markets; would sense either side. Good part is decent correction before the final counting is actually healthy for the up move than otherwise.
Stick and Stuck to the Channell story. Stay there till it gives away. This Index is not as bearish as one would like to in the medium term. 47850-48550.
BANK NIFTY may cross down 48000 level Bank Nifty may fall below 48000 level. The demand zone for a good long entry - 47800

BANK NIFTY INTRADAY LEVELS FOR 08/05/2024BUY ABOVE - 48460
SL - 48220
TARGETS - 48660,48800,48970
SELL BELOW - 48220
SL - 48460
TARGETS - 48120,47940,47730
NO TRADE ZONE - 48220 to 48460
Previous Day High - 49970
Previous Day Low - 48220
Based on price action major support & resistance's are here, the red lines acts as resistances, the green lines acts as supports. If the price breaks the support/resistance, it will move to the next support/resistance line. White lines indicates previous day high & low, high acts as a resistance & low acts as a support for next day.
Trendlines are also significant to price action. If the price is above/below the trendlines, can expect an UP/DOWN with aggressive move.
Please NOTE: this levels are for intraday trading only.
Disclaimer - All information on this page is for educational purposes only,
we are not SEBI Registered, Please consult a SEBI registered financial advisor for your financial matters before investing And taking any decision. We are not responsible for any profit/loss you made.
Request your support and engagement by liking and commenting & follow to provide encouragement
HAPPY TRADING 👍

BANKNIFTY Trading Plan for May 8, 2024Gap Up Opening Scenario:
If BANKNIFTY opens with a gap above 48500 and sustains above 48450 for the first hour, a recovery towards 48677 may occur. Further upside movement towards 49000-49100 is possible if the price holds above 48677. Conversely, trading below 48300 may signal a breakdown towards 47971-47823.
Flat Opening Scenario:
In case of a flat opening between 48436-48260, a break above 48436 could trigger an upside move towards 48600-48677. Conversely, a break below 48250 may lead to further downside towards 47971-47823.
Gap Down Opening Scenario:
A gap down opening below 48200 could drive BANKNIFTY towards 47971-47823 initially. However, a recovery above 48000 may signal a buying opportunity for a rebound towards 48600-48677-48800-49000.
Conclusion:
Traders should monitor price actions and key levels mentioned above for making informed trading decisions. Risk management and adaptability to market conditions are essential for successful trading.
Disclaimer:
The trading plan outlined above is for educational purposes and should not be construed as financial advice. Trading carries inherent risks, and individuals should conduct their own research or consult with financial advisors before making any investment decisions.

BANK NIFTY S/R for 8/5/24Support and Resistance Levels: In technical analysis, support and resistance levels are significant price levels where buying or selling interest tends to be strong. They are identified based on previous price levels where the price has shown a tendency to reverse or find support.
Support levels are represented by the green line and green shade, indicating areas where buying interest may emerge to prevent further price decline.
Resistance levels are represented by the red line and red shade, indicating areas where selling pressure may arise to prevent further price increases. Traders often consider these levels as potential buying or selling opportunities.
Breakouts: Breakouts occur when the price convincingly moves above a resistance level (red shade) or below a support level (green shade). A bullish breakout above resistance suggests the potential for further price increases, while a bearish breakout below support suggests the potential for further price declines. Traders pay attention to these breakout signals as they may indicate the start of a new trend or significant price movement.
Disclosure: I am not SEBI registered. The information provided here is for learning purposes only and should not be interpreted as financial advice. It is important to consult with a qualified financial advisor before making any investment decisions. Tweets neither advice nor endorsement.

BNF - 15 min Chart Bullish ViewBNF is in a range now between 48500 - 48200. If the price closes above 48492 expect a short bullish action for trade. This is only bullish point of view!
So entry around 48500 &
Targets are as follows:
1st = 48700
2nd = 48870
3rd = 49100
4th = 49240
These are the levels from where the prices can reverse back too. its upto the person's awareness about the PA.

BNF NIFTY HHHLshowing Higher High Higher low
Taken 45838 support will sustain ?
trendline support 45340
RSI daily below 60 and weekly also 60 (major weakness)
200 EMA 44900
another support 45600 as yesterday low

Bank NIfty 15 min Chart View!Post big moves, Index behaving consolidated with 1 or 2 spontaneous move! Let it be in the range and wait for the hunting the prey.
Tip: Once the price break down and reverse back into the entry zone - expect big directional move. In such scenario avoid holding and try to achieve 1:2/ 1:3 target and exit immediately!

Bulls on slippery slope. The last time Bank Nifty tried going up without testing the bottom of this channel was in Jan 2024. Look at what happened then. We opened to a large Gap down and completed the ritual. That ritual is pending in Bank Nifty. If that is the case, we will see a sting into the bottom before we continue higher.

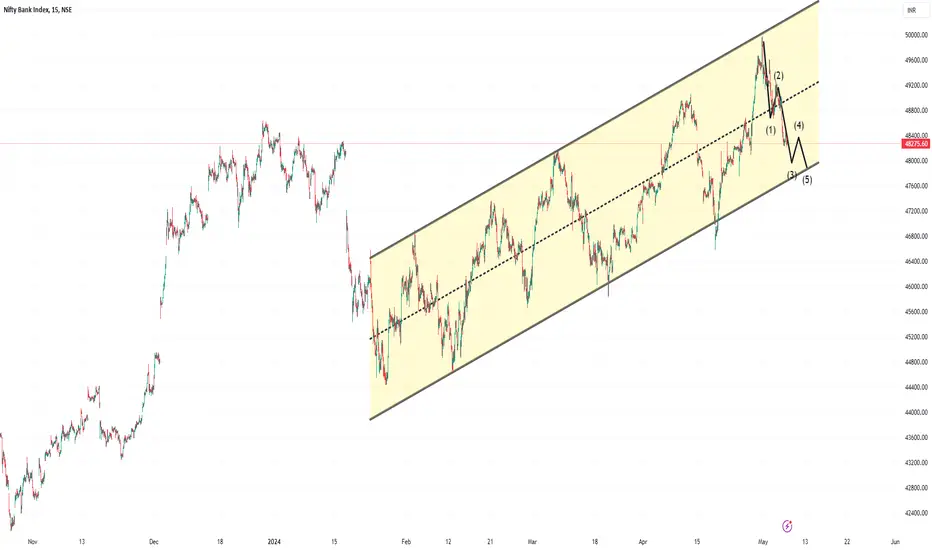
NIFTYBANK: The banks and the Waves!There are waves, there are counts, then there are banks.
Choose the side of the bank where there is plenty of peace.
This one moves or has been moving in this channel since February and has been fairly respeceted.
We are in the middle of the channel. That is as interesting as drawing the waves, within the channel.
Just see them, a break of redline, draws the move to the other channel side. Just the pendulum swing, nothing else. Big picture is intact.
Lower frames the swing is what markets looking.
Just the supports, yesterday low below that 48700-48450
Supply 49180-49380-49680

BankniftyBankNifty Chart Analysis.........07/05/2024
Long: above 49020 level.
Sl : 50 point premium
Target : 49200 / 49400 / 49600 / 49860
Enjoy !
Note : You have to book some profit at 49400 level and also trail the stop-loss to 49200 in the remaining positions.

BANKNIFTY Plan for 07-May-2024
Gap Up Opening:
If BANKNIFTY opens above 49000 and sustains above 49020 for the first hour, it suggests bullish momentum. Consider buying with targets at 22300 – 22400. However, if it fails to sustain and starts trading below 48785, expect a drop to 48508- 48424. In this range, consider buying with a SL of 22380 for targets at 48785 – 48950.
Flat Opening:
On a flat opening, if BANKNIFTY breaks 48960 and sustains above 49020 for the first hour, it indicates upward movement towards 49300 -49400. Beyond this, it might trade sideways to negative. Breaking and sustaining above 49400 could lead to a sharp move towards 49725. Conversely, if it breaks 49780 on the downside, expect a drop to 48508 – 48424.
Gap Down Opening:
If BANKNIFTY opens below 49700 and faces rejections at 48785 – 48800, it might drop to 48508 – 48242. These levels could be considered as buying opportunities. However, if it breaks 48400, anticipate a sharp decline towards 47853 in the coming days.
Disclaimer: This plan is based on technical analysis and market conditions as of the specified date. Traders should exercise their own discretion and consider other factors before making any trading decisions. The market is subject to inherent risks, and past performance is not indicative of future results.

Banknifty Intraday Levels : 07-May-24Currently banknifty making X pattern ,
Breakout in any one direction price will go down or up according breakout direction wait for confirmation in lower timeframe
Bullish > 49200
Bearish <48750

BANK NIFTY INTRADAY LEVELS FOR 07/05/2024BUY ABOVE - 48970
SL - 48800
TARGETS - 49130,49300,49480
SELL BELOW - 48800
SL - 48970
TARGETS - 48660,48500,48400
NO TRADE ZONE - 48800 to 48970
Previous Day High - 49300
Previous Day Low - 48800
Based on price action major support & resistance's are here, the red lines acts as resistances, the green lines acts as supports. If the price breaks the support/resistance, it will move to the next support/resistance line. White lines indicates previous day high & low, high acts as a resistance & low acts as a support for next day.
Trendlines are also significant to price action. If the price is above/below the trendlines, can expect an UP/DOWN with aggressive move.
Please NOTE: this levels are for intraday trading only.
Disclaimer - All information on this page is for educational purposes only,
we are not SEBI Registered, Please consult a SEBI registered financial advisor for your financial matters before investing And taking any decision. We are not responsible for any profit/loss you made.
Request your support and engagement by liking and commenting & follow to provide encouragement
HAPPY TRADING 👍
