BANKNIFTY trade ideas

nifty & Bank nifty booked good profit. Understanding how the market operates. Keeping up with global news events which impact financial markets. Monitoring your open positions.

[INTRADAY] #BANKNIFTY PE & CE Levels(13/03/2024) Today will be gap up opening in BANKNIFTY. After opening if banknifty sustain above 47050 level then possible upside rally of 400-500 points upto 47450 level & this rally can extend another 400 points if market gives breakout 47550 level in todays session.Any Major downside only expected in case banknifty starts trading below 46950 level.also possible Reversal downside 47450 level.

Go short on Banknifty on 13th Feb 2024Trading based on Fibonacci retracement in 15 mins chart.
Wait for the candle to make bearish candle in 3 mins or 5 mins time frame at the area marked in yellow to confirm entry.

Go short on Banknifty on 13th Feb 2024Trading based on Fibonacci retracement in 15 mins chart.
Wait for the candle to make bearish candle in 3 mins or 5 mins time frame at the area marked in yellow to confirm entry.

:BANKNIFTY GETTEX:NSE : BANKNIFTY
1. price makes rsi bullish divergence
2. price close to major support level
3. price + rsi bullish divergence + support area.
if planing to trade make it t stop loss levels below the support area.

BANKNIFTY- Intraday Levels - 13th March 2024** Level for Index -
** Major Level Only -
If BANKNIFTY sustain above 47387 then 47508 to 47551 then 47985 to 48071
If BANKNIFTY sustain below 47263 then 46872 then 46681 then 46644 then 46217 to 46164
Consider some buffer points in above levels.
Please do your due diligence before trading or investment.
**Disclaimer -
I am not a SEBI registered analyst or advisor. I does not represent or endorse the accuracy or reliability of any information, conversation, or content. Stock trading is inherently risky and the users agree to assume complete and full responsibility for the outcomes of all trading decisions that they make, including but not limited to loss of capital. None of these communications should be construed as an offer to buy or sell securities, nor advice to do so. The users understands and acknowledges that there is a very high risk involved in trading securities. By using this information, the user agrees that use of this information is entirely at their own risk.
Thank you.

BANK NIFTY INTRADAY LEVELS FOR 13/03/2024BUY ABOVE - 47400
SL - 47230
TARGETS - 47500,47650,47750
SELL BELOW - 47230
SL - 47400
TARGETS - 47080,46900,46750
NO TRADE ZONE - 47210 to 47400
Previous Day High - 47800
Previous Day Low - 46900
Based on price action major support & resistance's are here, the red lines acts as resistances, the green lines acts as supports. If the price breaks the support/resistance, it will move to the next support/resistance line. White lines indicates previous day high & low, high acts as a resistance & low acts as a support for next day.
Trendlines are also significant to price action. If the price is above/below the trendlines, can expect an UP/DOWN with aggressive move.
Please NOTE: this levels are for intraday trading only.
Disclaimer - All information on this page is for educational purposes only,
we are not SEBI Registered, Please consult a SEBI registered financial advisor for your financial matters before investing And taking any decision. We are not responsible for any profit/loss you made.
Request your support and engagement by liking and commenting & follow to provide encouragement
HAPPY TRADING 👍

BANKNIFTY : Levels and Plan for 13-Mar-2024
Gap Up Opening above 47500:
Should BANKNIFTY open with a gap up above 47500, observe if it sustains above this level. Resistance can be expected at 47598-47661. If the index holds this range and trades higher, targets at 47818-47876 are plausible, potentially indicating a reversal. Conversely, if prices fail to sustain at 47598 and drop below 47500, consider a short trade targeting 47200-47174.
Flat Opening:
For a flat opening, look for a buying opportunity near 47200-47174 with a stop loss at 47130 and targets at 47500-46598-47661. If prices do not hold at 47130, they may reach 47000, where a buy trade can be considered for targets at 47300-47400. Below 47000, look for a buying opportunity near 46889-46800.
Gap Down Opening below 47100:
In case of a gap down opening below 47100, consider a buy trade with a stop loss at 47000 and targets at 47200-47400. Below 46800, prices may reach 46600 before a potential recovery.

BANKNIFTY ANALYSIS FOR 12 MARCHHi guy's
Tomorrow Banknifty expiry & today you can see that volatile day.
For tomorrow maybe banknifty open gapup.
If Banknifty want's to go upsides then need to generate more liquidity.
Also banknifty follow the trendline it's act as resistance if Banknifty able to close above this trendline in 15 min then banknifty will go upsides.
But tomorrow is decision making if breaks trendline then go up & if breaks support then you can see more downfall till 46000.

Bank Nifty - A simple puzzle for 13th March,2024! A puzzle for the simple and smart mind!
Long = 47400
Short = 47200

BANK NIFTY S/R for 13/3/24Support and Resistance Levels: In technical analysis, support and resistance levels are significant price levels where buying or selling interest tends to be strong. They are identified based on previous price levels where the price has shown a tendency to reverse or find support.
Support levels are represented by the green line and green shade, indicating areas where buying interest may emerge to prevent further price decline.
Resistance levels are represented by the red line and red shade, indicating areas where selling pressure may arise to prevent further price increases. Traders often consider these levels as potential buying or selling opportunities.
Breakouts: Breakouts occur when the price convincingly moves above a resistance level (red shade) or below a support level (green shade). A bullish breakout above resistance suggests the potential for further price increases, while a bearish breakout below support suggests the potential for further price declines. Traders pay attention to these breakout signals as they may indicate the start of a new trend or significant price movement.
Keltner Channel: The Keltner Channel is a technical indicator that uses an exponential moving average (EMA) and an average true range (ATR) to create an upper and lower channel around the price action. The upper line of the channel represents the upper limit of the average range, and the lower line represents the lower limit. Traders can use the Keltner Channel to identify potential long and short positions.
Long Position: A long position may be considered when the price is trading above the upper line of the Keltner Channel. This suggests that the price is trading above the average range and may continue in an upward trend, potentially offering buying opportunities.
Short Position: A short position may be considered when the price is trading below the lower line of the Keltner Channel. This suggests that the price is trading below the average range and may continue in a downward trend, potentially offering selling opportunities.
Disclosure: I am not SEBI registered. The information provided here is for learning purposes only and should not be interpreted as financial advice. It is important to consult with a qualified financial advisor before making any investment decisions. Tweets neither advice nor endorsement.

Bank Nifty levels (for 13-03-2024)Bank Nifty levels (for 13-03-2024) are given for educational purposes only

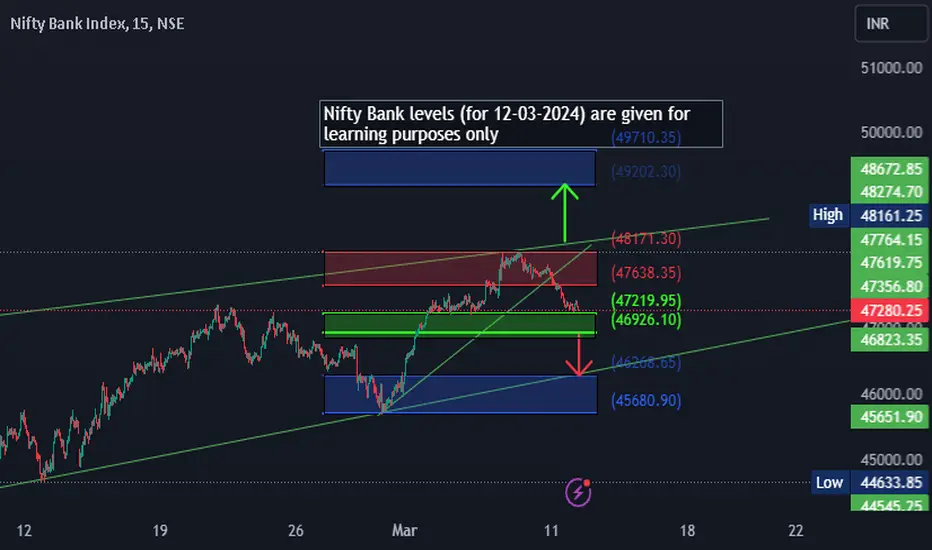
Nifty Bank levels (for 12-03-2024)Nifty Bank levels (for 12-03-2024) are given for learning purposes only
BANKNIFTY TRADE OPPBANKNIFTY TRADE OPP
As you can see the BANKNIFTY has broken out the h&S neckline.
now we are in retest phase. if it comes to the neckline and find support of neckline we can see a blast upside.
Same structure is observed in the hdfcbank.
this is not in any means a trade/invest advice. pls consult your fa for any buy sell Reco.
thank you.

BANKNIFTY- Intraday Levels - 12th March 2024** Only Major levels
**use this levels for Future as well as Index
If BANKNIFTY sustain above 47464 or 47508 then 48025 to 48071
If BANKNIFTY sustain below 47263 then 46548 to 46502
Consider some buffer points in above levels.
Please do your due diligence before trading or investment.
**Disclaimer -
I am not a SEBI registered analyst or advisor. I does not represent or endorse the accuracy or reliability of any information, conversation, or content. Stock trading is inherently risky and the users agree to assume complete and full responsibility for the outcomes of all trading decisions that they make, including but not limited to loss of capital. None of these communications should be construed as an offer to buy or sell securities, nor advice to do so. The users understands and acknowledges that there is a very high risk involved in trading securities. By using this information, the user agrees that use of this information is entirely at their own risk.
Thank you.


BANK NIFTY INTRADAY LEVELS FOR 12/03/2024BUY ABOVE - 47400
SL - 47230
TARGETS - 47500,47650,47750
SELL BELOW - 47230
SL - 47400
TARGETS - 47080,46900,46750
NO TRADE ZONE - 47230 to 47400
Previous Day High - 47880
Previous Day Low - 47230
Based on price action major support & resistance's are here, the red lines acts as resistances, the green lines acts as supports. If the price breaks the support/resistance, it will move to the next support/resistance line. White lines indicates previous day high & low, high acts as a resistance & low acts as a support for next day.
Trendlines are also significant to price action. If the price is above/below the trendlines, can expect an UP/DOWN with aggressive move.
Please NOTE: this levels are for intraday trading only.
Disclaimer - All information on this page is for educational purposes only,
we are not SEBI Registered, Please consult a SEBI registered financial advisor for your financial matters before investing And taking any decision. We are not responsible for any profit/loss you made.
Request your support and engagement by liking and commenting & follow to provide encouragement
HAPPY TRADING 👍

Zone analysis Bank Nifty Zone Analysis
When Bank Nifty breaks below the black zone, the next support and targets will follow according to the zones indicated on the chart. Conversely, if it breaks above, targets could extend to the swing high or all-time high.
For strong confirmation, utilize multiple confirmations.

[INTRADAY] #BANKNIFTY PE & CE Levels(12/03/2024) Today will be gap up opening in BANKNIFTY. After opening if banknifty sustain above 47550 level then possible upside rally of 400-500 points upto 47950 level in todays session.Any Major downside only expected in case banknifty starts trading below 47450 level to 47050 level & this rally can extend another 400 points if market gives breakdown 46950 level.

BANKNIFTY forms a CHANNEL patternBANKNIFTY forms a CHANNEL pattern inside a TRIANGLE pattern
Keep watching for any greater movement

Bank Nifty - March 12 2024My analysis of Bank Nifty fall on March 12 2024. Bank nifty might fall a bit in the start and then will move up.
