Banknifty Possible For small Correction Banknifty Possible For small Downside Correction If sustain Below 48400 Next possible target Expected 46950 cmp.48970
BANKNIFTY trade ideas

BANKNIFTY TRADING LEVELS ONLY FOR 13-05-2024Explanation:
This is a very useful trading system. This means that you should not take a trade blindly, but rather that there is another confirmation to take the trade you can use this for perfect entry and perfect exit
This trading opportunity is based on volume, previous price, and price range , are included
Entry/Exit point's:
- It has very easy entry and exit points
- In this pair of lines with two colors are given (RED AND BLUE)
- In this the blue line is used to take long entry and the red line is used to take short entry (But it is all based on a more conformation from your trading plan)
Stop Loss/Take Profit:
Stop Loss
- According to this, if you take a long trade, its stop loss will be the red line just below ( A trade can exit either when the price crosses the red line or the 5 minute candlestick crosses the red line. (This can be done according to your preference) )
- A short entry should use the opposite rules to a long entry
Take Profit
-When you take a long entry according to the profit to be booked is on the next red line above. ( Or if there are other reasons, it can be a safe exit )
- Opposite rules for booking profit on long entry are to book profit on short trade. ( The blue line above is the stop loss of short entry )
Timeframe:
According to this, the time frame you should use while taking trades is 5 minutes time frames . (5 minute time frame works well in this)
Risk Disclaimer:
Trading carries significant risk and is not suitable for all traders. You may lose some or all of your capital in a matter of minutes or hours. Market conditions can change rapidly, and prices can move against you quickly. You may not always be able to exit at a favorable price, and you may be required to hold a position overnight, exposing yourself to additional risk. Day trading involves high risk, high leverage, and high stakes, and you should only trade with funds you can afford to lose. Please carefully consider your financial situation, risk tolerance, and trading objectives before engaging in day trading.
Engagement:
Share your insights, ask questions, and learn from others in the community. Whether you're a seasoned pro or just starting out, we're all in this together.
What's your take on the current market conditions? Which trading strategies are working for you? Let's discuss and help each other grow as traders!
Comment below and let's get the conversation started!
Original Content:
This trading setup is the result of my own innovation and expertise, and is not based on any publicly available information or third-party systems. It is a reflection of my dedication to developing a competitive edge in the markets.

BANKNIFTY- Intraday Levels -13th May 2024If BANKNIFTY sustain above 47512 then 47603 to 47657 then 47748 to 47803 then 47893 to 47948 then 48038 to 48093
If BANKNIFTY sustain below 47367 or 47313 then 47196 to 47168 then 47077 to 47023 then 46932 to 46878 then 46787 to 46732
Consider some buffer points in above levels.
Please do your due diligence before trading or investment.
**Disclaimer -
I am not a SEBI registered analyst or advisor. I does not represent or endorse the accuracy or reliability of any information, conversation, or content. Stock trading is inherently risky and the users agree to assume complete and full responsibility for the outcomes of all trading decisions that they make, including but not limited to loss of capital. None of these communications should be construed as an offer to buy or sell securities, nor advice to do so. The users understands and acknowledges that there is a very high risk involved in trading securities. By using this information, the user agrees that use of this information is entirely at their own risk.
Thank you.

NIFTYBANK: Leader DictatesSBI punches its best performance, stands still, holds, but broader indices close red once again.
Economic data comes mixed, and markets are not going to focus for some time on this.
PSU Banks on the 14 year supply line, not all of them but many of them. Weaker spots continue on heavy weights like HDFC, no where to go! roam around.
SBI lone warrior, along with it couple of them. However, individual spaces look attractive from big picture point of view any further erosion. The question is how further, or if there is any further.
NIFTY looks for more corrective fall, as part of the big picture, will BANKNIFTY stand aside? Both need to talk to each other for any secular move either side. A one day diversion is very much in order.
From the channel pencilled in, the price action in recent times is below the mid of the channel, that is the cause for worry, that price may try the lower end of the channel than other wise, very much in order.
But how deep, how sharp is one has to wait and see, if and when it unfolds. This index has the inbuilt habit of reversal from extremes, regardless of the technical set-up, but then, are we near the extreme is the first question to pose.
Supports 47200-46880-46400
Supply 47800-48150-48350

Bank Nifty May 3rd week levels to observeThese are the important levels based on different theories like Gann, FIB, and Order block.

BANK NIFTY INTRADAY LEVELS FOR 13/05/2024BUY ABOVE - 47560
SL - 47400
TARGETS - 47730,47900,48050
SELL BELOW - 47400
SL - 47560
TARGETS - 47200,47000,46800
NO TRADE ZONE - 47400 to 47560
Previous Day High - 47900
Previous Day Low - 47400
Based on price action major support & resistance's are here, the red lines acts as resistances, the green lines acts as supports. If the price breaks the support/resistance, it will move to the next support/resistance line. White lines indicates previous day high & low, high acts as a resistance & low acts as a support for next day.
Trendlines are also significant to price action. If the price is above/below the trendlines, can expect an UP/DOWN with aggressive move.
Please NOTE: this levels are for intraday trading only.
Disclaimer - All information on this page is for educational purposes only,
we are not SEBI Registered, Please consult a SEBI registered financial advisor for your financial matters before investing And taking any decision. We are not responsible for any profit/loss you made.
Request your support and engagement by liking and commenting & follow to provide encouragement
HAPPY TRADING 👍

banknifty- revesal ideabanknifty likely to end down swing at 47186 levels ,reason for that is it cluster formance of multiple key trendlines and 360 degree down move ending , might indicate potential
upside likely target 48232.so shorting at this point is not fruitfull look to reversal on late monday or tuesday for target of 48231..

BANKNIFTY Analysis for May 13, 2024: Levels and Plan
Similar to NIFTY, BANKNIFTY witnessed bearish dominance last week, closing with a bearish weekly candlestick, yet maintaining a crucial support level around 47305 on the hourly timeframe. For the upcoming week, two key scenarios are under consideration:
1. Gap Up Opening:
In the event of a gap up opening above 47700, sustained closure above this level without breaching last week's low could signal a potential uptrend towards levels around 47851 – 48084. Short trades are discouraged unless prices breach below 47900 post-rejection from 48084. Further upside potential could lead prices towards 48300 – 48360.
2. Flat Opening:
For a flat opening scenario, it's advisable to refrain from trading until prices break either 47300 on the downside or 47700 on the upside. Risk-takers may consider buy trades, but cautious investors may opt to wait for clearer price action.
3. Gap Down Opening:
A gap down opening below 47300, sustained below this level, might trigger short trades targeting levels at 46988 – 46850. Conversely, a swift recovery above 47300 could signal a buy opportunity, potentially leading to a sharp recovery.
Conclusion:
The market's performance within the first trading hour will be crucial, with sustained movement above 47700 indicating a bullish sentiment towards higher levels.
Disclaimer: This analysis is for informational purposes only and should not be considered as investment advice. Traders should conduct their own research and seek professional guidance before making any trading decisions.

NIFTT Support It looks NIFTY has taken technical support and likely to go up word from thi point., Unless there is any political news as elections are going on.

BankNifty (Daily)Banknifty (Daily)
Moving in a channel
5 times took support on trendline
Sharp bounce from trendline
Uptrend & Forming HH & HL
Disclaimer : No Buy Sell recommendation for Educational purpose only

Crucial47400 is very important level. this level can be the bottom for bullish reversal. if this level fails and breakdown market can fall to 46250 next support.

BANK NIFTY S/R for 13/5/24Support and Resistance Levels: In technical analysis, support and resistance levels are significant price levels where buying or selling interest tends to be strong. They are identified based on previous price levels where the price has shown a tendency to reverse or find support.
Support levels are represented by the green line and green shade, indicating areas where buying interest may emerge to prevent further price decline.
Resistance levels are represented by the red line and red shade, indicating areas where selling pressure may arise to prevent further price increases. Traders often consider these levels as potential buying or selling opportunities.
Breakouts: Breakouts occur when the price convincingly moves above a resistance level (red shade) or below a support level (green shade). A bullish breakout above resistance suggests the potential for further price increases, while a bearish breakout below support suggests the potential for further price declines. Traders pay attention to these breakout signals as they may indicate the start of a new trend or significant price movement.
Disclosure: I am not SEBI registered. The information provided here is for learning purposes only and should not be interpreted as financial advice. It is important to consult with a qualified financial advisor before making any investment decisions. Tweets neither advice nor endorsement.

BULLISH REVERSALMarket at the important support level. trendline support and resistance become support. confluence. expecting a bullish reversal

Bank Nifty Ready for 3000pts Move!5 star Setup for Swing.
Trendline Support on Daily TF And Clear RSI Divergence.
Recommended in futures next month expiry with definite SL.

What if this v shape recovery from this support levelIf Banknifty cross and close above 47900 in 30 Min time frame, then BN goes boom. if its brake 47300 again in 30 min time frame again BN go down more 1000 points.

Bank Nifty weekly levels for (06-05-2024 to 11-05-2024)Bank Nifty weekly levels for (06-05-2024 to 11-05-2024)
Key Factors:
1. Bank Nifty has been smoothened in 3hrs and now it has been broken.
2. 49213 will act as a strong resistance and will lead to sell on rise.
3. As per my analysis, we can see 47350 soon.
These ideas are given for learning purposes only.

Banknifty BankNifty Chart Analysis.........10/05/2024
Long: 46990 level.
Sl : 50 point premium
Target : 47400 / 47600 / 47900
====================================
Short : opening one hour 47910
Sl : 47950
Target : 47615 / 47370 / 47205 / 47000
Enjoy !
Note : You have to book some profit at 47615 level and also trail the stop-loss to 47200 / 47000 in the remaining positions.

NIFTYBANK: The Banking Channel!It pays to notice the channel. Else the link is cut!
While the results are good on many accounts, forget the missing estimates, the visibility is clear. This space will remain as split as anyone can look.
While one can bank on HDFC, it is the SBI that will take sheen out of everyone. The Missing Key to the bank, true to its LOGO.
There are many parts, the only hurdle that comes is the broader market out-look, spaces in Finance and the heavy weight that is holding the up move.
Suffice to place 47200-48200 range for the market to muse over. We did this many times, is it different now is the question. Today is weekend and the close is important. How much is the shadow or the wick that market is willing to leave for the next move is the interesting point.
There is not much reward to short around the 47200-47400 area, neither any reward to go long above 48000 as of now.
That sums up for now!


BANKNIFTY Levels and Plan for 10-May-2024:
Following a sharp correction similar to NIFTY, BANKNIFTY may exhibit sideways to muted trading on May 10th. Key levels and scenarios for the day are outlined below:
Scenario 1:
If BANKNIFTY opens above 47800 and holds 47820 within the first hour, an upward move towards 48000 – 48084 is possible, with potential resistance between 48100 – 48900.
Sustaining above 48100 could lead to trading between 48360 – 48478.
Scenario 2:
Opening below 47300 and sustaining below this level may trigger a follow-up drop towards 46988 – 46850, with a possibility of trend reversal within this range.
Important Trading Levels:
For Long Trades: Buying between 47500 – 47362, with a stop loss at 47300 and a target of 47851.
For Short Trades: Selling near 48100-48000, with targets at 47800 - 47600 and a stop loss at 48100.
Conclusion:
The trading plan for BANKNIFTY outlines potential scenarios and levels for trading on May 10th. Traders should remain vigilant, adapting their strategies as per evolving market conditions.
Disclaimer:
Trading involves risks, and the provided plan serves as informational guidance, not financial advice. Traders should conduct thorough research and seek professional advice before making any investment decisions.

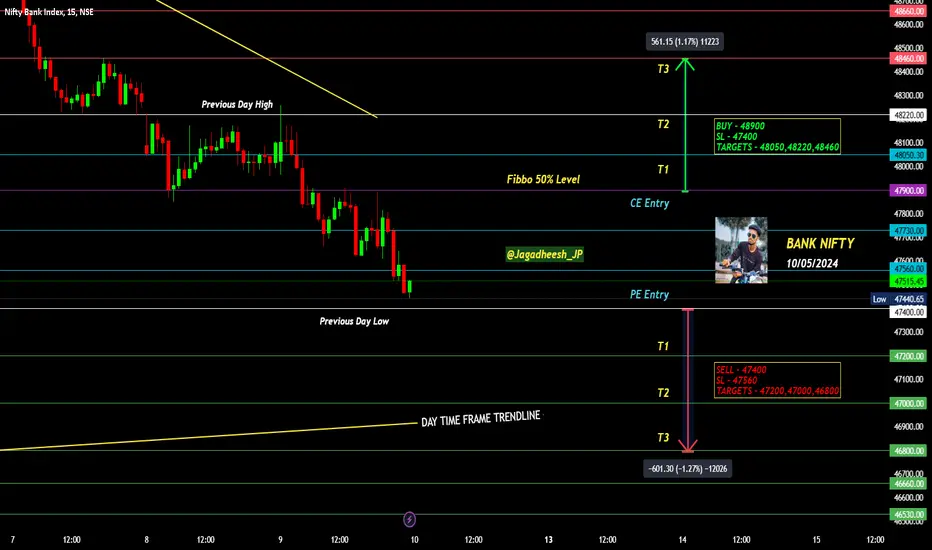
BANK NIFTY INTRADAY LEVELS FOR 10/05/2024BUY ABOVE - 48900
SL - 47400
TARGETS - 48050,48220,48460
SELL BELOW - 47400
SL - 47560
TARGETS - 47200,47000,46800
NO TRADE ZONE - 47400 to 47900
Previous Day High - 48220
Previous Day Low - 47400
Based on price action major support & resistance's are here, the red lines acts as resistances, the green lines acts as supports. If the price breaks the support/resistance, it will move to the next support/resistance line. White lines indicates previous day high & low, high acts as a resistance & low acts as a support for next day.
Trendlines are also significant to price action. If the price is above/below the trendlines, can expect an UP/DOWN with aggressive move.
Please NOTE: this levels are for intraday trading only.
Disclaimer - All information on this page is for educational purposes only,
we are not SEBI Registered, Please consult a SEBI registered financial advisor for your financial matters before investing And taking any decision. We are not responsible for any profit/loss you made.
Request your support and engagement by liking and commenting & follow to provide encouragement
HAPPY TRADING 👍
BANK NIFTY S/R for 10/5/24Support and Resistance Levels: In technical analysis, support and resistance levels are significant price levels where buying or selling interest tends to be strong. They are identified based on previous price levels where the price has shown a tendency to reverse or find support.
Support levels are represented by the green line and green shade, indicating areas where buying interest may emerge to prevent further price decline.
Resistance levels are represented by the red line and red shade, indicating areas where selling pressure may arise to prevent further price increases. Traders often consider these levels as potential buying or selling opportunities.
Breakouts: Breakouts occur when the price convincingly moves above a resistance level (red shade) or below a support level (green shade). A bullish breakout above resistance suggests the potential for further price increases, while a bearish breakout below support suggests the potential for further price declines. Traders pay attention to these breakout signals as they may indicate the start of a new trend or significant price movement.
Disclosure: I am not SEBI registered. The information provided here is for learning purposes only and should not be interpreted as financial advice. It is important to consult with a qualified financial advisor before making any investment decisions. Tweets neither advice nor endorsement.

#Banknifty:10th May#Banknifty:10th May
Step1: if GD...then 47172 is S1...get long. exit at 47638-R1. Swing high R-2= 47927
Step2: If flatish start 47927 to hit fast. Exit c/f longs. Can immediately short there.
Step3: if S-1 not sustained S2 -46906.
