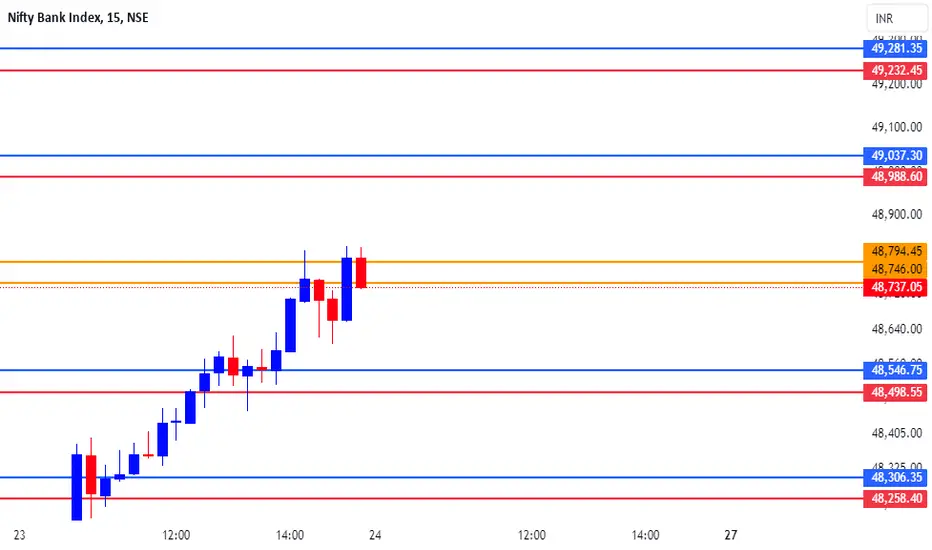
Bank nify Analysis for 29 May chart and data says downtrend to sideway market
vix is 25
strong buying happened
some profit booking is expected
Trade plane
some one might plan to see call options above
49200 to 49500 Level
But as usual nothing is concrete so plan accordingly,
BANKNIFTY trade ideas

49600 Bear cartel Yesterday's sell off was evident from the third hour when the momentum was arrested at once. I did not read it back then. Lost money expecting ATH. It was picture perfect price action. Let us see Bank Nifty will continue the uptrend today OR retrace further down before it continues the rally to ATH.

BANK-NIFTY TRADING LEVELS FOR 28-05-2024Explanation:
This is a very useful trading system. This means that you should not take a trade blindly, but rather that there is another confirmation to take the trade you can use this for perfect entry and perfect exit
This trading opportunity is based on volume, previous price, and price range , are included
Entry/Exit point's:
- It has very easy entry and exit points
- In this pair of lines with two colors are given (RED AND BLUE)
- In this the blue line is used to take long entry and the red line is used to take short entry (But it is all based on a more conformation from your trading plan)
Stop Loss/Take Profit:
Stop Loss
- According to this, if you take a long trade, its stop loss will be the red line just below ( A trade can exit either when the price crosses the red line or the 5 minute candlestick crosses the red line. (This can be done according to your preference) )
- A short entry should use the opposite rules to a long entry
Take Profit
-When you take a long entry according to the profit to be booked is on the next red line above. ( Or if there are other reasons, it can be a safe exit )
- Opposite rules for booking profit on long entry are to book profit on short trade. ( The blue line above is the stop loss of short entry )
Timeframe:
According to this, the time frame you should use while taking trades is 5 minutes time frames . (5 minute time frame works well in this)
Risk Disclaimer:
Trading carries significant risk and is not suitable for all traders. You may lose some or all of your capital in a matter of minutes or hours. Market conditions can change rapidly, and prices can move against you quickly. You may not always be able to exit at a favorable price, and you may be required to hold a position overnight, exposing yourself to additional risk. Day trading involves high risk, high leverage, and high stakes, and you should only trade with funds you can afford to lose. Please carefully consider your financial situation, risk tolerance, and trading objectives before engaging in day trading.
Engagement:
Share your insights, ask questions, and learn from others in the community. Whether you're a seasoned pro or just starting out, we're all in this together.
What's your take on the current market conditions? Which trading strategies are working for you? Let's discuss and help each other grow as traders!
Comment below and let's get the conversation started!
Original Content:
This trading setup is the result of my own innovation and expertise, and is not based on any publicly available information or third-party systems. It is a reflection of my dedication to developing a competitive edge in the markets.

NIFTYBANK: U turn Zone or the V Zone!It is near six months of upward sloping zone that the NIFTYBANK has been roaming around.
For those who read our understanding, clearly this one change trend around the extremes without any warning and hence, this time may not be different.
What is different is the boundary of this extreme is squeeing and hence the inevitable move this space has to carve out.
U turn is the normal one V is it the Victory Zone that can push the boundaries to breach and move higher, or the Voting Day zone depending on the outcome.
The double-sided arrow shows, the Three black Crow formation, this unfolded after the first and second phase of the voting, market expectation was not that euphoric, subsequent to the fourth phase markets broke and moved higher.
Clearly markets may not break either side, but who knows the way the bounce unfolded in two weeks to reach near 50 K.
The graph today is of the Volume Candle and that is more or less negating the large Green Candle followed by the 3 black Crows and the current up move the size of the volume candles are not significant.
Caution any days is the welcome, more so ahead of the big event. Despite this caution, markets have carved higher base and that is the test one has to wait and watch.
48800-49800 is the new range to keep an eye, Selective PSU spaces, looking making one more attempt to the ATH, though not all will achieve that with the same speed.
Support 49150-48970-48810-48700
Supply 49480-49620-49880

Banknifty expected to bearish from Top Trend LineGood Oppurtunity to Short Bankinifty from Top of Trend Line & Buy from bottom of Trend Line to easily capture atleast 100 points & above

BANK NIFTY INTRADAY LEVELS FOR 28 MAY 2024BUY ABOVE - 49480
SL - 49290
TARGETS - 49670,49850,50000
SELL BELOW - 49290
SL - 49480
TARGETS - 49050,48800,48620
NO TRADE ZONE - 49050 to 49670
Previous Day High - 49670
Previous Day Low - 49050
Based on price action major support & resistance's are here, the red lines acts as resistances, the green lines acts as supports. If the price breaks the support/resistance, it will move to the next support/resistance line. White lines indicates previous day high & low, high acts as a resistance & low acts as a support for next day.
Trendlines are also significant to price action. If the price is above/below the trendlines, can expect an UP/DOWN with aggressive move.
Please NOTE: this levels are for intraday trading only.
Disclaimer - All information on this page is for educational purposes only,
we are not SEBI Registered, Please consult a SEBI registered financial advisor for your financial matters before investing And taking any decision. We are not responsible for any profit/loss you made.
Request your support and engagement by liking and commenting & follow to provide encouragement
HAPPY TRADING 👍

BANKNIFTY Trading Plan and Levels for 28-May-2024
After meeting the target of 48333, BANKNIFTY traded up to 49667, sustaining that level for a considerable time. However, profit booking towards the end of the session led to a close below the day's target of 49333, establishing a fresh resistance at 49634. Here's the trading plan for Tuesday:
Gap Up Opening
Scenario: If BANKNIFTY opens above 49450 and sustains.
Expectations: Prices may face rejection near 49552 and drop back for a swing correction.
Downside Targets: 49000 – 48958 and 48824.
Upside Potential: If prices sustain above 49552 and break 49634, expect a sharp move towards 49994 – 50000 – 50150.
Flat Opening
Scenario: If BANKNIFTY opens flat.
Expectations: Initial movement towards 49372 – 49426, facing potential rejection.
Downside Targets: A drop back to 49000 – 48824, from where a recovery can be expected.
Gap Down Opening
Scenario: If BANKNIFTY opens below 49000.
Expectations: Initial recovery to 49336 and 49426.
Risk: If prices fail to find support and trade below 48900, expect further downside to 48826, followed by muted direction.
Conclusion: The anticipated trading pattern involves a possible initial drop for a correction followed by a recovery. Traders should watch for key levels to confirm the trading direction and manage their positions accordingly.
Disclaimer: This analysis is based on technical indicators and past market performance. Market conditions are subject to change, and traders should use this information as part of a broader risk management strategy.

BANKNIFTY Trading Plan for May 27, 2024
Gap Up Opening
If BANKNIFTY opens with a gap above 49000 and sustains this level for the first trading hour, expect an upside move towards 49080, potentially extending to 49333. If unable to sustain, prices may trade sideways between 48760 and 48602. A further drop below 48550 could target 48417, providing a support level for buyers.
Flat Opening
Should BANKNIFTY open flat near 48800, prices may take support and rise towards 49000, 49080, and 49333. If prices fail to hold above 48800, anticipate a drop to 48600, where a long trade could be considered.
Gap Down Opening
In the event of a gap down opening below 48800 and sustained trading below this level for the first hour, prices could fall towards 48602 and 48419. A quick recovery above 48800 may lead to targets of 49000, 49080, and 49333.
Conclusion
Closely observe the initial market movements and adjust your trading strategy based on price action and critical levels.
Disclaimer
This analysis is intended for informational purposes only and should not be construed as financial advice. Trading in financial markets carries inherent risks, and it's advisable to consult with a professional financial advisor before making any trading decisions.

BANK NIFTY S/R for 28/5/24Support and Resistance Levels: In technical analysis, support and resistance levels are significant price levels where buying or selling interest tends to be strong. They are identified based on previous price levels where the price has shown a tendency to reverse or find support.
Support levels are represented by the green line and green shade, indicating areas where buying interest may emerge to prevent further price decline.
Resistance levels are represented by the red line and red shade, indicating areas where selling pressure may arise to prevent further price increases. Traders often consider these levels as potential buying or selling opportunities.
Breakouts: Breakouts occur when the price convincingly moves above a resistance level (red shade) or below a support level (green shade). A bullish breakout above resistance suggests the potential for further price increases, while a bearish breakout below support suggests the potential for further price declines. Traders pay attention to these breakout signals as they may indicate the start of a new trend or significant price movement.
Disclosure: I am not SEBI registered. The information provided here is for learning purposes only and should not be interpreted as financial advice. It is important to consult with a qualified financial advisor before making any investment decisions. Tweets neither advice nor endorsement.

BANK-NIFTY TRADING LEVELS FOR 27-05-2024Explanation:
This is a very useful trading system. This means that you should not take a trade blindly, but rather that there is another confirmation to take the trade you can use this for perfect entry and perfect exit
This trading opportunity is based on volume, previous price, and price range , are included
Entry/Exit point's:
- It has very easy entry and exit points
- In this pair of lines with two colors are given (RED AND BLUE)
- In this the blue line is used to take long entry and the red line is used to take short entry (But it is all based on a more conformation from your trading plan)
Stop Loss/Take Profit:
Stop Loss
- According to this, if you take a long trade, its stop loss will be the red line just below ( A trade can exit either when the price crosses the red line or the 5 minute candlestick crosses the red line. (This can be done according to your preference) )
- A short entry should use the opposite rules to a long entry
Take Profit
-When you take a long entry according to the profit to be booked is on the next red line above. ( Or if there are other reasons, it can be a safe exit )
- Opposite rules for booking profit on long entry are to book profit on short trade. ( The blue line above is the stop loss of short entry )
Timeframe:
According to this, the time frame you should use while taking trades is 5 minutes time frames . (5 minute time frame works well in this)
Risk Disclaimer:
Trading carries significant risk and is not suitable for all traders. You may lose some or all of your capital in a matter of minutes or hours. Market conditions can change rapidly, and prices can move against you quickly. You may not always be able to exit at a favorable price, and you may be required to hold a position overnight, exposing yourself to additional risk. Day trading involves high risk, high leverage, and high stakes, and you should only trade with funds you can afford to lose. Please carefully consider your financial situation, risk tolerance, and trading objectives before engaging in day trading.
Engagement:
Share your insights, ask questions, and learn from others in the community. Whether you're a seasoned pro or just starting out, we're all in this together.
What's your take on the current market conditions? Which trading strategies are working for you? Let's discuss and help each other grow as traders!
Comment below and let's get the conversation started!
Original Content:
This trading setup is the result of my own innovation and expertise, and is not based on any publicly available information or third-party systems. It is a reflection of my dedication to developing a competitive edge in the markets.

Will BANKNIFTY will hit 49000 ?BANKNIFTY broke the weekly resistance after a month and holding above indicates further upmove. holding above 47750 will lead further move upto 48300, 48570, 48730.
Reversal support 47050 - 47350

NIFTYBANK: Dividend StoryThe RBI dividend remains in play, the picture clearly shows the break of Fibo Angles, pictured with the Golden section break out.
The result is the exponential move. This has been broadly noticed in the INDEX too, we printed the new weekly high.
Markets have their own unassuming strength or weakness; it is always called the collective wisdom. That is here to see.
What was the supply zone now becoming the support zone around the 48500, while that is held, the moves will target the 49350 being the 0.786% of the retracement of the recent fall from ATH.
Will that happen before the Exit poll or the after, or will the market print new ATH all are possibilities waiting.
Frustration mounts if we close below 48500 that is the warning signal, nothing to suggest that as of now.
Supports 48850-48650-48550
Supply 49000-49150-49350

BANK NIFTY INTRADAY LEVELS FOR 28 MAY 2024BUY ABOVE - 49010
SL - 48800
TARGETS - 49250,49480,49610
SELL BELOW - 48800
SL - 49010
TARGETS - 48620,48460,48250
NO TRADE ZONE - 48800 to 49010
Previous Day High - 49010
Previous Day Low - 48620
Based on price action major support & resistance's are here, the red lines acts as resistances, the green lines acts as supports. If the price breaks the support/resistance, it will move to the next support/resistance line. White lines indicates previous day high & low, high acts as a resistance & low acts as a support for next day.
Trendlines are also significant to price action. If the price is above/below the trendlines, can expect an UP/DOWN with aggressive move.
Please NOTE: this levels are for intraday trading only.
Disclaimer - All information on this page is for educational purposes only,
we are not SEBI Registered, Please consult a SEBI registered financial advisor for your financial matters before investing And taking any decision. We are not responsible for any profit/loss you made.
Request your support and engagement by liking and commenting & follow to provide encouragement
HAPPY TRADING 👍

BANKNIFTY: Trading Plan for 24-May-2024After the excitement in BANKNIFTY on Thursday, we expect a quieter session on Friday, 24-May-2024. Here’s how to navigate different opening scenarios:
Gap Up Opening
Above 48850: If prices open above this level and sustain for the first hour, they can move up to 49000-49080.
Below 48760: If prices can't sustain above 48850 and drop below 48760, expect sideways trading between 48760-48602.
Below 48550: A drop below this level can push prices towards 48417, which should act as support.
Flat Opening
Near 48700: If prices open flat around this level, expect sideways movement between 48760-48600.
Above 48860: Sustained trading above this level can lead to 49000-49080, and potentially towards 49316.
Below 48600: Sustained trading below this level can cause a retracement to 48417-48400.
Gap Down Opening
Below 48600: If prices open below this level and stay there for the first hour, expect a drop towards 48400 and possibly 48260.
Recovery above 48600: Quick recovery above 48600 might lead to sideways trading between 48600-48760.
Above 48760: Prices could then aim for 49000-49080.
Conclusion: Although a quieter session is anticipated, stay alert for movements based on these key levels.
Disclaimer: Trading involves risk, and past performance is not indicative of future results. Make trading decisions based on your own analysis and risk tolerance.

BANK NIFTY S/R for 27/5/24Support and Resistance Levels: In technical analysis, support and resistance levels are significant price levels where buying or selling interest tends to be strong. They are identified based on previous price levels where the price has shown a tendency to reverse or find support.
Support levels are represented by the green line and green shade, indicating areas where buying interest may emerge to prevent further price decline.
Resistance levels are represented by the red line and red shade, indicating areas where selling pressure may arise to prevent further price increases. Traders often consider these levels as potential buying or selling opportunities.
Breakouts: Breakouts occur when the price convincingly moves above a resistance level (red shade) or below a support level (green shade). A bullish breakout above resistance suggests the potential for further price increases, while a bearish breakout below support suggests the potential for further price declines. Traders pay attention to these breakout signals as they may indicate the start of a new trend or significant price movement.
Disclosure: I am not SEBI registered. The information provided here is for learning purposes only and should not be interpreted as financial advice. It is important to consult with a qualified financial advisor before making any investment decisions. Tweets neither advice nor endorsement.

BANK-NIFTY TRADING LEVELS FOR 24-05-2024Explanation:
This is a very useful trading system. This means that you should not take a trade blindly, but rather that there is another confirmation to take the trade you can use this for perfect entry and perfect exit
This trading opportunity is based on volume, previous price, and price range , are included
Entry/Exit point's:
- It has very easy entry and exit points
- In this pair of lines with two colors are given (RED AND BLUE)
- In this the blue line is used to take long entry and the red line is used to take short entry (But it is all based on a more conformation from your trading plan)
Stop Loss/Take Profit:
Stop Loss
- According to this, if you take a long trade, its stop loss will be the red line just below ( A trade can exit either when the price crosses the red line or the 5 minute candlestick crosses the red line. (This can be done according to your preference) )
- A short entry should use the opposite rules to a long entry
Take Profit
-When you take a long entry according to the profit to be booked is on the next red line above. ( Or if there are other reasons, it can be a safe exit )
- Opposite rules for booking profit on long entry are to book profit on short trade. ( The blue line above is the stop loss of short entry )
Timeframe:
According to this, the time frame you should use while taking trades is 5 minutes time frames . (5 minute time frame works well in this)
Risk Disclaimer:
Trading carries significant risk and is not suitable for all traders. You may lose some or all of your capital in a matter of minutes or hours. Market conditions can change rapidly, and prices can move against you quickly. You may not always be able to exit at a favorable price, and you may be required to hold a position overnight, exposing yourself to additional risk. Day trading involves high risk, high leverage, and high stakes, and you should only trade with funds you can afford to lose. Please carefully consider your financial situation, risk tolerance, and trading objectives before engaging in day trading.
Engagement:
Share your insights, ask questions, and learn from others in the community. Whether you're a seasoned pro or just starting out, we're all in this together.
What's your take on the current market conditions? Which trading strategies are working for you? Let's discuss and help each other grow as traders!
Comment below and let's get the conversation started!
Original Content:
This trading setup is the result of my own innovation and expertise, and is not based on any publicly available information or third-party systems. It is a reflection of my dedication to developing a competitive edge in the markets.
Head and shoulders patternBank Nifty is showing Head and shoulders pattern. Please be ready for big downward move. Put you money in PUT option rather than CALL options. Let's earn money togather.

Banknifty 24th mayHello guys
Long time no update from my end will update from now on please share with you friends to learn more about share market.
Banknifty will have pressure at 49000 level as there is enough call writing to push down the banknifty so wait for the breakout above 49050 level and sell below 48650 which can take till 48550.
Make sure you book your profit first.
Thanks
Ravi

NIFTYBANK: Merry Bouzu!Maribouzu candles are warning to the current trend and tell the next trend that is in motion.
NIFTYBANK produced one such yesterday (leaving very minor wicks).
Similar Maribouzu did appear on 29 April and the markets celeberated, but slowly the decent gave way all the gains.
Will that be the case this time also?
1. The rise is from the lowest point of trend-line
2. Last time when it rallied from that trend line the price action moved from 46579 to the near 50 K, that sense we have room to move past the 50 K.
3. What the other side, US interest rates spike, US dollar ascends, Asian Markets weak, so the up move can be challenged.
4. The supply becomes support and vice versa. We get to the new range 47300-48300.
5. NIFTYBANK true to its nature, takes U turn from the extremes and we are not in the extremes we are at the middle.
6. Some profit taking is in order, but any close today below 48500 frustrates the up move.
Support 48550-48350
Supply 48830-48930-49150

sell at zone ~ intradayexpecting small fall from the zone . look for confirmation inside zone in smaller tf.
- good for intraday trade
- entry inside zone
- sl is day close above zone
- for target draw fib retracement from C to latest swing high , use 0.236 fib as tgt 1 (safe place for intraday), 0.382 as tgt 2 (risk takers).
- don't trade , if u didn't get selling confirmation inside zone
- if day close is above this zone , this pattern becomes invalid.

BANKNIFTY Trading Plan for 23-May-2024
Context:
On the 22nd of May, 2024, BANKNIFTY experienced volatile price movements. Despite recovering from the day’s low, prices closed below the resistance zone of 48080-48180. Here’s the plan for the 23rd of May:
Trading Strategy:
Gap Up Opening (Above 48000):
If BANKNIFTY opens above 48000, buyers should consider buying if prices sustain above 48100.
Targets for the upside are 48285 and 48477.
If prices trade below 47852 after the gap-up opening, consider a short entry targeting 47620.
Flat Opening:
On a flat opening, buy if prices take support at 47852 with a SL below 47800.
The initial upside target is 48080.
If prices sustain above 48100, aim for 48285-48300.
If prices fail to support at 47852 and trade below 47800, consider a short trade targeting 47620-47600.
If prices slip below 47580, expect a further drop to 47300-47254.
Gap Down Opening (Below 47700):
Look for a buying opportunity near 47620 with a SL of 47580 and a target of 48080.
If prices trade below 47580, consider a short trade with a SL above 47650, targeting 47300-47254.
Conclusion:
Adapt your trading approach based on the market opening and early movements. Always ensure stop losses and targets are well-defined to manage risk effectively.
Disclaimer:
This trading plan is based on technical analysis and current market conditions. Market conditions can change quickly, and it is crucial to conduct your own analysis or consult a financial advisor before making trading decisions.

BANK NIFTY S/R for 24/5/24Support and Resistance Levels: In technical analysis, support and resistance levels are significant price levels where buying or selling interest tends to be strong. They are identified based on previous price levels where the price has shown a tendency to reverse or find support.
Support levels are represented by the green line and green shade, indicating areas where buying interest may emerge to prevent further price decline.
Resistance levels are represented by the red line and red shade, indicating areas where selling pressure may arise to prevent further price increases. Traders often consider these levels as potential buying or selling opportunities.
Breakouts: Breakouts occur when the price convincingly moves above a resistance level (red shade) or below a support level (green shade). A bullish breakout above resistance suggests the potential for further price increases, while a bearish breakout below support suggests the potential for further price declines. Traders pay attention to these breakout signals as they may indicate the start of a new trend or significant price movement.
Disclosure: I am not SEBI registered. The information provided here is for learning purposes only and should not be interpreted as financial advice. It is important to consult with a qualified financial advisor before making any investment decisions. Tweets neither advice nor endorsement.

Next stop 50000 in Bank NiftyWhen cross and close above 49000, then Bank Nifty fly 50000 in next 3-4 days. Its going to be a new High.
