BNF - Intraday Levels 21st FebHotch Potch Scenario Today! War between two! Unwanted sacrifices today!
BANKNIFTY trade ideas

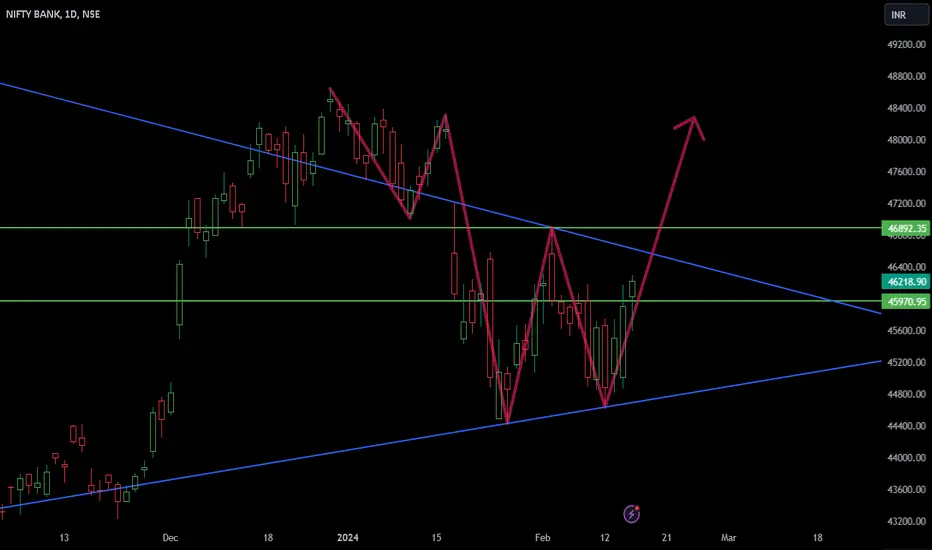
BANKNIFTY MOVE UP Banknifty - Uptrend
Weekly correction completed
Wait for Day Candle close above black line .
Entry - 46600
Target - 48290
Sl - 44400

[INTRADAY] #BANKNIFTY PE & CE Levels(21/02/2024) Today will be gap up opening in BANKNIFTY. After opening if banknifty sustain above 47050 level then possible upside rally of 400-500 points upto 474550 level & this rally can extend another 400 points if market gives breakout 47550 level in todays session .Any Major downside only expected in case banknifty starts trading below 46950 level.

#Banknifty:21st Feb#banknifty :21st Feb
Step1: 46932-46804 support zone. buy zone.
Step2: 47272 R-1.

BANKNIFTY ANALYSIS FOR 21FEB Banknifty comes at higher level & one trendline comes from it's upper levels act as resistance.
Banknifty showing resistance at 47500-47400 range & also follow the trendline for take support but its might be breaks downside & take support from 46900 to 46950.
Let's see what happens in tomorrow.
My view takes small Targets for tomorrow & trailing stoploss.
ALL the best guys...

BANKNIFTY Trading Levels and Plan for 21-Feb-2024 🏦📊
Gap Up Opening Above 47,200:
Buy Trade: Enter with SL of 47,150 for targets of 46,425 – 47,506.
Short Trade: If prices trade below 47,150 and face rejection at 47,180, SL at 47,200 and target 46,953. Below 46,953, prices may drop to 46,710.
Flat Opening:
Look for long trade above 47,200 for targets of 47,425 – 47,506. If prices decline, consider Long Trade near 46,953 with SL of 46,885 for targets of 47,200 – 47,300.
Gap Down Opening:
If prices open below 47,000, consider buying with SL of 46,900 for targets of 47,200 - 47,425 – 47,500. If 46,900 doesn’t hold, prices may drop to 46,710 before recovery. 📉📈

Bank Nifty Analysis as of February 20, 2024Bank Nifty Analysis as of February 20, 2024
Current Status:
The Bank Nifty is currently trading at 46,680, up 0.1% from the opening price.
The intraday high was 46,845, and the low was 46,450.
Technical Analysis:
Overall Trend: The Bank Nifty is in a short-term consolidation phase after making significant gains recently.
Doji Candle: A doji candle formed on the daily chart yesterday, indicating indecision among investors.
Moving Averages: All major moving averages are bullish, but some are starting to flatten, suggesting a potential slowdown in the uptrend.
Technical Indicators: Similar to Nifty 50, some indicators show overbought conditions, while others remain neutral.
Support and Resistance: Support levels are at 46,000 and 45,500. The next resistance is at 47,000.
Fundamental Analysis:
Indian banking sector: The Indian banking sector is expected to grow in FY24, supported by credit growth and economic recovery.
Interest rates: RBI's future rate decisions will significantly impact the banking sector.
Liquidity: Overall market liquidity and global cues will also play a role.
Overall:
The Bank Nifty is in a wait-and-see phase after its recent rally. Technical indicators suggest potential for a pullback, but the overall trend remains positive. Investors should monitor key support and resistance levels, global cues, and upcoming RBI announcements for further direction.
Disclaimer: I am not a financial advisor and this is not financial advice. Please consult with a qualified financial advisor before making any investment decisions.

BankNIFTY- Intraday Levels - 21st Feb 2024 If Banknifty sustain above 47136 then 47237 then 47269 to 47306 strong level then 47420 then 47487 to 47524 (Strong level) above this we can expect more bullish movement
if Banknifty sustain Below 47052 then 46872 to 46836 then 46769 (Strong level) then 46660 to 46619 below this bearish movement then 46456 to 46384 below this we can expect more bearish movement.
Consider some buffer points in above levels.
Please do your due diligence before trading or investment.
**Disclaimer -
I am not a SEBI registered analyst or advisor. I does not represent or endorse the accuracy or reliability of any information, conversation, or content. Stock trading is inherently risky and the users agree to assume complete and full responsibility for the outcomes of all trading decisions that they make, including but not limited to loss of capital. None of these communications should be construed as an offer to buy or sell securities, nor advice to do so. The users understands and acknowledges that there is a very high risk involved in trading securities. By using this information, the user agrees that use of this information is entirely at their own risk.
Thank you.

BANKNIFTY Analysis??Double Bottom is Observed...A Strong reversal is observed from support levels @44400 levels.
A lot of liquidity is lies above the 47200 levels.
A Continuous move is identified in Banknifty index, after the liquidity grab on topside above 47200 levels,
we have a chance of fall back.
on top side we have a trendline as well.
keep safe in this area of resistance zone...

Bank Nifty on Daily TFIf Bank Nifty sustain above 47100 and make range at this place, we can definitely see 48000 up side level in next few sessions.

BANK NIFTY S/R for 21/2/24Support and Resistance Levels:
Based on the price action, you have to identify two significant levels: the red line acting as resistance and the green line acting as support. Additionally, there have marked red and green shades to represent resistance and support zones, respectively.
Support: The green line and green shade represent support levels. These levels are where the price tends to find buying interest, preventing it from falling further. Traders can consider these levels as potential buying opportunities.
Resistance: The red line and red shade represent resistance levels. These levels are where the price tends to encounter selling pressure, preventing it from rising further. Traders can consider these levels as potential selling opportunities.
Breakouts: If the price breaks above the resistance zone (red shade) convincingly, it may indicate a bullish breakout, and the price could move higher to the next resistance level. On the other hand, if the price breaks below the support zone (green shade) convincingly, it may indicate a bearish breakout, and the price could move lower to the next support level.
Keltner Channel:
The Keltner Channel is a technical indicator that uses an exponential moving average (EMA) to create an upper and lower channel around the price action. Traders can use this channel to identify potential long and short positions.
Long Position: If the price is above the upper line of the Keltner Channel, it may indicate a potential long opportunity, as it suggests the price is trading above the average range and might continue in an upward trend.
Short Position: If the price is below the lower line of the Keltner Channel, it may indicate a potential short opportunity, as it suggests the price is trading below the average range and might continue in a downward trend.
Disclosure: I am not SEBI registered. I just wanted to let you know that the information provided here is for learning purposes only. Please consult your financial advisor before making any decisions. Tweets neither advice nor endorsement.

BANKNIFTY ANALYSIS BANKNIFTY Analysis for the Upcoming Session:
1. Previous Day High and Open Interest (OI) Resistance:
- Previous Day High (PDH): 47,135
- OI Resistance Zone: 47,135 to 47,250
- Analysis: The previous day high at 47,135 represents a crucial level. If the price surpasses this point, it may encounter resistance in the OI resistance zone from 47,135 to 47,250. Traders should closely monitor price action in this area for potential breakout opportunities.
2. Previous Day Low and OI Support:
- Previous Day Low (PDL): 46,777
- OI Support Zone: 46,777 to 46,870
- Analysis: The previous day low at 46,777 serves as a key reference point. If the price approaches this level, it may find support within the OI support zone ranging from 46,777 to 46,870. Traders should observe how the market reacts around this area, as a bounce or breakdown could indicate potential future movements.
Overall Analysis:
- The market has established a range between the previous day high and low.
- Traders should pay attention to the OI resistance zone above the previous day high and the OI support zone below the previous day low.
- A breakout above the OI resistance zone could signal bullish momentum, while a breakdown below the OI support zone may indicate a bearish trend.
Key Takeaways for Traders:
- Bullish Scenario: A decisive move above the previous day high and the OI resistance zone could provide opportunities for bullish trades.
- Bearish Scenario: If the price drops below the previous day low and the OI support zone, it may present opportunities for bearish trades.
- Caution: Traders should exercise caution within the established range and wait for clear signals before initiating significant positions.
Remember, this analysis is based on historical price levels and open interest data, and actual market conditions may vary. It's essential to use additional technical indicators, real-time data, and risk management strategies for a comprehensive trading approach. Always stay informed about external factors and market news that could influence the Bank Nifty's movements.

20 Feb Tuesday Banknifty level intraday (15min)Red selling zone and green buying zone level learning and education purpose only
Like share comment and follow
Note:-
DISCLAIMER
"Stock market investment/trading is subject to market risk do not trade or investment without proper knowledge or without help of your financial advisor.
Any information shared on this platform is purely for educational and information purpose. We are not responsible for your gain or losses."

BNF - Near important Resistance Levels, 3rd Time!In daily timeframe, an important resistance trend line coming with full/final confirmation for further bullishness in the index. BNF will be approaching the line for the 3rd time, it also makes it crucial for decision.
if tomorrow? = level is around 46600 (+/-)
Key resistances:
1. Descending trend line on daily timeframe. (46600)
2. Horizontal Line at W's neck. (46900)
if broken (both) - Big Gap will be filled soon.
Let's wait, watch and observe till monthly expiry!
Note: My Personal Opinion(MPO) = Long
BNF - Psychic CandlesticksTomorrow 19th Feb 2024 - Highlighted trading territory for buyers is that "Buy Zone". Understand the tug war between candles (ohlc) and the trend line with playful mind.
Observe! Observe! Observe!

View on BankNifty for the month of February 2024Watch carefull on today's session, because it is necessary for today's candle to close above or near 46886 for next upmove.
Call Writer Zone with heavy volumes are:-
47230 & 48045 & 48576
these levels acts as a major hurdels for banknifty for the month of february 2024
on sideways hdfc banks facing call writer hurdles on 1448.15 to 1463
& on Finnifty major resistance zones are 20825 & 20935 & 21175
Disclaimer: Educational View only, do your own analysis too for your trading strategies....

BANKNIFTY Breakup from 46840 and moving 46980+BANKNIFTY broke the intraday resistance and moved 180+ points.
from breakup point 46840.
47000 CE moved 150 to 280

BankNIfty stuck in rangewhat would be the direction? it's gonna be interesting as it looks like can be big movement. it is on 15 min candle.

Bank Nifty to move into the 50K zone in new impulse up!Bank nifty has recently gone through a steep cut, shedding 4000 points in a matter of one month.
Looking at the the bigger picture however, tells us it could be a great time to enter into your favorite banking names(or even the index itself!)
The 4000 point decline was a wave ii retracement of the impulse that the index witnessed between Oct-Dec 2023. The corrective wave can be labelled as a zig-zag(ABC) and has retraced 61.8% of the impulsive rise.
Now what should unfold will be the wave iii of III. This particular leg can be projected moving towards the 50K mark soon.
On the downside 44540 can be considered as an important support for the index.

BANKNIFTY--Inverse Head & Shoulders??Banknifty Index created a inverse Head and Shoulders pattern...
price broken the neckline strongly...and retested.
on topside clearly resistance is at 46200 and 46500-46550 levels...
keep in long side until price is above the neckline...
no short side until price breaks the below ...after breaks below the neckline will think of short side for liquidity grab below support levels.
If price gives an elimination move below 45500 levels...
look for long side...up to the resistance levels.

[INTRADAY] #BANKNIFTY PE & CE Levels(20/02/2024) Today will be gap down opening in BANKNIFTY. After opening if banknifty start trading below 46450 level then possible downside rally of 400-500 points upto 46050 Level & this rally can extend another 400 points if market gives breakdown 45950 level in todays session.Any Major upside only expected in case banknifty starts trading above 46550 level.

Banknifty intraday zone trading Bank Nifty is currently at a supply zone and has shown a strong reversal. Additionally, it has broken the Gann Fibonacci zone. From here, the price may attempt to reach the next zone.

BANKNIFTY – Levels and Plan for 20-Feb-2024
**BANKNIFTY – Levels and Plan for 20-Feb-2024**
- Gap Up opening above 46700
- If prices sustain above 46700, Buying Trade should consider for the target of 46950 with SL of 46550
- On sustaining above 46970, prices can see the level of 47172 – 47200
- Flat Opening
- Look for short trade if prices open flat and face resistance at 46550 – 46600
- Keep SL at 46700 and Target at 46345 – 46150 and 46000
- Buying Trade on sustaining above 46700 with SL of 46560 and target 46953 – 47000
- Gap Down Opening below 46400
- If prices face resistance at 46550 after opening, Short Trade with SL of 46560 for the target of 46300 – 46200 and 46000
- Look for Buying opportunity near 46000 with SL of 45880 for the Target of 46300 – 46550
- Below 45880, prices can see a drop to the level of 45568, and this level can be a buying opportunity
