BANK NIFTY 2HRCAN ANYONE EXPLAIN WHAT IS HAPPENNING HERE..??
I Am Not SEBI Registered Analyst. All Post and Levels Posting is only for educational and knowledge purpose. I Am not responsible for your any kind of loss or profit.
No Claim, All Rights Reserved.‼️
BANKNIFTY trade ideas

Bank Nifty Weekly levels (03-06-2024 to 07-06-2024)Bank Nifty Weekly levels (03-06-2024 to 07-06-2024)
Note:
1. If Bank Nifty breaks 48690 level towards down on 03-06-2024 (Monday) then it may reach 45,680.
2. If Bank Nifty breaks 49864 level towards up 03-06-2024 (Monday) then it may reach 52,131.
It is given for educational purposes only.

Bank Nifty important levels and trade plan for Monday, 3rd JuneBank Nifty important levels and trade plan for Monday, 3rd June
Resistance levels 49182, 49453, 49703
Support level 48967, 48721, 48486, 48315
Current trend- In daily time frame Continuation of an uptrend

#Banknifty:3rd June#Banknifty: 3rd June
Step1: Pivotal support - S1 48842.
Step2: Firm support S2-48636.
Step3: R-1 49295
Step4: Day close could be around 48800.
Market will remain tentative.

Banknifty in buy zone49400 above green candle close means and
then if break that green candle high
.banknifty target is 50790

31 May Friday Banknifty leval intraday (15min)Red selling zone and green buying zone level learning and education purpose only
Like share comment and follow
Note:-
DISCLAIMER
"Stock market investment/trading is subject to market risk do not trade or investment without proper knowledge or without help of your financial advisor.
Any information shared on this platform is purely for educational and information purpose. We are not responsible for your gain or losses."

BNF 15 min - Next expiryMarket being volatile giving unexpected behaviour in short time frame than the long one. After analysing the price behaviour in long time frame, this picture comes out in my mind, predicting next week price movements. Only observation and no active participation!

BANK-NIFTY TRADING LEVELS FOR 31-05-2024Explanation:
This is a very useful trading system. This means that you should not take a trade blindly, but rather that there is another confirmation to take the trade you can use this for perfect entry and perfect exit
This trading opportunity is based on volume, previous price, and price range , are included
Entry/Exit point's:
- It has very easy entry and exit points
- In this pair of lines with two colors are given (RED AND BLUE)
- In this the blue line is used to take long entry and the red line is used to take short entry (But it is all based on a more conformation from your trading plan)
Stop Loss/Take Profit:
Stop Loss
- According to this, if you take a long trade, its stop loss will be the red line just below ( A trade can exit either when the price crosses the red line or the 5 minute candlestick crosses the red line. (This can be done according to your preference) )
- A short entry should use the opposite rules to a long entry
Take Profit
-When you take a long entry according to the profit to be booked is on the next red line above. ( Or if there are other reasons, it can be a safe exit )
- Opposite rules for booking profit on long entry are to book profit on short trade. ( The blue line above is the stop loss of short entry )
Timeframe:
According to this, the time frame you should use while taking trades is 5 minutes time frames . (5 minute time frame works well in this)
Risk Disclaimer:
Trading carries significant risk and is not suitable for all traders. You may lose some or all of your capital in a matter of minutes or hours. Market conditions can change rapidly, and prices can move against you quickly. You may not always be able to exit at a favorable price, and you may be required to hold a position overnight, exposing yourself to additional risk. Day trading involves high risk, high leverage, and high stakes, and you should only trade with funds you can afford to lose. Please carefully consider your financial situation, risk tolerance, and trading objectives before engaging in day trading.
Engagement:
Share your insights, ask questions, and learn from others in the community. Whether you're a seasoned pro or just starting out, we're all in this together.
What's your take on the current market conditions? Which trading strategies are working for you? Let's discuss and help each other grow as traders!
Comment below and let's get the conversation started!
Original Content:
This trading setup is the result of my own innovation and expertise, and is not based on any publicly available information or third-party systems. It is a reflection of my dedication to developing a competitive edge in the markets.

NIFTYBANK: Bulls Last Resort!Central Banks act as lender of last resort, for the markets Bank Nifty acted as last resort.
The one and the only sector that kept the colour green and carried it all along. One Index standing against all odds.
1. For the bulls ability to stay above 48350-450, the water line continues to hold hope. A close above 49200 will add more freshness to the rally.
2. For the bears the broader market negative strokes, expectation it is only a matter of time this too will fall remains.
The relative graph of this is in favour of the NIFTYBANK, till the gap between these two indices where the fall in NIFTYBANK is more than 2% in relative terms. That is a lot.
For the bears, bearish engulfing pattern, yesterdays upper wicks hold hope, but they need close below 48300.
For the bulls relative strength and the ability to hold on a day like yesterday offers hope.
48300-49300 is the larger range, break of either next direction.
Intra-day Supports 48530-48430-48330
Supply 48780-48900-49100
US Core PCE come tad below, but markets in equity continue drift lower. Pending Home Sales fall larger, Yields soften a little bit. Dollar gives some gains. Keep a watch on our USDINR to get some insights.

BANK NIFTY INTRADAY LEVELS FOR 31 MAY 2024BUY ABOVE - 48860
SL - 48680
TARGETS - 49050,49290,49480
SELL BELOW - 48550
SL - 48680
TARGETS - 48340,48200,48000
N O TRADE ZONE - 48550 to 48860
Previous Day High - 49050
Previous Day Low - 48340
Based on price action major support & resistance's are here, the red lines acts as resistances, the green lines acts as supports. If the price breaks the support/resistance, it will move to the next support/resistance line. White lines indicates previous day high & low, high acts as a resistance & low acts as a support for next day.
Trendlines are also significant to price action. If the price is above/below the trendlines, can expect an UP/DOWN with aggressive move.
Please NOTE: this levels are for intraday trading only.
Disclaimer - All information on this page is for educational purposes only,
we are not SEBI Registered, Please consult a SEBI registered financial advisor for your financial matters before investing And taking any decision. We are not responsible for any profit/loss you made.
Request your support and engagement by liking and commenting & follow to provide encouragement
HAPPY TRADING 👍

BANK NIFTY S/R for 31/5/24Support and Resistance Levels: In technical analysis, support and resistance levels are significant price levels where buying or selling interest tends to be strong. They are identified based on previous price levels where the price has shown a tendency to reverse or find support.
Support levels are represented by the green line and green shade, indicating areas where buying interest may emerge to prevent further price decline.
Resistance levels are represented by the red line and red shade, indicating areas where selling pressure may arise to prevent further price increases. Traders often consider these levels as potential buying or selling opportunities.
Breakouts: Breakouts occur when the price convincingly moves above a resistance level (red shade) or below a support level (green shade). A bullish breakout above resistance suggests the potential for further price increases, while a bearish breakout below support suggests the potential for further price declines. Traders pay attention to these breakout signals as they may indicate the start of a new trend or significant price movement.
Disclosure: I am not SEBI registered. The information provided here is for learning purposes only and should not be interpreted as financial advice. It is important to consult with a qualified financial advisor before making any investment decisions. Tweets neither advice nor endorsement.

@50% retracementBan Nifty is already at it's 50% retracement level and could consolidate and move back up from here. Again as I explained in the Nifty analysis, with a big event looming at the horizon, cautious money might choose to stay out of the market and we will have to see how this affects the indices.

@50% retracementBan Nifty is already at it's 50% retracement level and could consolidate and move back up from here. Again as I explained in the Nifty analysis, with a big event looming at the horizon, cautious money might choose to stay out of the market and we will have to see how this affects the indices.

BANK NIFTY S/R for 30/5/24Support and Resistance Levels: In technical analysis, support and resistance levels are significant price levels where buying or selling interest tends to be strong. They are identified based on previous price levels where the price has shown a tendency to reverse or find support.
Support levels are represented by the green line and green shade, indicating areas where buying interest may emerge to prevent further price decline.
Resistance levels are represented by the red line and red shade, indicating areas where selling pressure may arise to prevent further price increases. Traders often consider these levels as potential buying or selling opportunities.
Breakouts: Breakouts occur when the price convincingly moves above a resistance level (red shade) or below a support level (green shade). A bullish breakout above resistance suggests the potential for further price increases, while a bearish breakout below support suggests the potential for further price declines. Traders pay attention to these breakout signals as they may indicate the start of a new trend or significant price movement.
Disclosure: I am not SEBI registered. The information provided here is for learning purposes only and should not be interpreted as financial advice. It is important to consult with a qualified financial advisor before making any investment decisions. Tweets neither advice nor endorsement.

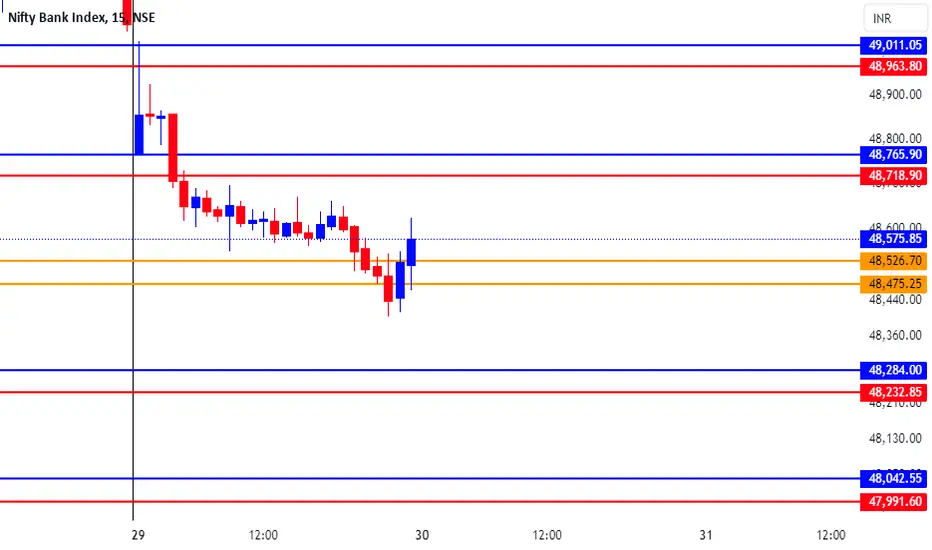
BANK-NIFTY TRADING LEVELS FOR 30-05-2024Explanation:
This is a very useful trading system. This means that you should not take a trade blindly, but rather that there is another confirmation to take the trade you can use this for perfect entry and perfect exit
This trading opportunity is based on volume, previous price, and price range , are included
Entry/Exit point's:
- It has very easy entry and exit points
- In this pair of lines with two colors are given (RED AND BLUE)
- In this the blue line is used to take long entry and the red line is used to take short entry (But it is all based on a more conformation from your trading plan)
Stop Loss/Take Profit:
Stop Loss
- According to this, if you take a long trade, its stop loss will be the red line just below ( A trade can exit either when the price crosses the red line or the 5 minute candlestick crosses the red line. (This can be done according to your preference) )
- A short entry should use the opposite rules to a long entry
Take Profit
-When you take a long entry according to the profit to be booked is on the next red line above. ( Or if there are other reasons, it can be a safe exit )
- Opposite rules for booking profit on long entry are to book profit on short trade. ( The blue line above is the stop loss of short entry )
Timeframe:
According to this, the time frame you should use while taking trades is 5 minutes time frames . (5 minute time frame works well in this)
Risk Disclaimer:
Trading carries significant risk and is not suitable for all traders. You may lose some or all of your capital in a matter of minutes or hours. Market conditions can change rapidly, and prices can move against you quickly. You may not always be able to exit at a favorable price, and you may be required to hold a position overnight, exposing yourself to additional risk. Day trading involves high risk, high leverage, and high stakes, and you should only trade with funds you can afford to lose. Please carefully consider your financial situation, risk tolerance, and trading objectives before engaging in day trading.
Engagement:
Share your insights, ask questions, and learn from others in the community. Whether you're a seasoned pro or just starting out, we're all in this together.
What's your take on the current market conditions? Which trading strategies are working for you? Let's discuss and help each other grow as traders!
Comment below and let's get the conversation started!
Original Content:
This trading setup is the result of my own innovation and expertise, and is not based on any publicly available information or third-party systems. It is a reflection of my dedication to developing a competitive edge in the markets.
NIFTYBANK: Above Water, below Dar Clouds!The best does the move in leading the worst, that tells the story or sums up the story. While optically, we are near where we should not have been in the first place.
The rise past 49200. a classical trap to the bulls than to the bears the trap of 48350 break. Thus, the bulls will be hoping to hold that base, previously the top.
With Global Cues, weak, fast faded RBI Dividend story, we all know, come past the elections, prices will move higher, US dollar higher, US yields unfortunately higher than one could have wished for.
A close today below 48200 warns deeper move down, (hopefully month end expiry can hold), despite the expiry yesterday, this one fell near the lows.
Europe inflation flat, our Money Supply numbers not much of iteration, US Richmond Manufacturing rise, the chorus of no rate cut gets louder, and the whispers of rate hike mount!
US GDP later in the day, and we have our own EXIT Polls in the week-end and bigger event ahead.
Mangeble size is always less stressed aspect, and this time is no different. Choose what fits your style.
Supports 48450-48350-48250
Supply 48780-48980-49150

BANK NIFTY INTRADAY LEVELS FOR 30 MAY 2024BUY ABOVE - 48660
SL - 48540
TARGETS - 48860,49050,49290
SELL BELOW - 48400
SL - 48660
TARGETS - 48250,48110,47990
NO TRADE ZONE - 48400 to 48660
Previous Day High - 49050
Previous Day Low - 48400
Based on price action major support & resistance's are here, the red lines acts as resistances, the green lines acts as supports. If the price breaks the support/resistance, it will move to the next support/resistance line. White lines indicates previous day high & low, high acts as a resistance & low acts as a support for next day.
Trendlines are also significant to price action. If the price is above/below the trendlines, can expect an UP/DOWN with aggressive move.
Please NOTE: this levels are for intraday trading only.
Disclaimer - All information on this page is for educational purposes only,
we are not SEBI Registered, Please consult a SEBI registered financial advisor for your financial matters before investing And taking any decision. We are not responsible for any profit/loss you made.
Request your support and engagement by liking and commenting & follow to provide encouragement
HAPPY TRADING 👍

BANKNIFTY: Trading Plan for 30-May-2024
Gap Up Opening:
If BANKNIFTY opens above 48,600 and sustains this level for the first trading hour, traders should consider buying with a stop-loss at 48,500, targeting 48,975-49,043. If prices do not sustain the opening level and break the last session's low, expect a drop to 48,272-48,216.
Flat Opening:
For a flat opening, if prices face resistance at 48,562 and trade lower, targets would be 48,300-48,272-48,216. Conversely, if BANKNIFTY trades above 48,600 and finds support at 48,550, closing any hourly candle above 48,600 without breaking the previous low, it can target 48,757-48,975-49,053.
Gap Down Opening:
In the event of a gap down opening below 48,450, prices may initially drop to 48,272-48,216 and find support, potentially leading to a bounce back. If support fails and prices drop further, buyers may participate at 48,077-47,914. On the other hand, if prices quickly regain 48,550 and sustain, expect a bounce back towards 48,757 and potential sideways trading, with further targets at 48,975-49,053 above 48,770.
Conclusion:
Key levels (48,600, 48,562, 48,450) should be monitored closely with adherence to price action signals. Applying stop-loss strategies will help manage risk effectively.
Disclaimer:
This plan is for educational purposes and should not be considered financial advice. Market conditions can be highly volatile, and traders are encouraged to perform their own analysis and consult with a professional financial advisor before executing any trades.

#Banknifty:30th May#Banknifty: 30th May
Step1: if G/D take long between 48141-48318 S1.Exit -48642-R1
Step2: On Flat open if hourly close sustains 48642 till 2PM get long...else no trade.
Step3:if index close between 48021-48116, carry confirmed long...5th June series

BNF expect Reversal from here... So next TGT 49300...So focus on 3&4 June Huge volatility in market now BJP will Win then market will be continue 3 day's going up.

BankNifty _ Bearish HarmonicBearish Bat harmonic pattern is visible on the short-term chart. The break above 50,000 will negate the pattern while 48888-48500 can be on cards in the expiry week.

BNF - 1 hr Bullish Chart View!Good rebound indication given by the market today.
Entered into the stream!

BANK-NIFTY TRADING LEVELS FOR 29-05-2024Explanation:
This is a very useful trading system. This means that you should not take a trade blindly, but rather that there is another confirmation to take the trade you can use this for perfect entry and perfect exit
This trading opportunity is based on volume, previous price, and price range , are included
Entry/Exit point's:
- It has very easy entry and exit points
- In this pair of lines with two colors are given (RED AND BLUE)
- In this the blue line is used to take long entry and the red line is used to take short entry (But it is all based on a more conformation from your trading plan)
Stop Loss/Take Profit:
Stop Loss
- According to this, if you take a long trade, its stop loss will be the red line just below ( A trade can exit either when the price crosses the red line or the 5 minute candlestick crosses the red line. (This can be done according to your preference) )
- A short entry should use the opposite rules to a long entry
Take Profit
-When you take a long entry according to the profit to be booked is on the next red line above. ( Or if there are other reasons, it can be a safe exit )
- Opposite rules for booking profit on long entry are to book profit on short trade. ( The blue line above is the stop loss of short entry )
Timeframe:
According to this, the time frame you should use while taking trades is 5 minutes time frames . (5 minute time frame works well in this)
Risk Disclaimer:
Trading carries significant risk and is not suitable for all traders. You may lose some or all of your capital in a matter of minutes or hours. Market conditions can change rapidly, and prices can move against you quickly. You may not always be able to exit at a favorable price, and you may be required to hold a position overnight, exposing yourself to additional risk. Day trading involves high risk, high leverage, and high stakes, and you should only trade with funds you can afford to lose. Please carefully consider your financial situation, risk tolerance, and trading objectives before engaging in day trading.
Engagement:
Share your insights, ask questions, and learn from others in the community. Whether you're a seasoned pro or just starting out, we're all in this together.
What's your take on the current market conditions? Which trading strategies are working for you? Let's discuss and help each other grow as traders!
Comment below and let's get the conversation started!
Original Content:
This trading setup is the result of my own innovation and expertise, and is not based on any publicly available information or third-party systems. It is a reflection of my dedication to developing a competitive edge in the markets.
