Compare with Realty Income Corporation
Key facts today
Sen. Gary Peters bought Realty Income Corp (O) shares on July 23, 2026, an on‑record stake worth $1,000–$15,000; his third documented O purchase after March 2023 and July 2021. 1
1.37 USD
1.06 B USD
5.76 B USD
944.44 M
Last report date
Aug 5, 2026
Report period
Q2 2026
EPS
0.37 USD
Revenue
1.43 B USD
Earnings call summary
Q2 results showed strong AFFO growth, robust investment activity, and increased guidance for both AFFO per share and acquisitions. Portfolio quality improved with higher investment-grade exposure and high occupancy, while capital initiatives diversified funding and reduced reliance on public equity.
Details
Sector
Industry
CEO
Sumit Roy
Website
Headquarters
San Diego
Founded
1969
IPO date
Oct 18, 1994
ISIN
US7561091049
CUSIP
756109104
FIGI
BBG000DHPN63
Identifiers
ISIN US7561091049
Realty Income Corp. is a real estate company, which engages in generating dependable monthly cash dividends from a consistent and predictable level of cash flow from operations. The company was founded by William E. Clark, Jr. and Evelyn Joan Clark in 1969 and is headquartered in San Diego, CA.
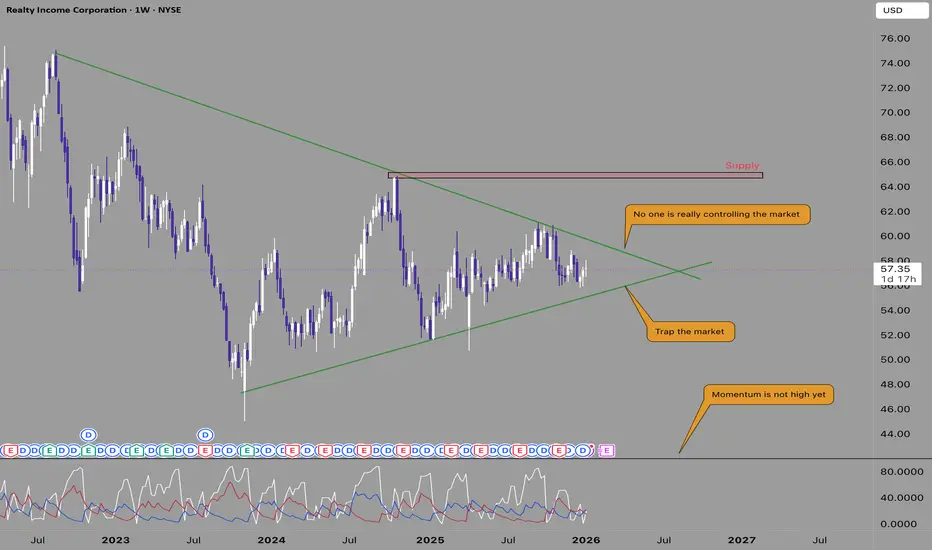
Bearish diamond pattern on realty income!There is a clear diamond pattern showing of on the chart of realty income. As far as you just follow the rule of the distance of lowest point of diamond pattern to the highest and measure it. The target is somewhere down to around 10$ .
Whats is a massive downside. If realty income leaves the diamon
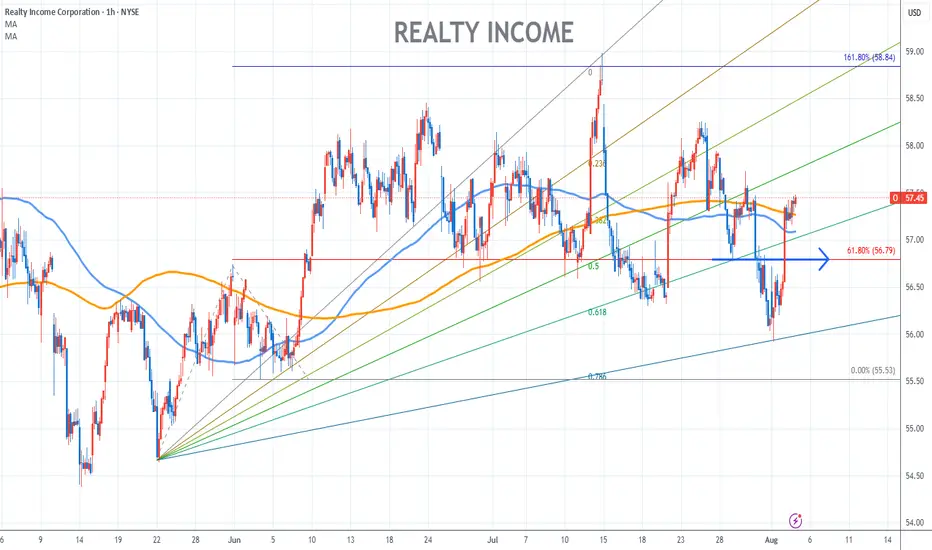
Realty Income Chart Fibonacci Analysis 080425Trading Idea
1) Find a FIBO slingshot
2) Check FIBO 61.80% level
3) Entry Point 57/61.80%
Chart time frame:B
A) 15 min(1W-3M)
B) 1 hr(3M-6M)
C) 4 hr(6M-1year)
D) 1 day(1-3years)
Stock progress:A
A) Keep rising over 61.80% resistance
B) 61.80% resistance
C) 61.80% support
D) Hit the bottom
E) Hi
Realty Income (O) - Loading the SlingshotI see a clean inverse head and shoulders forming here, with price pressing against resistance and volume firming up. MACD is curling bullish, RSI recovering, and price is above the cloud. I’m buying here and collecting the dividend while I wait. Break above $58 could trigger a strong move toward R1
Trade Plan
Entry (Withe): Close to the current zone, after a bounce to the C wave to confirm the structure.
Additional we have a divergence in the squeeze momentum indicator to our favor.
First Target: Primer FVG.
Second Target: Last B wave level.
Stop Loss: under las C Eliot wave. (invalidate structure
O as in OverboughtThis is unusual for me, and full disclosure, I am not personally trading this. I don't short on margin and the spreads on puts are a little too wide for my liking. So think of this as my musing on a market that I think is still overbought from last week.
I get why it has been running - yield is t
O 1D Investment Aggressive Trend TradeAggressive Trend Trade
- short impulse
+ biggest volume TE / T1
+ support level
+ biggest volume 2Sp-
+ weak test
+ first bullish bar close entry
Calculated affordable stop limit
1 to 2 R/R take profit
Monthly Trend
"+ long impulse
+ 1/2 correction
+ SoS level
+ support level
+ weak approach"
1Y
Realty Income (O) – Earnings Week Setup!Realty Income is a real estate investment trust (REIT) known for its monthly dividends and a strong portfolio of commercial properties. The company leases to well-established businesses across different sectors, making it a popular choice for income-focused investors. With earnings coming up this we
O 1H Long CounterTrend TradeCounterTrend Trade
- short impulse
+ volumed T1
+ volumed Sp
+ weak test
+ below first bullish bar close entry
Calculated affordable stop limit
1 to 2 R/R take profit expandable to Investment
Daily Trend:
"+ long impulse
+ exhaustion volume
+ T2 level
+ support level"
Monthly Trend:
"+ long impu
See all ideas
Summarizing what the indicators are suggesting.
Neutral
SellBuy
Strong sellStrong buy
Strong sellSellNeutralBuyStrong buy
Neutral
SellBuy
Strong sellStrong buy
Strong sellSellNeutralBuyStrong buy
Neutral
SellBuy
Strong sellStrong buy
Strong sellSellNeutralBuyStrong buy
An aggregate view of professional's ratings.
Neutral
SellBuy
Strong sellStrong buy
Strong sellSellNeutralBuyStrong buy
Neutral
SellBuy
Strong sellStrong buy
Strong sellSellNeutralBuyStrong buy
Neutral
SellBuy
Strong sellStrong buy
Strong sellSellNeutralBuyStrong buy
Displays a symbol's price movements over previous years to identify recurring trends.
Maturity dateSep 15, 2026
Coupon4.45% (Fixed)
Maturity dateSep 4, 2041
Coupon5.25% (Fixed)
Maturity dateSep 15, 2026
Coupon4.45% (Fixed)
Maturity dateDec 5, 2039
Coupon6.00% (Fixed)
Maturity dateMar 15, 2047
Coupon4.65% (Fixed)
Maturity dateSep 1, 2054
Coupon5.38% (Fixed)
Maturity dateJan 15, 2030
Coupon3.40% (Fixed)
Maturity dateMar 15, 2028
Coupon2.10% (Fixed)
Maturity dateJan 15, 2027
Coupon3.20% (Fixed)
Maturity dateApr 15, 2035
Coupon5.13% (Fixed)
Maturity dateMar 15, 2035
Coupon5.88% (Fixed)
See all O bonds
Frequently asked questions
The current price of O is 62.39 USD — it has increased by 0.61% in the past 24 hours. Watch Realty Income Corporation stock price performance more closely on the chart.
Depending on the exchange, the stock ticker may vary. For instance, on NYSE exchange Realty Income Corporation stocks are traded under the ticker O.
O stock has fallen by −1.15% compared to the previous week, the month change is a −1.88% fall, over the last year Realty Income Corporation has showed a 8.60% increase.
We've gathered analysts' opinions on Realty Income Corporation future price: according to them, O price has a max estimate of 72.00 USD and a min estimate of 61.50 USD. Watch O chart and read a more detailed Realty Income Corporation stock forecast: see what analysts think of Realty Income Corporation and suggest that you do with its stocks.
O stock is 1.39% volatile and has beta coefficient of 0.21. Track Realty Income Corporation stock price on the chart and check out the list of the most volatile stocks — is Realty Income Corporation there?
Today Realty Income Corporation has the market capitalization of 58.56 B, it has increased by 1.08% over the last week.
Yes, you can track Realty Income Corporation financials in yearly and quarterly reports right on TradingView.
Realty Income Corporation is going to release the next earnings report on Nov 9, 2026. Keep track of upcoming events with our Earnings Calendar.
O earnings for the last quarter are 0.37 USD per share, whereas the estimation was 0.40 USD resulting in a −6.97% surprise. The estimated earnings for the next quarter are 0.41 USD per share. See more details about Realty Income Corporation earnings.
Realty Income Corporation revenue for the last quarter amounts to 1.43 B USD, despite the estimated figure of 1.40 B USD. In the next quarter, revenue is expected to reach 1.43 B USD.
O net income for the last quarter is 343.95 M USD, while the quarter before that showed 311.77 M USD of net income which accounts for 0.00% change. Track more Realty Income Corporation financial stats to get the full picture.
Yes, O dividends are paid monthly. The last dividend per share was 0.27 USD. As of today, Dividend Yield (TTM)% is 5.23%. Tracking Realty Income Corporation dividends might help you take more informed decisions.
Realty Income Corporation dividend yield was 5.72% in 2025, and payout ratio reached 277.37%. The year before the numbers were 5.87% and 319.92% correspondingly. See high-dividend stocks and find more opportunities for your portfolio.
As of Aug 12, 2026, the company has 544 employees. See our rating of the largest employees — is Realty Income Corporation on this list?
EBITDA measures a company's operating performance, its growth signifies an improvement in the efficiency of a company. Realty Income Corporation EBITDA is 5.31 B USD, and current EBITDA margin is 88.41%. See more stats in Realty Income Corporation financial statements.
Like other stocks, O shares are traded on stock exchanges, e.g. Nasdaq, Nyse, Euronext, and the easiest way to buy them is through an online stock broker. To do this, you need to open an account and follow a broker's procedures, then start trading. You can trade Realty Income Corporation stock right from TradingView charts — choose your broker and connect to your account.
Investing in stocks requires a comprehensive research: you should carefully study all the available data, e.g. company's financials, related news, and its technical analysis. So Realty Income Corporation technincal analysis shows the sell today, and its 1 week rating is neutral. Since market conditions are prone to changes, it's worth looking a bit further into the future — according to the 1 month rating Realty Income Corporation stock shows the buy signal. See more of Realty Income Corporation technicals for a more comprehensive analysis.