short the marketspx supposed to go upper more but a lot of data shows that inflation will hold the interest rate high for a long.
This will effect the market to go back where it came from.
I see some massive decline since it used much of power to be bullish.
Bearish trend will be created soon.
SPIUSD trade ideas

SPX500 trading in bullish channelThere was some volatility in the market last week. Nevertheless, the SPX500 is trading in a bullish area. The longer this is maintained and the RSI remains above 50 the greater the likelihood of higher prices ahead.
This video is intended for the users of Stratos Markets Limited, Stratos Trading Pty. Limited and Stratos Global LLC, (collectively “FXCM Group”).
Stratos Markets Limited (www.fxcm.com):
CFDs are complex instruments and come with a high risk of losing money rapidly due to leverage. 68% of retail investor accounts lose money when trading CFDs with this provider. You should consider whether you understand how CFDs work and whether you can afford to take the high risk of losing your money.
Stratos Europe Ltd (trading as “FXCM” or “FXCM EU”), previously FXCM EU Ltd (www.fxcm.com) :
CFDs are complex instruments and come with a high risk of losing money rapidly due to leverage. 73% of retail investor accounts lose money when trading CFDs with this provider. You should consider whether you understand how CFDs work and whether you can afford to take the high risk of losing your money.
Stratos Trading Pty. Limited (www.fxcm.com) :
Trading FX/CFDs carries significant risks. FXCM AU (AFSL 309763). Please read the Financial Services Guide, Product Disclosure Statement, Target Market Determination and Terms of Business at www.fxcm.com
Stratos Global LLC (www.fxcm.com):
Losses can exceed deposits.
Any opinions, news, research, analyses, prices, other information, or links to third-party sites contained on this video are provided on an "as-is" basis, as general market commentary and do not constitute investment advice. The market commentary has not been prepared in accordance with legal requirements designed to promote the independence of investment research, and it is therefore not subject to any prohibition on dealing ahead of dissemination. Although this commentary is not produced by an independent source, FXCM takes all sufficient steps to eliminate or prevent any conflicts of interests arising out of the production and dissemination of this communication. The employees of FXCM commit to acting in the clients' best interests and represent their views without misleading, deceiving, or otherwise impairing the clients' ability to make informed investment decisions. For more information about the FXCM's internal organizational and administrative arrangements for the prevention of conflicts, please refer to the Firms' Managing Conflicts Policy.
Please ensure that you read and understand our Full Disclaimer and Liability provision concerning the foregoing Information, which can be accessed via FXCM`s website:
Stratos Markets Limited clients please see: www.fxcm.com
Stratos Europe Ltd clients please see: www.fxcm.com
Stratos Trading Pty. Limited clients please see: www.fxcm.com
Stratos Global LLC clients please see: www.fxcm.com
Past Performance is not an indicator of future results.

SPX500USD ( UPWARD )SPX500USD
Tendency the price is a long in 5,327
Turning level : The turning 5,327, so as long as the price trending above this level, there will be a bullish trend
resistance level : trade above 5,327 , the price will up to 5,375, then trending in this level touch a 5,400
support level : braking a turning level 5,327 and stable this level ,the price will reach the support level of 5,300 and 5,252
corrective level : price will attempt 5,327 , correct itself before long , then create a new historical price

SPX is going short on the 10-minute chart analysis, I used fib and it's looking like there is a start for a correcting wave i don't know if it will happen but that seems the case for me.

SPX - Waiting for ADP and ISM SPx
The price already pushed up and reached our price we mentioned which is 5301, due to the JOLTs result was Negative results, so today also we have ADP and ISM that remain Negative results expectation, so depending on the news expected the direction should be bullish trend,
However, it tries to continue its bullish trend to get 5320, then the movement will be between 5320 and 5302
Bullish scenario: as long as the price trades above 5302 means will continue the bullish trend toward 5320 and above it will be 5347
Bearish scenario: should be stabilized under 5301 to get 5260, and stabilize 1h candle under 5260 means will drop to get 5226
Pivot line: 5302
Resistance line: 5320, 5347, 5390
Support line: 5260, 5226, 5193
The price will move between Support 5284 and Resistance 5347

SPX rising wedge into electionsClear rising wedge here supporting a slow summer meltup continuation into 5555-5638 area before election / breakdown before election
Plan is to play the wedge for continued upside into 5555+
Will flip short if 5179 is lost. If 5179 falls then a short to 4750-4820 begins.

US500RSI indicates Bearish Divergence. Which means that at any time the market trend can change to LL and LH.

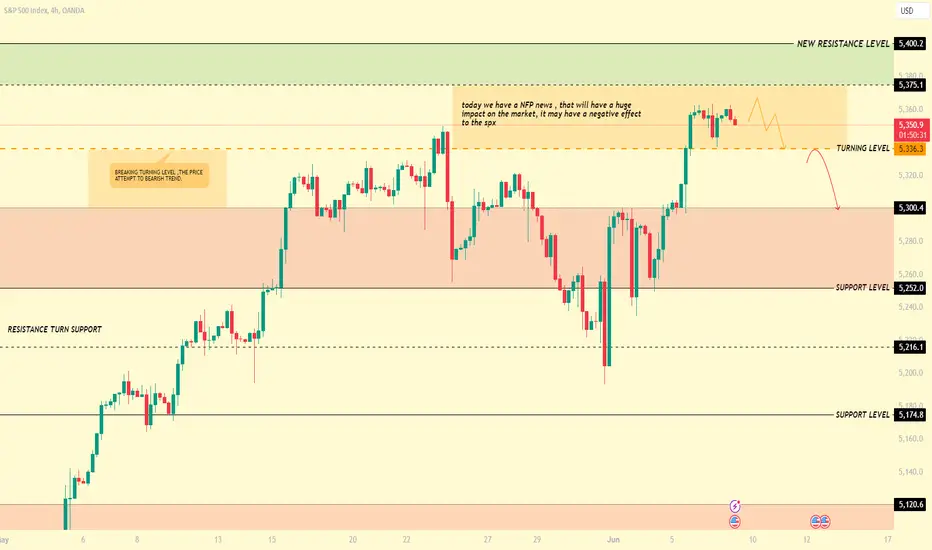
SPX500USD ( EFFECT NFP )SPX500USD
Tendency the price effect downward pressure
Turning level : The turning 5,336, so as long as the price trending above this level, there will be a bullish trend , but breaking this level the price it comes down ward pressure
resistance level : trade above 5,336 , the price will up to 5,375, then trending in this level touch a 5,400
support level : braking a turning level 5,336 ,the price will reach the support level of
5,300 and 5,252
* today we have a NFP , news I urge the trader to trading very carefully
SPx (Correction after rally or finished) Technical Analysis of SPx
the price will move under the NFP and the Unemployment rate pressure, so the movement will be huge for the indices.
Bullish Scenario: For a bullish trend to emerge, the price must stabilize above 5260, potentially pushing up to 5302. If the price surpasses this level, it may indicate the start of a new bullish trend of about 5347. but right now as long as the price trades above 5347 means will try to touch 5378 as well.
Bearish Scenario: if the price breaks 5347 means will drop to touch 5320 and then downward should break the support zone which is 5301 to get 5259
Pivot Line: 5347
Resistance Levels: 5378, 5400, 5423
Support Levels: 5320, 5302, 5260
Today’s expected trading range is between the support at 5301 and the resistance at 5423.
Market Concentration Hits Record Levels with Microsoft NASDAQ:MSFT , Nvidia NASDAQ:NVDA , and Apple NASDAQ:AAPL
For the first time since at least 2000, three U.S. stocks—Microsoft Corp., Nvidia Corp., and Apple Inc.—now account for over 20% of the S&P 500's total value, according to Dow Jones Market Data. This means that these three companies alone are worth more than hundreds of other constituents combined, as highlighted by data from Bespoke Investment Group.
Historically, increasing concentration in a few large-cap stocks has often coincided with stronger overall returns for the S&P 500. However, the rapid rise in the values of these tech giants is causing some concern among investors. Even those who have been bullish are starting to feel uneasy about the growing dominance of these few stocks within the index.

Perfect S&P short?Looks awesome, just check back. I don't think we'll see higher, but who knows! This looks like a great short.


Blow off top coming to 7500 by June 2025Two rising channels. One quite wide and the other one narrow. Both point to a target between 6500 to 7400 pips on Sp500.
My guess is that even after election we are going to see a massive rally to 1000 more pips on Sp500
You must know what happens next.

US 500 ShortOn the 1-hour chart, I see a short possibility on the SP500.
This trade is against the prevailing trend, but 1:2.5 RR makes it worth a shot.
The trade remains valid until the current 1-hour down wick is retested.

SPX long term chartIn my view SPX target from 2020 low @2100 is 6400; Critical area in my point of view is 5500-5530 where a bearish correction could occur to target 4250 area where the long term bullish trend will resume to 6400 target in 2027;
If 5530 area will be broken then SPC could target 6400 in March 2025.
I will short spx @5500 stop loss 5550 target 4250.

US500 (S&P): Trend in daily time framePlease pay special attention to the very accurate trends, rectangles, and colored levels.
Its a very sensitive setup, please be careful.
BEST,
MT


The SPX may be at key resistance Intraday Update: The SPX has reached the 161% extension of the April high/low and channel resistance. RSI is obviously overbought and divergent, but that has not mattered at all in this bull trend.

A Possible Path for SPX 500 to top around 6000A Possible Path for SPX 500 to top around 6000
This is a conjecture of mine of how this bull market could end

SPX500Hello guys I'm back again to once again show you how my analysis is playing out first TP almost hit guys.
VHT your mentor signing out

#SPX500
The trend is completely upward, according to the pattern being built, it can be the last buying target, after which you can think about selling positions.

SP500 ready for pullback?Hi Guys,
The US 500 seems to be in a pretty good position for a pullback/ sell opportunity.
It is currently at the 1.618 retracement and 2.0 retracement of its two previous pullbacks and looks like its finding resistance at the current level.
1 hour RSI is showing divergence and a break of the descending triangle and retest would be good entry with chart or candlestick pattern.
As has been the case for a while now, I will be looking to add a long position at one of the demand zones/ support areas below.
Safe trading all

Comparison of BTC VS SPX Dailey Cycle low timing Here you can see a daily cycle low count on BTC starting from the lowest low in the 4year cycle, the November 2022 Low area.
If we start our BTC DCL count from this anchor point we can see the resulting periods of correlation and de-correlation between the price of the SPX and that of BTC.
Notice in more recent cycles how the BTC and SPX cycles are deiplaying an offset relationship by about 25 odd days.
This can be seen as BTC is marking lows at times in the SPX is in a higher region of price.
Or BTC consolidation while SPX marking lows, only for BTC to lag the SPX and follow along to mark the half cycle lows.

S & P 500 Index_ Distribution Prices for _ Distribution _ PricesS & P 500 Index_ Distribution Prices for _ 3 years _ Economic _ Range
I will be calculating 3 years _ Economic range!
Enjoy!
Distribution prices for June:
$5,542.06
$5,581.53
$5,679.88
$5,728.74
$5,737.08
______________________
Market will take short break from here.
After the Mid Retest we will be expecting the following distribution prices:
$5,873.24
$5,988.68
$6,042.13
$6,068.94
$6,126.24
