Meet the new version of Pine Script v4 programming language! It includes quite a few new features. We improved the structure of the language and fixed a number of issues. However, the most crucial and long-awaited feature is the support of drawing objects.
We are going to briefly mention the new features in this blog post. Please read through the documentation and reference manual if you’d like to learn the details (note that you can go straight to the drawing objects description section).
Label Drawing Object
The label.new function allows you to draw labels on the chart including ones that contain arbitrary text. Here is an example of a script that draws a label containing the last bar’s close:
//@version=4
study("Last Bar Price", overlay=true)
l = label.new(bar_index, na, 'last price is '+tostring(close),
color=close >= open ? color.green : color.red,
textcolor=color.white,
style=label.style_labeldown, yloc=yloc.abovebar)
label.delete(l[1])
You can edit and delete the label object after creating it using the
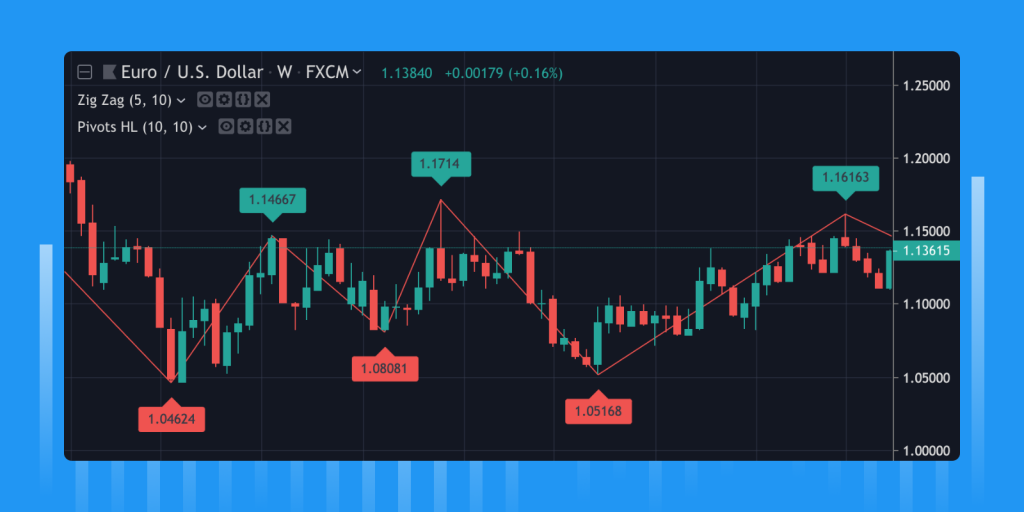
label.* function family. Here is an example of a more complex script using label — Pivot Points High/Low.
Line Drawing Object
The line.new function allows you to draw lines on the chart. Here is an example of a simple script that draws a line which connects the high of the current bar and the low of a 10th historical bar:
//@version=4
study("Line", overlay=true)
l = line.new(bar_index, high, bar_index[10], low[10], width = 4)
line.delete(l[1])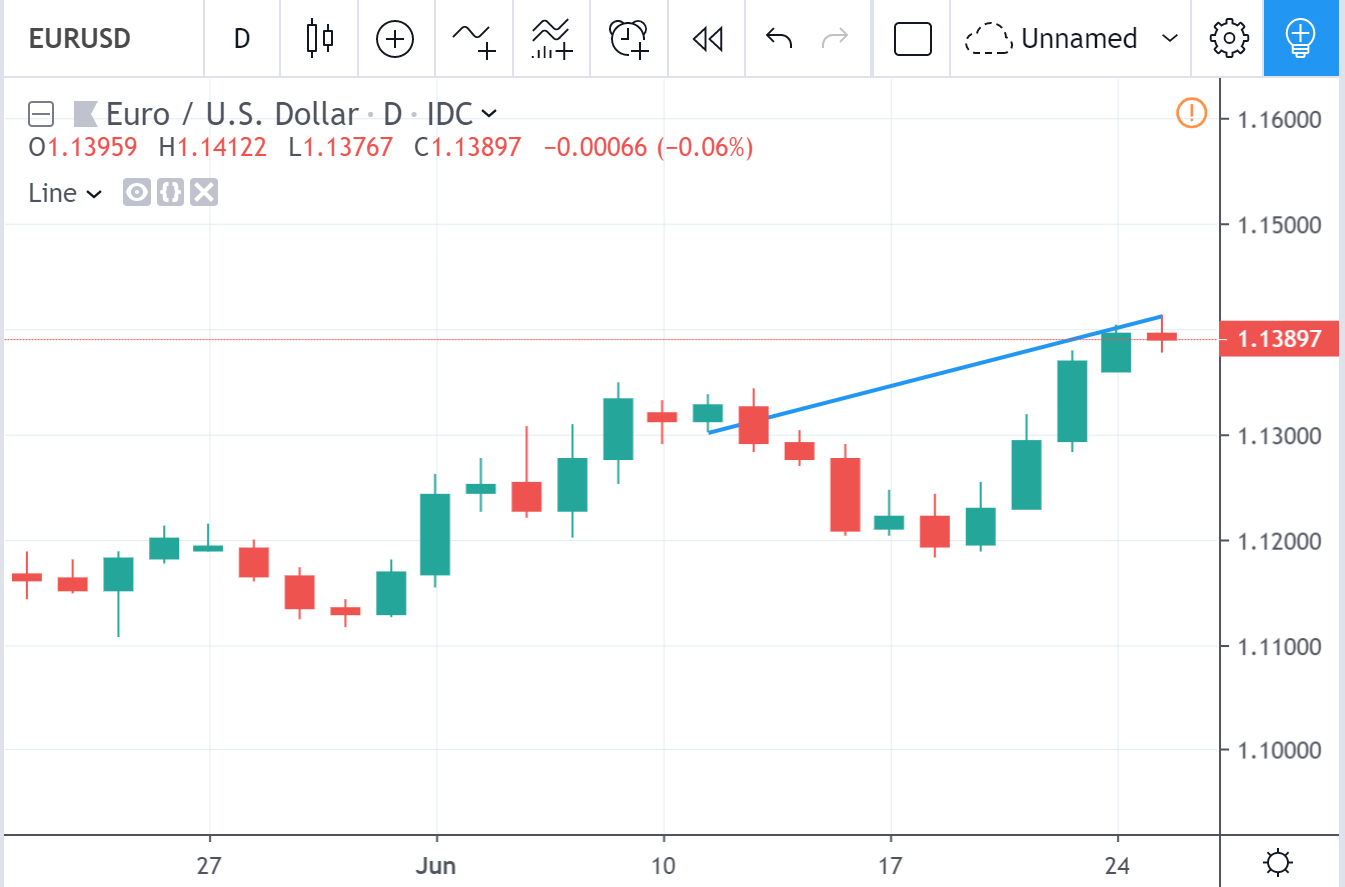
Line objects can be edited and deleted using the appropriate functions of the
line.* family. Here is an example of a more complex script using line objects — Zig Zag.
Please note that we can currently display a total of approximately 50–55 drawings of a single type (label or line) per script on the chart. This is an intended limitation designed to prevent excessive server usage.
The new line and label data types greatly enhance the capabilities of Pine Script, by allowing you to implement a complex logic behind popular indicators in user scripts. Examples can be found in the documentation.
Series String
We now support variables of a series string data type. Here is an example of using series strings in labels:
//@version=4
study("Series string", overlay = true)
draw_label(title) =>
label.new(bar_index, high, text=title)
t = close >= open ? "green" : "red"
draw_label(t)
Var Keyword
A variable that is declared in the usual way is reinitialized on each calculation of the script. This required scripts to propagate the variable’s previous value explicitly. The var keyword declares a variable and initializes it only once. This allows the value of the variable to be automatically saved between bars from the moment of initialization or the last assignment. Here is an example of a script that counts the number of green bars on the chart:
//@version=4
study("My Script")
var s = 0.0
if close >= open
s := s + 1
plot(s)Each time the close >= open condition is met, the value of the s variable will increase by one. The initializing value can be any arithmetic expression.
The syntax for declaring variables with the var keyword avoids the use of the following code: s := nz(s[1], s). Declaring variables with the var modifier can be very useful when working with drawings.
Renaming of Built-in Constants, Variables and Functions
In Pine Script v4 the following built-in constants, variables, and functions were renamed:
- Color constants (e.g red) are moved to the
color.*namespace (e.g. color.red). - The color function has been renamed to color.new.
- Constants for input types (e.g. integer) are moved to the
input.*namespace (e.g. input.integer). - The plot style constants (e.g. histogram style) are moved to the
plot.style_*namespace (e.g. plot.style_histogram). - Style constants for the hline function (e.g. the dotted style) are moved to the
hline.style_*namespace (e.g. hline.style_dotted). - Constants of days of the week (e.g. sunday) are moved to the
dayofweek.*namespace (e.g. dayofweek.sunday). - The variables of the current chart timeframe (e.g. period, isintraday) are moved to the
timeframe.*namespace (e.g. timeframe.period, timeframe.isintraday). - The interval variable was renamed to timeframe.multiplier.
- The ticker and tickerid variables are renamed to syminfo.ticker and syminfo.tickerid respectively.
- The n variable that contains the bar index value has been renamed to bar_index.
The reason behind renaming all of the above was to structure the standard language tools and make working with code easier. New names are grouped according to assignments under common prefixes. For example, you will see a list with all available color constants if you type ‘color’ in the editor and press Ctrl + Space.
Explicit Variable Type Declaration
In Pine Script v4 it’s no longer possible to create variables with an unknown data type at the time of their declaration (see na value). This was done to avoid a number of issues that arise when the variable type changes after its initialization with the na value. From now on, you need to explicitly specify their type using keywords or type functions (for example, float) when declaring variables with the na value:
//@version=4
study("NA", overlay=true)
float a = na
a := if close >= open
high
else
low
plot(a)Give the new Pine Script v4 a try! Some users have already tested new features and have written several impressive scripts using drawings.
For example, Ricardo Santos has written a series of scripts that you can see below:


Joris Duyck wrote the Trendlines script, illustrating the possibilities of the line drawing.

We hope these examples will inspire you! You can ask questions, discuss issues and share feedback in our chat. We want to thank all Pinescripters community members, who took part in beta-testing and helped us a lot! You can also ask code-related questions on our Stack Overflow page.