A partir de hoy, los inversores en TradingView pueden trazar datos financieros de las acciones que les interesan. Analice las tendencias en ingresos, desbloquee información oculta sobre las ganancias de una empresa y más. Esta nueva versión ofrece a todos los datos financieros que necesitan para evaluar la situación financiera de una empresa y determinar si está sobrevaluada o infravalorada.
Para comenzar, busque el botón Finanzas ubicado en la parte superior de su gráfico de TradingView y presiónelo:

Todos los datos financieros en TradingView se organizan en cuatro categorías principales: estado de resultados, balance general, flujo de caja y ratios. Después de presionar el botón Finanzas en la parte superior de su gráfico, se le presentará una ventana que muestra estas cuatro categorías y los diferentes indicadores en cada grupo. Aquí es donde puede seleccionar y graficar indicadores como EPS y EBITDA (búsquelos en la sección Estado de resultados) o las relaciones precio / ganancias y precio / ventas (búsquelos en la sección Ratios).
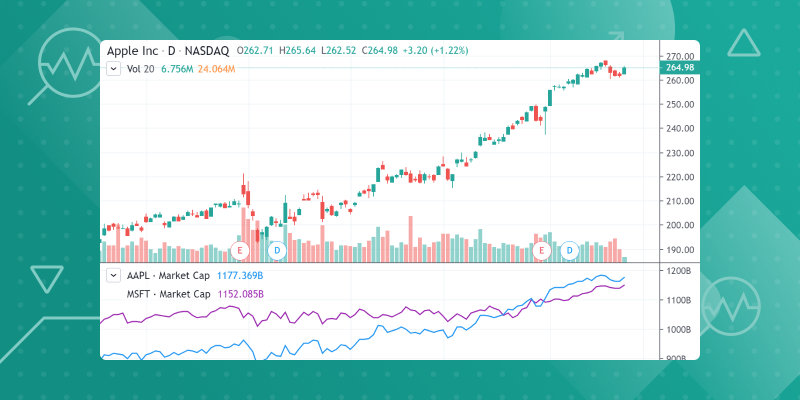
También puede comparar y contrastar los mismos indicadores financieros para diferentes compañías en el mismo gráfico. Para hacer esto, presione el botón Configuración en su gráfico, vaya a Entradas y presione el botón para agregar Otro Símbolo:

Los siguientes indicadores financieros se han agregado a TradingView y estamos entusiasmados de ver cómo los usan los inversores. En los próximos meses, agregaremos más indicadores y formas únicas de evaluar a las empresas. Aquí hay una guía detallada sobre cada indicador fundamental:
Estado de resultados
| Ingresos totales | El campo representa ventas brutas y otros ingresos operativos menos descuentos, devoluciones y bonificaciones. |
| Coste de ingresos, total | El campo devuelve como la suma del Coste de los bienes vendidos – Excluyendo Depreciación y Amortización |
| Gastos totales operativos | Representa la suma de todos los gastos relacionados con las operaciones. |
| Beneficio Bruto | El campo representa la diferencia entre ventas o ingresos y el costo de los bienes vendidos y la depreciación. Beneficio bruto = Ingresos – Coste de los bienes vendidos incluidos D&A. |
| Investigación y Desarrollo | El campo representa todos los costes directos e indirectos relacionados con la creación y el desarrollo de nuevos procesos, técnicas, aplicaciones y productos con posibilidades comerciales. |
| Selling/General/Admin Expenses, Total | El campo devuelve Gastos operativos totales: Desarrollo de investigación más Ventas generales y administrativas. |
| Operating Income | El campo representa la diferencia entre ventas y gastos operativos totales. |
| Ingresos Netos | El campo devuelve los ingresos netos disponibles para BPA comunes totalmente diluidos para el período y las fechas solicitados en moneda local de forma predeterminada. |
| Diluted EPS | The field returns fully-diluted Earnings Per Share as reported on a company’s filing. |
| EBITDA | The field returns EBITDA (Operating Income Plus Depreciation & Amortization). This is calculated as the sum of EBIT (Operating Income) and Depreciation, Depletion and Amortization.
If Depreciation, Depletion, and Amortization is not available, then Depreciation, Depletion and Amortization (Cash Flow) will be substituted. Note, given the nature of the data items included in this calculation, this formula will only return data for industrial companies. |
Balance Sheet
| Total Assets | The field represents the sum of total current assets, long-term receivables, investment in unconsolidated subsidiaries, other investments, net property plant and equipment, deferred tax assets, and other assets. |
| Long Term Debt | Non-Current Portion of Long Term Debt. The field represents all interest-bearing financial obligations, excluding current portion of long-term debt, pensions, deferred taxes and minority interest. |
| Total Debt | Total Long Term Debt. The field represents all interest bearing and capitalized lease obligations. It is the sum of long and short-term debt. |
| Total Liabilities | The field represents all short- and long-term obligations expected to be satisfied by the company. |
| Total Equity | The field represents total equity for the period and date(s) requested. |
| Total Liabilities & Shareholders’ equities | The field represents the sum of total liabilities, minority interest, non-equity reserves, preferred stock and common equity. |
Flujo de Caja
| Cash from Operating Activities | The field represents net cash from operating activities. |
| Cash From Investing Activities | The field represents net cash from investing activities. |
| Cash From Financing Activities | The field represents net cash from financing activities. |
| Free Cash Flow | The field represents free cash flow for the entire firm. |
Ratios
| Return on Equity | This is calculated as Net Income TTM divided by the two fiscal period average of Total Shareholders’ Equity. |
| Price Book Ratio | This is calculated as Price per share divided by Book Value per Share. |
| Price Cash Flow Ratio | This is calculated as Price per share divided by Operating Cash Flow per Share. |
| Price Sales Ratio | This is calculated as Price per share divided by Sales Per Share. |
| Price Earnings Ratio | This is calculated as Price per share divided by Diluted Earnings per Share TTM. |
| Market Capitalization | This is calculated as Price per share multiplied by the Number of Shares outstanding. |
| Earnings Yield | This is calculated as Diluted Earnings per Share TTM divided by Price per share. |
While using financial data, it’s important to remember that financial data is derived from the published financial statements of companies, for example SEC filings. Sometimes a company will be missing certain data points over specific time periods and it’s often because of a change in data from the main source. This can impact the availability of that data.
It is worth noting that our data provider, Factset, uses its own methodology for collecting and processing data, which is why financial indicators on TradingView may differ from similar indicators provided by other sources. You can find more info here.
Thanks for being a TradingView member and please let us know if you enjoy this release!