Why only noobs draw trendlines in BTC
Ok guys, here is a real shocker for most people that really loooooove those lines. I mean, I get it. Lines are nice. They give you some sense of
security, some sense of predictability.
They also look nice, and as if that wasn't enough, they are also super easy to draw XD
Unfortunately, they don't mean a lot for BTC.
And all the people saying 4k will be the bottom BECAUSE LINE, don't get BTC or how BTC grows.
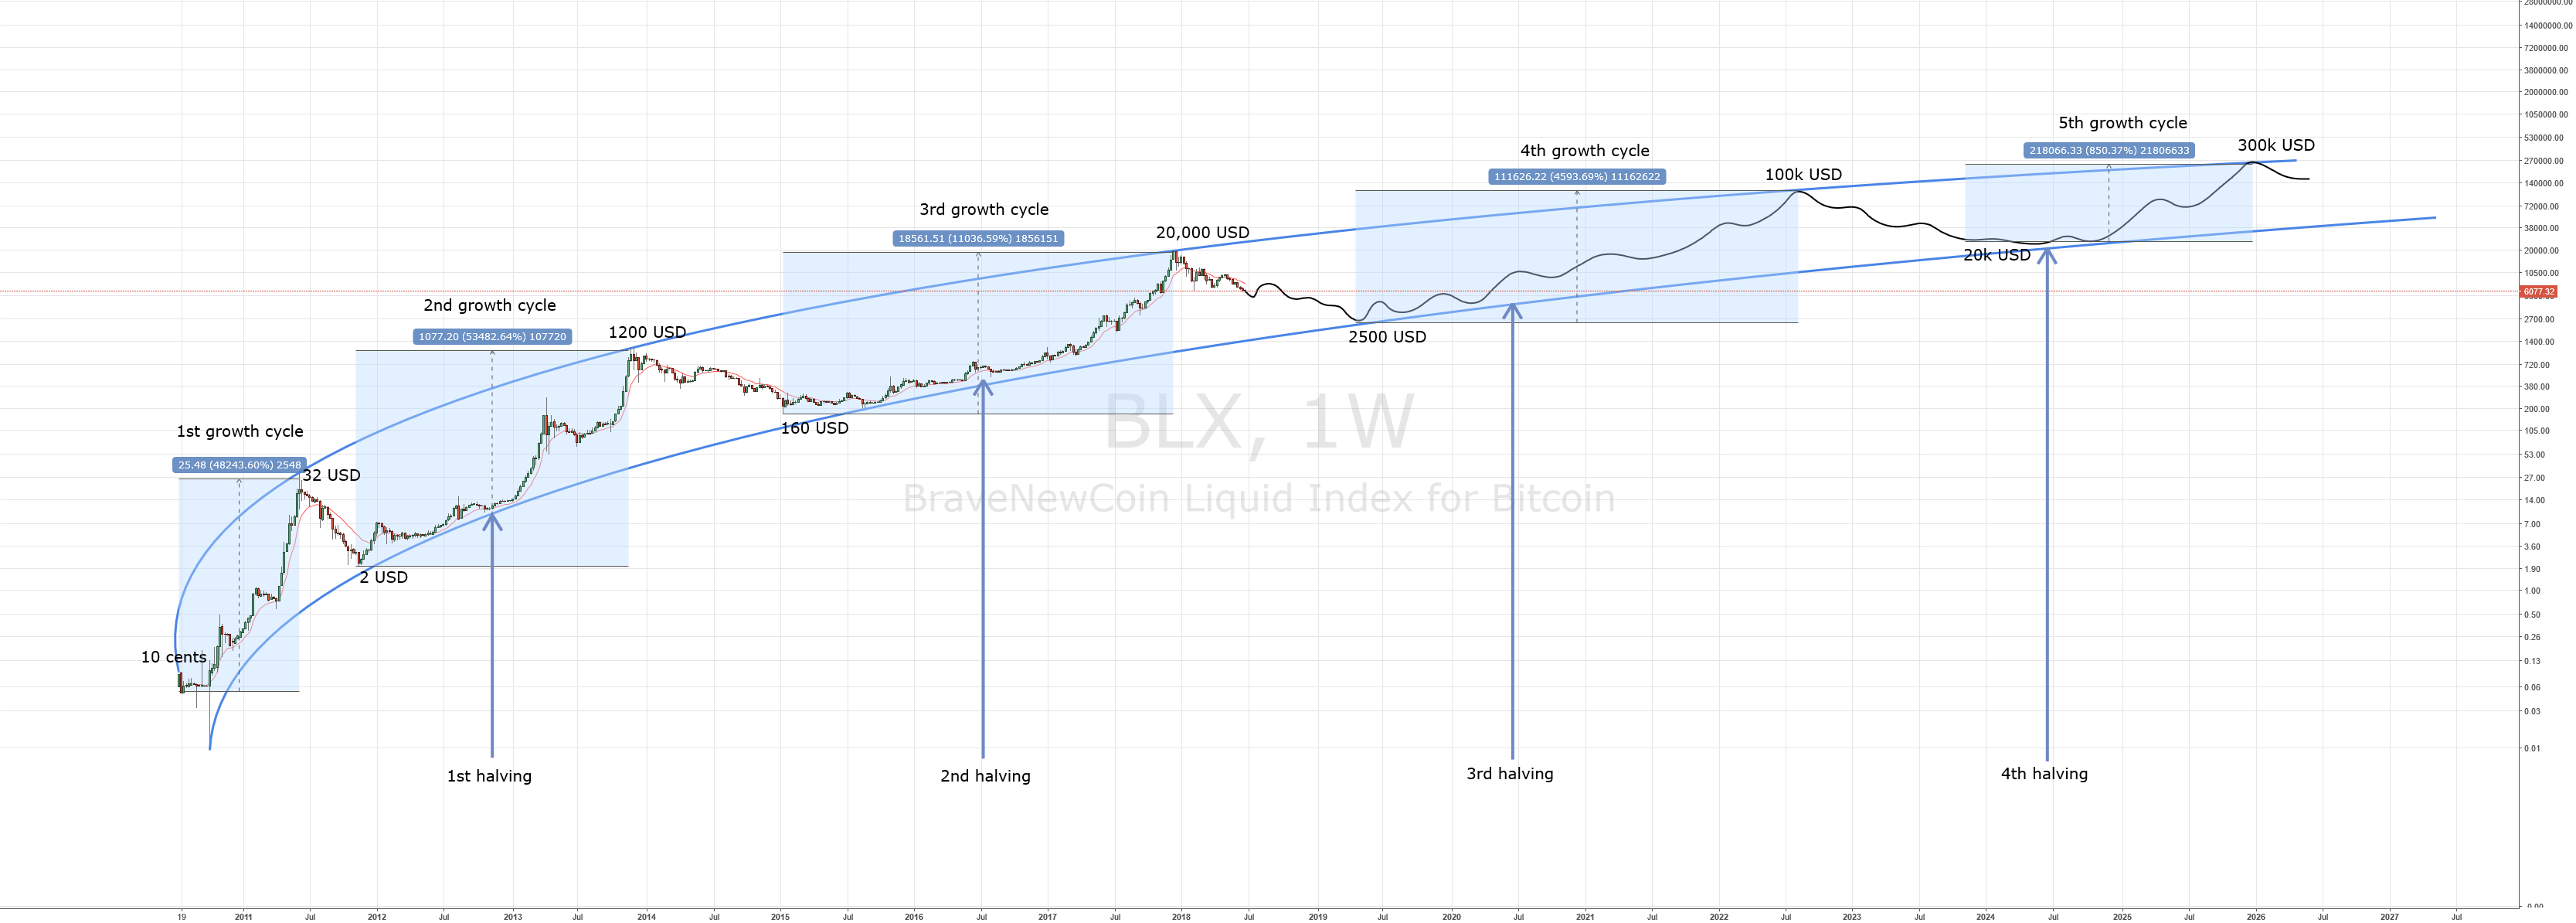
It is not a line, look at some other charts for example:

You can see that BTC grows as some kind of a SQRT function in the log chart.
So not straight exponentially, that would make no sense, since there has to be some kind of asymptotic maximum value, it cannot just always go on exponentially.
Every major support line since 2010 BROKE.
EVERY. SINGLE. ONE.
And BTC still made new ATHs every time.
They don't mean jacksh@t. So please do yourself a favor and stop paying too much attention to them ;)
security, some sense of predictability.
They also look nice, and as if that wasn't enough, they are also super easy to draw XD
Unfortunately, they don't mean a lot for BTC.
And all the people saying 4k will be the bottom BECAUSE LINE, don't get BTC or how BTC grows.
It is not a line, look at some other charts for example:
You can see that BTC grows as some kind of a SQRT function in the log chart.
So not straight exponentially, that would make no sense, since there has to be some kind of asymptotic maximum value, it cannot just always go on exponentially.
Every major support line since 2010 BROKE.
EVERY. SINGLE. ONE.
And BTC still made new ATHs every time.
They don't mean jacksh@t. So please do yourself a favor and stop paying too much attention to them ;)
Comment:
So we touched yesterday exactly this support trendline, which goes all the way back to 2015. However, strange enough, the bounce is very weak, and we're resting a bit above the trendline. For me, that is a very weak signal and means that we'll certainly go lower. Now, the question is, how will this unfold?
Scenario 1:
We'll go below 4200 this day or the next days.
I don't like that scenario a lot, because it means uncertainty. The drop would be too brutal for my taste, meaning that either, it is the end of the bear cycle, or, it is the beginning of a longer lasting capitulation, which ultimately leads to a the last dump of the bear cycle in 2019 to a staggering 1200, or down to that area. If we do go lower the next days, I'll buy now, and leave a sizable portion to buy coins in case some crazy stuff like that happens.
Scenario 2:
I like this one much more.
Despite the weak bounce, BTC creeps upwards from here, over a few weeks, maybe even back to the 6k area. From there, we start the next dump wave in Jan-Feb 2019 down to the weekly MA200 reagion, with the final capitulation being at around 2500-3000 USD. This one would be far easier to play, one could just buy at that price point with closed eyes.
We'll see the next days what will happen.
The intensitiy of this dump here takes me by surprise also.
Comment:
So the trendline has been broken, that's why the linear trendlines don't work with BTC. The real support is not a line in the log chart, but a SQRT function.
Let's see how the long/short ratio develops on finex, maybe we'll get a bounce. If not, and the trendline breaks in this dump wave, we go straight to 3k, which would be absolutely brutal. This would have some implications on the 2019 low, which I will then post, after this dump wave is over.