Bitcoin - Bitcoin Left Behind the Stock Market!?Bitcoin is in its descending channel on the four-hour timeframe, between the EMA50 and EMA200. In case of an upward correction towards the specified supply zone, it is possible to sell Bitcoin with a better risk-reward.
It should be noted that there is a possibility of heavy fluctuations and shadows due to the movement of whales in the market and compliance with capital management in the cryptocurrency market will be more important. If the downward trend continues, we can buy in the demand range.
A group of U.S. lawmakers has called on the Securities and Exchange Commission (SEC) to enforce an executive order issued by President Donald Trump that opens the door for cryptocurrency investments within the $12.5 trillion 401(k) retirement fund market. Signed in August, the order authorizes 401(k) plans to offer cryptocurrencies as a new investment option.
Members of the House Financial Services Committee, in a formal letter, praised the order for its potential to help Americans boost their retirement savings. They urged the SEC to work with the Department of Labor to update existing rules and guidelines, with the aim of enabling millions of Americans to gain access to such investment opportunities for their retirement.
The letter further stated: “We also ask the SEC to review the bipartisan bills currently advancing in the 119th Congress regarding accredited investors. We hope these measures will allow the 90 million Americans who are currently excluded from alternative investments to secure a more dignified and comfortable retirement.”
Meanwhile, the Senate Finance Committee announced that it will hold a hearing this week on the issue of digital asset taxation, as industry stakeholders continue to press for greater clarity in federal regulations.
According to Committee Chairman Mike Crapo, the session—titled “Examining the Taxation of Digital Assets”—is scheduled for October 1. The official notice confirmed that Lawrence Zlatkin, Vice President of Tax at Coinbase, and Jason Somensatto, Policy Director at Coin Center, will testify at the hearing.
The committee had earlier invited public comments on how existing tax laws should apply to digital assets and whether new legislative frameworks are needed. The upcoming session is expected to draw heavily on the recommendations of the White House Digital Asset Working Group, which urged lawmakers to recognize cryptocurrencies as a distinct asset class and establish tailored tax rules separate from those applied to commodities and securities.
From a market perspective, liquidation heatmaps in the futures market highlight clusters of leveraged positions at key levels. When the price fell between $114,000 and $112,000, a wave of long liquidations occurred simultaneously, leading to heavy wipeouts and accelerating the downward momentum.
Risk pockets remain around the $117,000 level, making both sides of the market vulnerable to liquidity-driven volatility. Without strong demand at these levels, fragility persists, increasing the likelihood of another sharp downward move.
Fed

NAS100 - Stock Market Awaits Employment Data!The index is above the EMA200 and EMA50 on the four-hour time frame and is in its long-term ascending channel. If the upward momentum decreases, we can expect a correction to the demand range and buy Nasdaq in that range with an appropriate reward for the risk.
According to reports released over the weekend, UBS stated that there is a 93% probability of the U.S. economy entering a recession this year. This figure implicitly suggests that the country may already be in recession, though some analysts remain skeptical of such a direct conclusion. UBS’s projection is based on indicators such as personal income, consumption, industrial production, and employment.
The bank warned that the U.S. economy has reached “historically troubling levels,” though no outright collapse has yet occurred. Analysts at UBS described the economy as “weak, soft, and fragile,” while noting that a definitive declaration of recession has not been made.
In the United States, an official declaration of recession is the responsibility of the Business Cycle Dating Committee at the National Bureau of Economic Research (NBER), which typically makes such calls with a lag of 6 to 18 months after the recession has started. Their assessment relies on revised data covering GDP, employment, income, sales, and production, and they generally avoid premature decisions.
In the meantime, policymakers and markets tend to act on real-time indicators such as GDP estimates, jobs data, yield curve signals, and credit spreads. In practice, traders react more strongly to price movements than to formal definitions of recession.
Separately, Michael Feroli, chief U.S. economist at J.P. Morgan, dismissed Fed board member Steven Miran’s call for cutting rates to 2.5% or lower. The bank has maintained its forecast for gradual 25-basis-point cuts, targeting a range of 3.25% to 3.5% by early next year.
A potential Supreme Court case involving Fed board member Lisa Cook has also emerged as a “wild card,” since a ruling against her could undermine the positions of other members as well. J.P. Morgan has warned that politicization of the Federal Reserve would leave the institution more vulnerable to pressure from a Trump administration on monetary policy.
The U.S. dollar remained relatively strong this week, as investors continued to parse the Fed’s less-dovish stance. While the latest dot plot showed policymakers aligned with the market on two additional rate cuts this year, the median dot for 2026 pointed to only one more 25-basis-point reduction. By contrast, markets still expect as many as three cuts next year.
However, following Chair Jerome Powell’s cautious tone on Tuesday—emphasizing that the Fed must continue balancing the competing risks of elevated inflation and a weakening labor market—investors scaled back some of their bets.
Inflation risks remain significant. The OECD highlighted this week that the full effects of tariff hikes are still unfolding. What supports Powell’s cautious approach is that, despite signs of labor market weakness, the Fed’s own forecasts remain relatively optimistic, with economic activity showing resilience. The Atlanta Fed’s GDPNow model projects 3.3% growth for Q3.
Although last week’s inflation data failed to dampen market optimism for rate cuts—and equities continued their rally—the focus in the coming week will shift back to labor market conditions.
The week begins Monday with pending home sales data. On Tuesday, the JOLTS job openings report and the consumer confidence index will be released. Wednesday brings private-sector employment data from ADP, followed by the ISM Manufacturing PMI. On Thursday, weekly jobless claims will be published as usual.
All of these releases will build up to Friday’s critical nonfarm payrolls (NFP) report, widely seen as the market’s ultimate test.Investors will closely monitor whether recent labor market weakness persists, and whether the Fed can move another step toward a rate cut at the October meeting. Finally, the ISM Services Index will provide a more comprehensive picture of U.S. economic health.
Ahead of the jobs data, traders may also take note of remarks from several Fed officials, including Vice Chair Jefferson, New York Fed President Williams, Atlanta Fed President Bostic, Chicago Fed President Goolsbee, and Dallas Fed President Logan. The ADP and NFP releases on Wednesday will likely provide the first snapshot of September labor market performance.

The DOW, Gold, and Morgan StanleyAs it turns out, the stock market that appears to be the gift that keeps giving, is actually giving nothing. In reality, when we measure the value of the DOW with real money (Gold) rather than fiat inflationary currency, the markets are crashing down so fast it'll make your head spin. The $NYSE:DOW/TVC:GOLD shows us that what appears to be one of the greatest bull markets in the history of the entire exchange, is actually just one giant melt up fueled by monetary expansion and inflationary action.
Morgan Stanley NYSE:MS recent came out and shared their new edit to their famous 60/40 portfolio arrangement. In this edit, they entertained the idea that inflation was simply not friendly to the client's holdings and that they should actually diversify their positions. Originally, the 60/40 portfolio consisted of 60% equities, and 40% bonds. However, they presume that the future will not bring a passive environment to the boring 40% bonds because, like anyone with two eyes and a brain, they believe that higher inflation lies ahead. Their solution? Get this, to buy Gold . Who would of thought of something so genius? The profound idea that a placeholder of value would hold value and protect you from inflation could only possibly be developed in such a megabank super titan with trillions in AUM. All sarcasm aside though, it might not be exactly obvious to most what this means for gold and bonds.
Firstly for bonds, most of which are held in treasuries, we can expect some sort of retail selloff only to be bought back up again by the Fed. So nothing news worthy there. However for our precious gleaming metal, we can expect a continuing bull run as money leaves the debt market and enters into precious metals (again namely gold). We should also be inclined to believe that this should help gold mining companies and give them a nice increase in their stock values over time. Next, we shouldn't expect to much of a move from this in the stock market except the usual volatility and seasonal shifts.
Lastly, from this admission from the boys at Morgan Stanley, we can also expect continuing inflation despite what the numbers released by the Fed say. No, the cost of living will not lower. No, the Fed will not raise rates to curb inflation. No, the numbers are never real and never will be. But this does mean that we know what's coming and how to protect ourselves.
Here are the possible plays to consider
Gold: GOLD (USD/OZ)
Stocks: NYSE:NEM , $B, NYSE:EGO , AMEX:EQX , NYSE:AEM
ETF: GDX, GDXJ

Tokyo Core CPI remains unchanged, US PCE Index ticks higherThe Japanese yen has stabilized on Friday. In the North American session, US/JPY is trading at 149.61, down 0.11% on the day. The yen has taken a beating over the past two days, falling 1.5%.
Tokyo Core CPI held steady in September at 2.5% y/y. This matched the downwardly revised August reading and was lower than the market estimate of 2.8%. Tokyo Core CPI excluding food and energy dropped to 2.5%, down sharply from 3.0% in August. Food inflation remains high but eased to 6.9% in September from 7.4% in August.
The Bank of Japan will include this data in the mix when it meets next on October 29-30. Aside from inflation, BoJ policymakers will be looking at the impact of US tariffs on the economy.
The US PCE Price Index, which is the Federal Reserve's preferred inflation indicator, ticked higher in August. Annualized, PCE rose to 2.7%, up from 2.6% in July and in line with the consensus. Monthly, PCE gained 0.3%, up from 0.2% in July and matching the consensus.
With inflation largely under control, the Federal Reserve's priority has shifted to the US labor market. The last two nonfarm payrolls reports showed marginal job growth and missed expectations, raising concerns that the labor market is quickly losing steam. If next week's nonfarm payroll report is soft, it could cement an October rate cut.
USDJPY is testing support at 149.75. Next, there is support at 149.62
There is resistance at 149.89 and 150.02

Dollar Index Holds Firm on Fed CautionFundamental approach:
- DXY edged higher this week amid firmer US data and cautious Fed rhetoric that tempered aggressive easing bets. Risk sentiment was mixed, with markets awaiting core PCE for policy cues, supporting the dollar on rate differentials and data resilience.
- Stronger jobless claims and an upgraded Q2 GDP print underpinned the greenback, while Fed speakers highlighted divisions over the pace of additional cuts, limiting the index's downside.
- DXY could stabilize or firm if core PCE surprises, while a soft print may rekindle cut expectations and weigh on the dollar.
Technical approach:
- DXY broke the descending trendline and retested the key resistance at around 98.60. The index is around EMA21, and it is awaiting an apparent breakout to determine the upcoming trend.
- If DXY breaks above EMA21 and key resistance at 98.60, the index may retest the following resistance at 100.
- On the contrary, failing to close above 98.60 may lead the index to retest EMA78 or the following support at around 97.15.
Analysis by: Dat Tong, Senior Financial Markets Strategist at Exness

SNB holds interest rates, US GDP revised higher, Swissy slips The Swiss franc is sharply lower on Thursday. In the North American session, USD/CHF is trading at 0.8013, up 0.78% on the day.
The Swiss National Bank held its benchmark rate at zero earlier today. The decision was widely expected. The Swiss franc has fallen sharply today but that is more likely due to the surprising strong US GDP release, rather than the SNB rate cut.
The SNB statement noted that inflation had remained virtually the same in the second quarter and the inflation outlook called for little change. However, members expressed concern about the slowdown in global economic growth and the uncertainty over US tariffs.
The statement said that the Swiss economy had been affected by the US tariffs, dampening the export sector. In particular, the machinery and watchmaking industries had been hit, but the impact on the services sector had been limited.
Switzerland has been hit with massive tariffs of 39% on Swiss goods, and the statement warned that the economic outllook for the country remains "uncertain".
Third-estimate GDP climbed to 3.8% in the second quarter, a strong improvement from the 3.3% gain in the second estimate. This was above the consensus of 3.3%. The gain was driven by stronger consumer spending and a sharp decline in US imports.
The tariffs continue to create uncertainty and could dampen consumer spending as the price of imports rise. There are concerns that GDP will fall significantly in the second half of the year.
The Federal Reserve signaled at last week's meeting that it planned to cut rates twice more before the end of the year, but today's strong GDP data lowers the pressure on the Fed to ease policy. The markets have priced in an October rate cut at 88%, according to CME's FedWatch.

BTC | 111k holds: tactical long bias, eyes on 113.1k__________________________________________________________________________________
Market Overview
__________________________________________________________________________________
BTC is consolidating above 111,040, trapped in a tight range with a higher‑timeframe bullish bias, while intraday remains pressured below 113,129. The 111k area acts as the market’s key pivot. 🔁
Momentum: Range with bullish tilt 📈 — higher TFs positive (1D/12H), intraday needs a reclaim above 113,129.
Key levels:
• Resistances (TF): 113,129–114,384 (240/1D, immediate ceiling), 117,900 (1D, upper cap).
• Supports (TF): 111,040 (240/1D, major pivot), 110,440 (intraday), 107,255 (1D).
Volumes: Normal on daily; moderate on 4H/30m downside pushes — no standalone catalyst.
Multi-timeframe signals: 1D/12H/6H bullish, 4H/2H/1H mixed-to-bearish below 113,129; a reclaim/hold > 113,129 opens 114,384.
Risk On / Risk Off Indicator: NEUTRAL BUY (stronger on 15m) — confirms the range‑bullish bias and favors buy‑the‑dip above 111k.
__________________________________________________________________________________
Trading Playbook
__________________________________________________________________________________
Strategic stance: higher‑timeframe uptrend, prefer tactical longs above 111,040. 🎯
Global bias: NEUTRAL BUY while 111,040 holds; key invalidation on a close below 111,040 (align TF to your horizon).
Opportunities:
• Defensive long: bullish reaction confirmed above 111,040; add on break/hold > 112,300 then > 113,129.
• Breakout long: close and hold > 113,129 (30m/15m ≥ 2 bars) to target 114,384.
• Tactical sell: clean rejection at 112.9k–113.1k with selling volume, target a pullback to 111,040 (reduced size vs HTF filter).
Risk zones / invalidations:
• A confirmed loss of 111,040 → increases risk toward 110,440 then 107,255.
• Reclaim & hold > 113,129 → negates intraday pressure and unlocks 114,384.
Macro catalysts:
• Fed: -25 bps cut with dovish guidance — medium‑term risk support, validates buy‑the‑dip.
• Dollar (DXY): bounce risk — near‑term headwind, argues for staged entries.
• ETF flows: recent modest inflows, neutral‑to‑slightly constructive — not a trigger but doesn’t cap the technical upside.
Action plan:
• Entry: 111,300–111,500 on re‑acceptance/HL confirmation (15m/30m); add if holding > 112,300 then > 113,129.
• Stop: 110,850 (below swing & S1).
• TP1: 112,950; TP2: 113,129–113,300; TP3: 114,300–114,400.
• R/R: ≈ 2.0–2.5x depending on execution and adds.
__________________________________________________________________________________
Multi-Timeframe Insights
__________________________________________________________________________________
Overall, higher timeframes lean bullish while lower timeframes remain pressured until 113,129 is reclaimed. 🧭
1D/12H/6H: Bullish bias while holding 111,040; clearing 113,129 then 114,384 would enable compression toward 117,900.
4H/2H/1H/30m/15m: Intraday pressure below 113,129, moderate volume on sell pushes; dip‑buys near 111,040 remain preferred as long as the pivot holds.
Key divergences: HTF Up vs LTF Down → favors “buy the dip” at support, confirmed by volume and reclaim of prior caps (112,300 → 113,129).
__________________________________________________________________________________
Macro & On-Chain Drivers
__________________________________________________________________________________
Macro backdrop is modestly supportive (dovish Fed), but a dollar bounce could cap near‑term rallies; ETF flows are constructive but not decisive. ⚖️
Macro events: Fed -25 bps and still‑dovish dot plot support risk; a technical DXY bounce remains a short‑term counterweight.
Bitcoin analysis: Defending ~111k near the 100D; gradual recovery toward the 50D plausible if 113,129/114,384 are reclaimed; institutional/ETF tone mildly positive.
On-chain data: Not provided — technicals and flows drive the lens.
Expected impact: Macro is broadly risk‑friendly, but execution should be paced under resistance; prefer staged entries above 111k.
__________________________________________________________________________________
Key Takeaways
__________________________________________________________________________________
BTC is ranging above 111,040 with a higher‑timeframe bullish bias and intraday headwinds below 113,129.
- Trend: bullish in HTF, neutral/paused intraday until 113,129 is reclaimed.
- Setup: buy the dip above 111,040, then add on breakout > 113,129 toward 114,384.
- Macro: Dovish Fed supports the case, while a firm DXY can slow upside.
Stay nimble: watch 111,040 defense and the 113,129 reclaim to trigger the next leg.

Fed Cut Hopes & Geopolitical Risks Fuel Gold Rally📊 Market View
Gold is holding its bullish tone, trading firmly above 3750 USD/oz and refreshing daily highs in the European session. Investor sentiment is being lifted by rising expectations that the Federal Reserve will continue rate cuts into year-end, lowering borrowing costs and strengthening demand for non-yielding assets like gold. Meanwhile, geopolitical risks keep safe-haven flows alive, further reinforcing gold’s momentum.
🔎 Technical Analysis (H1/H4)
Price structure remains bullish above 3750, supported by trendline dynamics.
Buy liquidity zones identified at 3742–3740 (major demand) and 3757–3755 (scalp entry).
Key short-term resistance sits around 3778, with extended liquidity targets towards 3813–3815.
A rejection from the 3813–3815 sell zone could trigger pullbacks into demand areas.
🔑 Key Levels
Resistance: 3778 ➡️ 3813–3815
Support / Buy Zones: 3757–3755 ➡️ 3742–3740
📈 Scenarios & Trading Plan
✅ BUY ZONE (Main Setup): 3742–3740
SL: 3735
TP: 3748 ➡️ 3752 ➡️ 3756 ➡️ 3760 ➡️ 3770 ➡️ 3780 ➡️ …
✅ BUY SCALP (Aggressive Entry): 3757–3755
SL: 3750
TP: 3762 ➡️ 3766 ➡️ 3780 ➡️ …
✅ SELL ZONE (Liquidity Trap): 3813–3815
SL: 3820
TP: 3810 ➡️ 3805 ➡️ 3800 ➡️ 3795 ➡️ 3790 ➡️ 3780 ➡️ …
⚠️ Risk Management Notes
Watch for fake breakouts near 3813–3815 — liquidity sweeps are common before reversal.
Prioritize long entries on confirmed pullbacks, avoid chasing price in the middle range.
Keep position sizing modest as volatility could spike on Fed commentary or geopolitical updates.
✅ Summary
Gold remains in a strong bullish phase, fueled by Fed rate cut expectations and geopolitical tensions. Strategy: buy dips at 3757–3755 or 3742–3740, targeting 3770–3780, while watching for short-term rejection at 3813–3815 for potential sells.
📢 Follow MMFLOW TRADING for live intraday updates, liquidity-based trading setups, and high-probability strategies on XAUUSD.

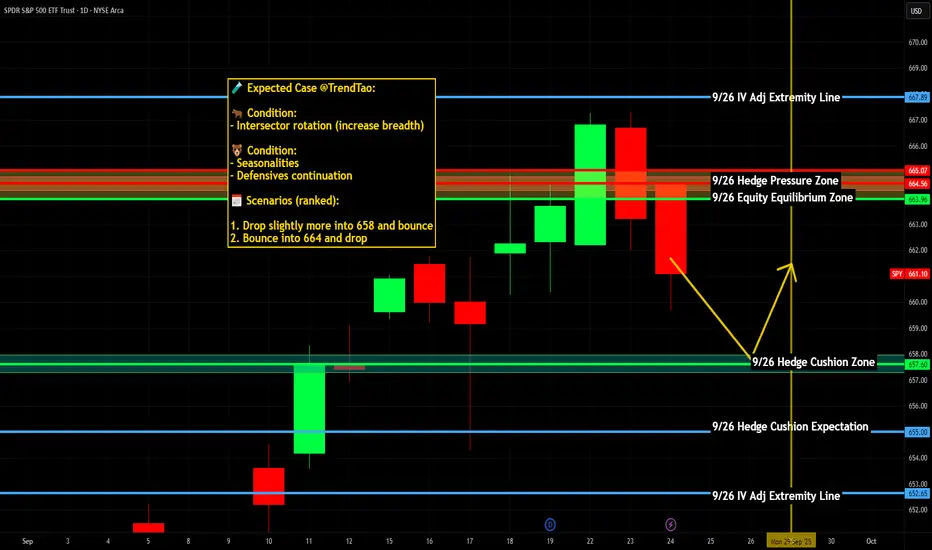
$SPY / $SPX Scenarios — Thursday, Sept 25, 2025🔮 AMEX:SPY / SP:SPX Scenarios — Thursday, Sept 25, 2025 🔮
🌍 Market-Moving Headlines
📉 Data-heavy morning: Multiple macro releases hit at 8:30 AM, setting tone across bonds, USD, and equities.
💬 Fed chorus: Packed lineup of Fed speakers keeps policy narrative in focus.
💻 Tech + rates tension: AMEX:XLK flows remain sensitive to bond yield direction post-FOMC.
🛢️ Energy lens: Oil volatility continues to act as an inflation wildcard.
📊 Key Data & Events (ET)
⏰ 🚩 8:30 AM — Initial Jobless Claims (weekly)
⏰ 🚩 8:30 AM — GDP (Q2, third estimate)
⏰ 🚩 8:30 AM — Durable Goods Orders (Aug)
⏰ 10:00 AM — Existing Home Sales (Aug)
🗣️ Fed Speakers:
• 8:20 AM — Austan Goolsbee (Chicago Fed)
• 9:00 AM — John Williams (NY Fed) & Jeff Schmid (Kansas City Fed)
• 10:00 AM — Michelle Bowman (Fed Vice Chair for Supervision)
• 1:00 PM — Michael Barr (Fed Gov.)
• 1:40 PM — Lorie Logan (Dallas Fed)
• 3:30 PM — Mary Daly (San Francisco Fed)
⚠️ Disclaimer: Educational/informational only — not financial advice.
📌 #trading #stockmarket #SPY #SPX #GDP #joblessclaims #durablegoods #housing #Fed #Powell #Dollar #bonds #megacaps
BTC: Defend 111.6k, confirm > 113,050 → 114,472__________________________________________________________________________________
Market Overview
__________________________________________________________________________________
BTC sits on a defended HTF support while an intraday ceiling caps any extension. The bias stays cautiously bullish as long as 111,800–111,600 holds, but a confirmed reclaim above 113,050 is still needed.
Momentum: Fragile bullish range 📈 — buyers hold 111,800–111,600, yet 113,050 keeps a lid on price.
Key levels:
- Resistances (2H–1D): 113,050 (intra cap), 114,472 (HTF pivot), 116,200–117,300 (extension).
- Supports (HTF→intra): 111,800–111,600 (major 240 PL), 111,150 (intra), 107,286 (D PL).
Volumes: Very high on 30m/15m (potential reversal fuel), normal on 4H–1D.
Multi-timeframe signals: 1D/12H/6H/4H/2H trend Up; 1H still Down; 30m/15m trying to turn — reclaim of 113,050 with persistence is the key.
Risk On / Risk Off Indicator: NEUTRAL BUY (moderate risk-on) — supportive but not decisive; on very short TFs (15m) it tilts toward STRONG BUY if the breakout confirms.
__________________________________________________________________________________
Trading Playbook
__________________________________________________________________________________
Core stance: favor defensive buys at support or strength buys on confirmed breakouts, with a clear invalidation below 111,600.
Global bias: Moderately bullish (NEUTRAL BUY) while 111,600 holds; invalidation on a confirmed close < 111,600.
Opportunities:
- Buy-the-dip: Buy 111,800–111,600 on clean rejection + confirmation; target 114,000 then 114,472.
- Breakout buy: Buy a reclaim > 113,050 with a held retest; add > 114,472 if volume expands.
- Tactical sell: Fade clean rejections at 113,050–114,472 or a confirmed break < 111,600.
Risk zones / invalidations: A loss of 111,600 opens 111,150 then 107,286; failure to reclaim 113,050 over 2–3 bars weakens the bullish case.
Macro catalysts:
- Fed (25 bps cut, dovish tilt): supportive backdrop, but price must confirm.
- Spot ETF flows softening: headwind for breakouts near resistance.
- Geopolitics (Ukraine/Syria): headline risk — demand confirmation before sizing up.
Action plan:
- Entry: 111,850–111,600 (confirmed rejection) or > 113,050 (break & retest).
- Stop: below 111,150 (dip-buy) or below 112,400 (post-break).
- TP1/TP2/TP3: 114,000, 114,472, 116,217 (leave a runner toward 117.9k if momentum builds).
- R/R: ~1.8–2.5R depending on entry and breakout validation.
__________________________________________________________________________________
Multi-Timeframe Insights
__________________________________________________________________________________
Higher timeframes remain constructive while execution TFs need a reclaim of 113,050 to realign.
1D/12H/6H/4H/2H: Bullish structure while 111,800–111,600 holds; a reclaim of 113,050 unlocks 114,472 then 116,200–117,300.
1H: Still capped under 113,050/114,472; needs a close above to neutralize local supply.
30m/15m: Very strong volumes and intraday risk-on support a bounce attempt; confirmation requires a persistent hold above 113,050.
Confluences/divergences: Bullish confluence = HTF support + MTF Up + moderate risk-on; key divergence = 1H still Down, raising fake-break risks without persistence.
__________________________________________________________________________________
Macro & On-Chain Drivers
__________________________________________________________________________________
Macro is slightly supportive (more accommodative Fed) but tempered by soft spot flows and elevated geopolitics — hence the need for technical confirmation.
Macro events:
- Fed: 25 bps cut with a data‑dependent tone — structurally supportive, not an automatic upside trigger.
- Geopolitics: elevated risks (Ukraine/Syria) that can boost volatility and cap rallies at resistance.
- Spot ETFs: recent soft flows — a tactical headwind into nearby ceilings.
Bitcoin analysis:
- Supply remains active under 113k; demand is defended at 111,800–111,600 (HTF), with a broader demand area near 109k/107,286 if it breaks.
- Derivatives: elevated options OI into the 26/09 expiry; “max pain” near 110k — can magnetize price if breakouts fail.
On-chain data:
- Comfort threshold ~115.2k (~95% of supply in profit): above it momentum sustains; below it risks an oscillation inside 105.5k–115.2k.
Expected impact:
- Slight rebound edge (NEUTRAL BUY), but proof via price is required: above 113,050/114,472 the macro tailwind can play; otherwise expect range and head-fakes.
__________________________________________________________________________________
Key Takeaways
__________________________________________________________________________________
Range-bound but constructive above a key HTF support.
- Overall trend: conditionally bullish with a 113,050–114,472 ceiling.
- Most relevant setup: defensive buys at 111,800–111,600 or strength buys only after a confirmed reclaim > 113,050.
- Key macro factor: the recent Fed cut improves the risk backdrop, but soft flows/headlines require price confirmation.
Be patient: demand a clean signal (break + retest + volume) before sizing up. 👀

FOMC 100% Breakout (Check) - Key Resistance and 6500 Gamma PinFOMC was in fact a NOISE candle
So I measured the candle, projected a 100% breakout bullish and bearish
Bulls took the bait and ran higher, but still resistance @ 6700 seen today and hopefully
a short-term window to see a bit of a slide lower into some technical levels
EMA support levels
-watching the 21 period daily EMA
-watching the 50 period daily EMA
6550 FOMC candle lows from last week
6500 Gamma Pin with JP Morgan's quarterly collar trade
This is the first day in several weeks where I've seen some actual follow through
in negative gamma option flows
If futures grinds prices lower, the cascade may take hold and we can see a 100-200 point
selloff quickly in the S&P
I still like scooping up premium and buying the dips, but hopefully at more attractive levels
like 4-5% lower or even 8-10% lower
Let's see how it plays out. I'll be in the markets grinding per usual.
Thanks for watching!!!

BTC: Bullish range below 114,472, 111,809 remains key__________________________________________________________________________________
Market Overview
__________________________________________________________________________________
BTC is holding a constructive 110k–115k range after rejection below 117k, with buyers defending 111,809 and supply capping under 114,472–116,217. The HTF trend remains intact, but breakouts need volume confirmation.
Momentum: 📈 Bullish-in-range — building above 111,809, but capped until 114,472 breaks.
Key levels:
- Resistances (4H/12H): 114,472; 116,217–117,966; 124,278 (W).
- Supports (4H/1D): 111,809; 110,000; 107,286–107,299 (1D).
Volumes: Very high on 1H/30m (pivot validation), normal on 1D — acts as a breakout catalyst.
Multi-timeframe signals: 1D/12H trend up; 6H/4H “neutral buy” below 114,472; 2H/1H recovering; 30m/15m impulsive but close to resistance.
Risk On / Risk Off Indicator: NEUTRAL BUY (STRONG BUY on 15m) → moderate long bias, consistent with momentum while 111,809 holds.
__________________________________________________________________________________
Trading Playbook
__________________________________________________________________________________
Strategy context: HTF trend is bullish, range in play; favor tactical longs while 111,809 holds and fade clean rejections below 116,217.
Global bias: NEUTRAL BUY above 111,809; invalidation if daily close < 111,809.
Opportunities:
- Range long: re-accumulate 112.05k–112.3k if 111,809 holds cleanly; add on break & hold > 114,472.
- Breakout: buy the close and successful retest > 114,472 targeting 116,217 then 117,966.
- Tactical short: sell a clear rejection at 114,472/116,217 (wick + volume), manage tight and take profits fast.
Risk zones / invalidations: A confirmed loss of 111,809 reopens 110k then 107,286 (bull bias invalid). A 12H/1D close > 116,217 invalidates fade shorts.
Macro catalysts (Twitter, Perplexity, news):
- Powell’s speech: potential trigger for break or fakeout.
- US PMIs: can spark the 114,472 break or a rejection.
- Hard assets strong (gold at records) and oil lower: mixed “inflation/sentiment” that shapes risk appetite.
Action plan:
- Long (range/break): Entry 112.05k–112.3k or > 114,472 / Stop 111,650 / TP1 114,472, TP2 116,217, TP3 117,966 / R:R ~2–3.
- Short (tactical): Entry 114.3k–114.5k (rejection) / Stop 114,800 / TP1 113.1k, TP2 111,809 / R:R ~1.5–2 (reduced size).
__________________________________________________________________________________
Multi-Timeframe Insights
__________________________________________________________________________________
Overall, HTFs (1D/12H) stay bullish, while LTFs rebound but still face nearby resistance.
1D/12H: Uptrend above 111,809 and 107,286 pivots; reclaim of 114,472 would open 116,217 then 117,966 with volume confirmation.
6H/4H: “Neutral buy” below 114,472; active range 111,809–114,472; a close > 114,472 should target 116,217.
2H/1H: Ongoing rebound, strong 1H volumes at the pivot; need a close > 114,472 to convert into impulse.
30m/15m: Intraday impulse (strong risk-on on 15m) but immediate friction at 114,472; beware fake breaks without a successful retest.
__________________________________________________________________________________
Macro & On-Chain Drivers
__________________________________________________________________________________
Macro is mixed: Fed speak and PMIs are in focus, hard assets strong and oil easing — likely to polarize breaks on the key technical levels.
Macro events: Powell can trigger a break/reversion; US PMIs may add volatility; record gold and softer oil adjust the “inflation/sentiment” lens.
Bitcoin analysis: 110k–115k range with 117–117.5k rejection; the 112k–110k support cluster is pivotal to preserve the structural bull bias.
On-chain data: Not provided here — no actionable on-chain extremes mentioned in this set.
Expected impact: If Powell/PMIs validate risk-on, a close > 114,472 should extend to 116,217–117,966; otherwise, expect a return to 111,809 then 110k.
__________________________________________________________________________________
Key Takeaways
__________________________________________________________________________________
BTC trades a bullish range above a key pivot while dense resistance sits overhead.
- Trend: moderately bullish while 111,809 holds; need a close > 114,472 to re-ignite upside.
- Prime setup: buy the defense of 111,809 or the break & hold > 114,472, aiming 116,217 then 117,966.
- Macro: Powell/PMIs can trigger the break or produce intraday traps.
Stay disciplined: wait for close-and-retest confirmations to size up, and de-risk quickly if macro flow contradicts the signal.

GBP/USD Setup: Breakout or Fakeout at 1.3600 Key Level?🔎 Technical Analysis
On the daily chart, GBP/USD is trading around 1.3550 after rejecting the dynamic support of the ascending channel. The key resistance lies at 1.3600. A daily close above this level could open the way towards 1.3700–1.3750, a strong supply zone. RSI remains in consolidation, far from extremes, suggesting more room for upside.
Scenarios:
Bullish: Break above 1.3600 → target 1.3700–1.3750.
Bearish: Rejection below 1.3500 → retracement to 1.3400, extension to 1.3280.
📊 COT Report
USD Index (CFTC 09/09/2025): Non-commercials added +5.5K longs and +6K shorts, net short remains dominant → slightly weak USD bias.
British Pound: Non-commercials trimmed longs (-1.2K) and shorts (-748), but commercials added massive longs (+66K) → long-term bullish hedging on GBP.
👉 Overall: GBP supported, USD weak → bullish bias for GBP/USD.
📅 Seasonality
September historically shows a neutral/slightly bearish tendency for GBP/USD (-0.3% average over 20 years). The 2-year model suggests a mid-September drawdown followed by recovery in October.
👉 Mixed bias: short-term weakness possible, but October seasonality favors GBP strength.
🧠 Retail Sentiment
63% short vs 37% long.
Retail is heavily short – a classic contrarian signal, pointing towards a possible upside liquidity grab above 1.3600–1.3700.
📌 Trading Plan
Primary bias: Bullish above 1.3500 targeting 1.3700–1.3750.
Confirmations: COT favors GBP, retail short, bullish technical structure.
Risks: September seasonality slightly bearish → potential pullback to 1.3450 before resuming higher.

EUR/USD Breakout Incoming? COT & Sentiment Point to 1.1850COT Report (09/09/2025)
EUR (Euro FX CME): Non-Commercials increased longs (+2,389) and reduced shorts (-3,696) → bullish bias.
USD (US Dollar Index): Non-Commercials remain net short (24,750 vs 19,192 longs). Slightly bearish bias on the dollar.
👉 The combination suggests a favorable context for Euro strength against USD.
📊 Seasonality
September is historically flat or slightly negative for EUR/USD, but over the last 5 years seasonality shows a recovery in the second half of the month.
👉 This reinforces the idea that downside risk is limited and that pullbacks may offer long opportunities.
🧠 Sentiment
Retail traders: 74% short, only 26% long.
Classic contrarian signal: retail is short, which supports a long bias.
📉P rice Action & Technicals (H1/D1/W1)
Price is moving inside a daily ascending channel (uptrend in progress).
Key resistance: 1.1800 – 1.1850 (weekly supply cluster).
Main support: 1.1650 – 1.1600 (daily demand zone, RSI reacted).
Daily RSI above 50 → positive momentum, not overbought.
✅ Operational Summary
EUR/USD shows a favorable context (fundamentals + COT + sentiment) supporting the upside.
Technical structure favors a test of 1.1850 resistance.
Best strategy: look for long entries on pullbacks or breakouts, with invalidation below 1.1650.

New US visa policy urged gold to reach another record high againGold prices surged following the announcement of a new H-1B visa policy, which includes a tenfold fee increase, sparking concerns over a further weakening of the labor market. Concurrently, the recent decline in the US dollar index, driven by mounting expectations of a Fed rate cut, has increased the appeal of non-yielding assets, lending further support to gold.
From a technical perspective, XAUUSD has surpassed the 3700 resistance level and is now advancing towards the next resistance at 3800. The expansion of the EMAs (21,78) indicates strong bullish momentum.
Should XAUUSD break above the 3800 level, it could proceed to test the subsequent resistance at 3900. Conversely, a reversal could see XAUUSD retest the 3700 support level.
By Van Ha Trinh - Financial Market Strategist at Enxess

CADJPY Breakdown Incoming? Specs Selling CAD, Buying JPY1. Retail Sentiment
68% long vs 32% short → The majority of retail traders are positioned long.
From a contrarian perspective, this increases the risk of a downside move to flush out these long positions.
2. Seasonality
JPY (September): historically tends to appreciate from mid-month onward.
CAD (September): historically weak, with flat to negative performance.
Seasonal Bias: favors strong JPY / weak CAD → bearish CADJPY outlook.
3. Commitment of Traders (COT)
CAD (Sept 16, 2025):
Non-commercials: still heavily net short (128k short vs 21k long).
Commercials: strong long exposure (218k), but speculative flows remain bearish.
Bias: CAD continues to be sold by speculators → bearish pressure.
JPY (Sept 16, 2025):
Non-commercials: net long (161k long vs 100k short).
Commercials: strong shorts (163k), as usual for hedging.
Bias: speculators are accumulating JPY longs, reinforcing strength.
👉 COT View = Weak CAD, Strong JPY → Bearish confirmation for CADJPY.
4. Technical Analysis
Current price: 106.77, trading inside the daily demand zone (106.50–106.00).
Structure:
Well-defined descending channel.
Multiple bounces in the 106.00–106.20 area → key support zone.
RSI neutral, not yet oversold.
Scenarios:
Scenario A (probable): break below 106.20 → extension towards 105.50, then 104.80 (swing low zone).
Scenario B (alternative): technical bounce from demand (106.20–106.00) → recovery towards 107.80/108.00 (weekly supply).
✅ Conclusion: CADJPY shows a bearish setup supported by COT, seasonality, and contrarian sentiment. The technicals highlight a descending channel with potential breakdown below 106.00. Best setups: short on pullbacks with targets at 105.50–105.00.

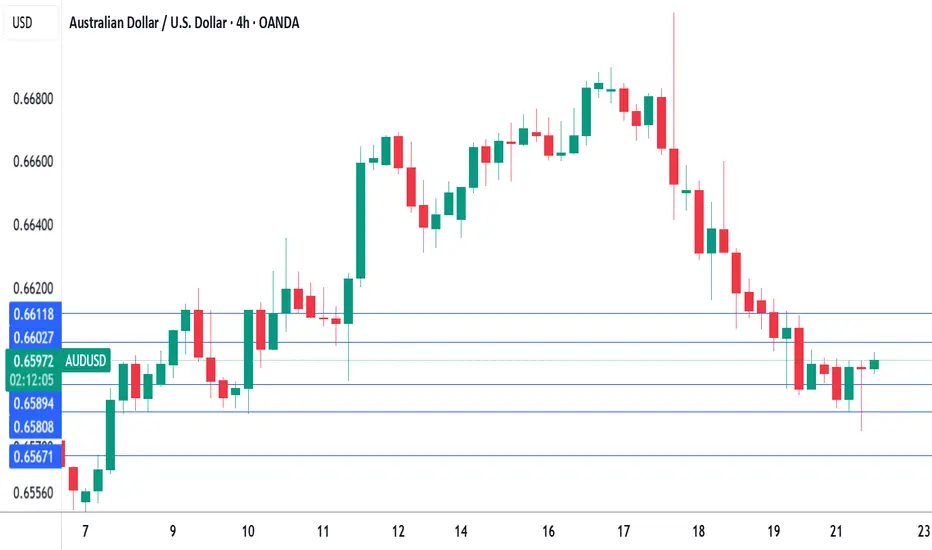
RBA's Bullock says inflation under control, Aussie steadyRBA Governor Bullock testified before a parliamentary committee on Monday. Bullock said that inflation was in a "very good position" as higher interest rates had curbed demand. Still, she warned that there inflation risks remained on "both sides".
Bullock was less positive about the geopolitical environment, warning that the significant change in the global trading system which had created massive uncertainty. The Reserve Bank was particularly concerned about the impact of US tariffs on China, Australia's largest trading partner.
Bullock warned that the financial markets had not priced in the risks of the tariffs, which could affect financial stability if the the domstic economy was significantly affected by the tariffs.
The RBA is expected to hold the cash rate at 3.6% at next week's meeting, after lowering rates by a quarter-point in August. The markets have priced in a 10% likelihood of a rate cut at the upcoming meeting, with an 86% likelihood of a cut in November.
There are no US economic releases today but investors will be keeping a close eye on Fedspeak, with five FOMC members scheduled to deliver public remarks. New Fed Governor Miran, who voted for a 50-bp cut at the September 17 meeting, is expected to give a detailed explanation of his view in today's speech.
At last week's meeting, the Fed signaled that more rate cuts were coming and the markets have priced in an October cut at 90%, according to CME's FedWatch. The Fed appears to have shifted to a more dovish stance after maintaining rates since December 2024 until lowering rates last week.
AUDUSD tested support at 0.6589 and 0.6580 earlier. Next, there is support at 0.6567
There is resistance at 0.6602 and 0.6611
Macro Stress Test for Bitcoin: Short-Term Scalps or Swing Awaits__________________________________________________________________________________
Market Overview
__________________________________________________________________________________
Bitcoin just experienced a violent flush toward its structural support (111,900–112,000) amid extreme intraday volatility. Downside has been aggressive, but core trend signals and volume dynamics hint at a potential technical reversal.
Momentum : Neutral-bullish 📈 — Price action is anchored above 112,000, despite recent capitulation, with MTFTI remaining "Up" across all relevant timeframes.
Key Levels :
Resistances :
— 116,200/117,000 (1D/12H), major cluster/weekly pivot
— 114,200/114,400 (12H/6H/4H), tactical zone for initial rebounds
Supports :
— 111,900–112,000 (all TFs), structurally central platform
— 110,900/111,200 (4H/2H), secondary defense to watch if breakdown occurs
Volumes : Very high on 1H/30min/15min ⚡️— Clear signs of capitulation at support, technical bounce potential (short squeeze) activated.
Multi-Timeframe signals : MTFTI reads "Up" from 1H to 1D, IGV/SPY (Risk On / Risk Off Indicator) is "Neutral Buy" (moderately positive), all confirming strength of support at 112,000. Only high-level macro dashboard signals remain defensive.
Risk On / Risk Off Indicator : Neutral Buy bias — Recent stabilisation and moderate equity outperformance warrant a constructive view for tactical longs, though macro caution persists.
__________________________________________________________________________________
Trading Playbook
__________________________________________________________________________________
Current conditions are defined by a sharp flush but a directional "buy the dip" bias persists while MTFTI aligns positively.
Global bias : Neutral-long — valid as long as 111,900–112,000 holds; invalidation on clean breakdown with sustained volume.
Opportunities :
— Tactical long/scalp on a confirmed bounce >112,000, add if 112,800 breaks, TP1 = 112,800, TP2 = 113,500.
— Small short only if explosive breakdown <111,900 with confirming volume; TP1 = 111,500, TP2 = 111,200.
Risk zones / invalidations : Any close below 111,900 without rapid buying flips the bias bearish; failed bullish engulfing/test nullifies the long tactic.
Macro catalysts :
— Fed begins an easing cycle as US jobs deteriorate/geopolitical risk rises; global liquidity (M2) still provides a tailwind.
— Institutional BTC flows ("whale withdrawals", ETFs/funds) build above 115.2k, as long as on-chain base holds.
— No major top signal; backdrop remains “risk-on/risk-off” but favors a tactical bounce.
Action plan :
Enter partial size above 112,000 on valid signal; stop <111,800; TP1 = 112,800, TP2 = 113,500; R/R ≈ 2.5 – scale out at resistance, manage dynamically on confirmation/failure.
__________________________________________________________________________________
Multi-Timeframe Insights
__________________________________________________________________________________
Price reacts tightly at 111,900/112,000, with core structure defended on all major time frames.
1D/12H/6H: Higher timeframes hold structure above 112,000, with liquidations targeting this support. "Buy the dip" playbook intact if level is defended.
4H/2H/1H: Extreme volume concentration and volatility, sellers pressured to exhaust; favor a quick bounce if buying appears immediately.
30min/15min: IGV/SPY (Risk On / Risk Off Indicator) prints "STRONG BUY" and ISPD DIV "BUY" — strong micro support for scalps/short-term longs.
Divergences: Confidence for a swing long only resumes after a confirmed reclaim of 112,800; clean break of 111,900 exposes further downside risk.
__________________________________________________________________________________
Macro & On-Chain Drivers
__________________________________________________________________________________
Macro context remains tense despite strong global liquidity; absence of massive on-chain outflows remains key.
Macro events : US jobs data weaken, geopolitical risks (NATO/Ukraine/Syria) rise, Fed kicks off easing, but all-time high global M2 supports risk assets.
Bitcoin institutional flows : Strategic accumulation is visible (whale withdrawals, ETF inflow), no signs of euphoria/top; 115.2k–116k base is the critical pivot for breakout or renewed correction.
On-chain data : With 95% of supply in profit >115.2k, on-chain resilience persists unless 111,900 breaks; major vulnerability accompanies loss of this support.
Expected impact : 111,900–112,000 offers a prime tactical entry if macro liquidity endures and on-chain flows stay supportive; a fast bounce is plausible.
__________________________________________________________________________________
Key Takeaways
__________________________________________________________________________________
The market is caught between violent short-term capitulation and persistent bullish undertones.
Despite the intense technical flush, the higher timeframe trend (MTFTI) still favors a tactical long/scalp stance while 111,900–112,000 is defended. The most actionable setup is a rapid rebound from extreme signals, while swing longs require confirmation above 112,800 and macro risk remains high. Robust on-chain support plus global liquidity create a narrow but real window for technical opportunity — but any significant breakdown should prompt defensive positioning.
Stay nimble and ready to react to confirmation or risk escalation.

EUR/USD: Outlook, Catalysts and Q4 2025 Forecast 🔮✨EUR/USD: Outlook, Catalysts and Q4 2025 Forecast
💵 🎯 Q4 2025 Forecast & Range
• Base-case: EUR/USD around $1.18–1.22 in Q4 2025, drifting toward ~1.20 by year-end.
• Bull case: Faster US slowdown, Fed cuts, euro resilience → test 1.25+.
• Bear case: Fed stays hawkish, euro weakens → drop toward 1.15 (with risk down to 1.10–1.12).
Upside scenario 🚀: Fed cuts early, ECB steady, risks ease. EUR/USD breaks 1.20, retests 1.22–1.25 zone, option gamma squeezes add momentum.
Downside scenario ⚠️: US data strong, Fed stays sticky, crisis drives safe-haven USD. EUR/USD drops below 1.15 → targets 1.10–1.12.
On balance: Technicals & positioning favor base/bull outcome. EUR/USD above DMA cluster, sentiment allows more upside. Break >1.18 turns 1.20 into support, opens 1.22–1.25 zone. Invalidation = sharp drop below 1.15.
Core thesis: The EUR/USD appears set for a higher range into late 2025 as U.S. dollar exceptionalism fades 💵➡️💶. Markets price a Fed pivot – several rate cuts penciled in by early 2026 – against an ECB that is nearly done easing. That narrows the US–EU rate gap and should weaken the dollar 📉. At the same time, softer US growth/inflation and global portfolio shifts away from US assets may further tilt the balance toward the euro 🌍. Conversely, any U.S. data surprises or policy hiccups could bolster the greenback ⚡. Our baseline view sees EUR/USD around 1.18–1.22 in Q4 2025, roughly mid‐range of consensus forecasts 📊.
📉 EUR/USD daily chart (2023–2025) with key support at ~1.15 and resistance near 1.18–1.20. The pair has traded in a ~1.14–1.18 range since early 2025. A decisive break above 1.18 could target ~1.20–1.22 upper trendline, while a drop below 1.15 might reopen ~1.10.
________________________________________
🔍🌐 Macro & Policy Drivers
• 💡 Fed vs. ECB monetary policy (10/10): By late 2025 the Fed is widely expected to start cutting rates possibly two 25bps cuts in Q4 2025, terminal ~3.5% by 2026, whereas the ECB has nearly finished its easing cycle. A shrinking interest gap ECB depo ~1.75%, Fed funds ~3.5% supports the euro. In short, Fed pivot = USD softening.
• 📊 US economic momentum (9/10): Any further slowdown or disinflation in the U.S. will prompt Fed easing sooner, undermining the dollar. Conversely, surprisingly strong US data inflation above target, resilient GDP/jobs could keep rates higher longer, capping EUR/USD gains.
• 🇪🇺 Eurozone fundamentals (8/10): Europe’s recovery – aided by lower energy costs – is improving. Eurozone GDP is running around ~1–1.5% and inflation is near target, so the ECB likely pauses on cuts. Any signs of renewed growth or fiscal stimulus in the EU e.g. German budget support would bolster EUR. On the other hand, fresh euro-area weakness or political instability could dent the euro.
• 🏛️ US political/fiscal factors (7/10): Trade and tax policy continue to influence flows. A reported US–China tariff “ceasefire” has already eased pressure on global trade, but any renewed tariff battles could renew safe-haven USD demand. Meanwhile, US fiscal pressures debt ceiling fights, deficit spending or threats like Section 899 taxing foreign holders of US assets could undermine confidence in the dollar.
• ⚔️ Geopolitical risks (6/10): War and geopolitical events tend to drive safe-haven flows. For example, any de-escalation in Ukraine/Middle East risk would remove a bid under USD and help EUR. Conversely, a severe global shock or “risk-off” event e.g. new conflict could rerate USD up.
• 📅 Seasonality & flows (4/10): Historically, EUR/USD often sees end-of-year inflows year-end rebalancing and sometimes a modest Q4 rally. Some seasonal analyses note late-November/December strength institutions locking in positions. Weaker USD around year-end if it materializes would amplify this.
• 📉 Options and positioning (4/10): Large options strikes and dealer hedging can accentuate moves. For example, heavy call skew on EUR/USD tends to make gains self-reinforcing via delta-hedging. Conversely, if open interest clusters into puts at key levels, dips could be cushioned.
________________________________________
📈🧭 Technical Roadmap
EUR/USD is currently in a multi-month range ∼1.14–1.18. The recent price action shows anchored VWAPs and moving averages 20/50/100-DMA ≈1.153–1.168 converging in that band.
• 🚀 Resistance: Clear supply sits ~1.18–1.18 top of range. A daily close above ~1.182 could trigger a move toward 1.20–1.22. Above 1.22, next fib-derived targets near ~1.25.
• 🛡️ Support: Immediate support is the 1.161 pivot 50-DMA and then ~1.153 100-DMA. A break below ~1.153 would expose ~1.147 and open 1.10–1.12 psychological and last year’s lows. Below ~1.10, USD strength could dominate.
• ⚡ Momentum: RSI and ADX are modest, implying the range could persist until a trigger. A bullish path would need clear Fed dovish hints to break out. A breakout could show the classic “impulse → pause → trend” rhythm.
________________________________________
🌀🤖 Advanced Models & Cycles
Quant techniques also point to a stronger euro ahead:
• Fourier-cycle analysis of FX data shows multi-month oscillations (~1–2 years). Mean-reversion cycles suggest the early-2025 USD bounce might flip into a euro-positive Q4.
• Neural-network/ML models trained on macro + technical inputs often flag Fed/ECB divergence and seasonality. Academic LSTM studies have shown strong results for EUR/USD direction forecasting.
________________________________________
🚀 Key Catalysts (Ranked 0–10) 🔑
• 🔟 Fed rate path: The timing/magnitude of Fed cuts is THE driver. Early or larger Fed cuts vs. ECB hold would lift EUR/USD.
• 🔟 U.S. economic data: Inflation surprises CPI, PCE and jobs/GDP data move expectations fast.
• 🔟 ECB stance: ECB rhetoric and inflation. Stability or hawkishness boosts EUR.
• 🟫 US political/fiscal moves: Trade policy, deficit fights, and Section 899 proposals could weaken USD.
• 🟩 Eurozone growth & policy: Strong EU growth or fiscal stimulus = bullish EUR. Severe slowdown = bearish EUR.
• 🟨 Geopolitical shocks: Escalation boosts USD; de-escalation helps EUR.
• 🟦 Energy/commodity prices: High oil hurts EU, boosts USD.
• 🟧 Seasonal flows: Q4 rebalancing often lifts EUR modestly.
• 🟪 Options positioning: Dealer hedging around strikes magnifies moves.
• ⬛ Euro-area politics: Local risks e.g. Italian budgets, German politics.
________________________________________
🏦📊 Analysts & Institutional Forecasts
• JP Morgan: ~1.20 by Q4 2025, ~1.22 mid-2026.
• ING: ~1.20 end-2025, ~1.22 in 2026.
• UBS: 1.21 end-2025, 1.23 mid-2026.
• Morgan Stanley: ~1.25 by Q2 2026 bull case 1.30.
• Goldman Sachs: ~1.20 (12M).
• Consensus: ~1.15 reflecting caution if Fed cuts are delayed.
Summary: The prevailing view is a weaker dollar into 2026. Most big banks have upgraded EUR/USD targets since 2024. Consensus for Dec 2025 clusters 1.15–1.25, with top banks leaning 1.20+.

Bitcoin - Will Bitcoin Continue to Fall?!Bitcoin is currently below the EMA50 and EMA200 on the four-hour timeframe and is in its descending channel. In the event of an upward correction towards the specified supply zones, it is possible to sell Bitcoin with a better risk-reward ratio.
It should be noted that there is a possibility of heavy fluctuations and shadows due to the movement of whales in the market and capital management in the cryptocurrency market will be more important. If the downward trend continues, we can buy within the demand range.
Since early September, Bitcoin has shown a steady upward trend, largely fueled by expectations of a Fed rate cut at the FOMC meeting and optimism about its potential impact. When the Federal Reserve finally delivered the long-anticipated 0.25% rate reduction, Bitcoin declined by only about 1%. While the crypto market currently appears somewhat lackluster, the limited reaction can be viewed as a textbook example of the “buy the rumor, sell the news” dynamic.
The overall cryptocurrency market capitalization remains above $4 trillion. According to CoinMarketCap data, the average performance of the top 20 cryptocurrencies was negative 0.43% during the past week. Meanwhile, the Crypto Fear & Greed Index stands at a neutral level of 51, down six points from last week, moving away from the “greed” zone.
Fed Chair Jerome Powell characterized the rate cut as “risk management” rather than a measure to support a weak economy. This framing may explain the subdued market reaction. Given that markets had already priced in a 96% probability of a 0.25% cut before the official announcement, traders effectively executed the classic playbook of buying the rumor and selling the news.
The political angle of the decision also added uncertainty. Steven Miran, the newly appointed Fed member and former economic adviser to Trump, cast the only dissenting vote, advocating for a larger 0.5% cut instead of the 0.25% reduction.
A chart circulating in the market highlights potential liquidation zones. Prices below spot indicate long positions at risk of liquidation, while prices above spot point to short liquidations. At present, the Max Pain level for longs sits at $112.7K, while the Max Pain level for shorts is at $121.6K, with spot Bitcoin trading around $117.2K. This illustrates the market’s fragile balance—downward movement could trigger long liquidations, whereas an upward breakout may unleash a wave of short squeezes toward recent highs.
Michael Saylor hinted at possible additional purchases, remarking: “The orange dots are moving upward.” He also described Bitcoin as a calm, fair, and impartial tool for resolving conflicts among people.
Meanwhile, last week the U.S. Securities and Exchange Commission (SEC) approved new general standards that pave the way for broad-scale issuance of crypto-based exchange-traded funds (ETFs). These regulations allow exchanges such as NYSE, Nasdaq, and Cboe to list spot market crypto ETFs without case-by-case reviews.
As a result, the approval timeline for ETFs has been shortened from over 240 days to around 75 days, greatly simplifying the process for asset managers. Dozens of new ETFs for cryptocurrencies like Solana, Ripple (XRP), and Dogecoin are expected to launch starting in October. This development effectively ends a decade-long case-by-case review process that dates back to the first Bitcoin ETF application in 2013.
While the Trump administration supported progressive crypto regulation, this approach contrasts with the slower regulatory stance seen under Biden. Despite the regulatory breakthrough, firms stress that legal work, marketing efforts, and support services are still required to successfully launch these ETFs.

NAS100 - Stock Market, After the Fed Meeting!The index is above the EMA200 and EMA50 on the one-hour timeframe and is in its long-term ascending channel. If the drawn ascending trend line holds, we can expect the continuation of its previous upward path, but in case of a valid break, its downward path will be smoothed to the indicated support area.
A week filled with significant events in global markets came to an end, with the Federal Reserve’s decision to cut interest rates by 25 basis points standing out as the most important development. Although this move temporarily boosted the U.S. dollar, it failed to reverse its multi-day downtrend. Fed Chair Jerome Powell sought to frame the decision as a “risk management” measure, but the dot plot indicated that policymakers hold a different outlook, keeping the possibility of further cuts by year-end alive.
Meanwhile, Paul Atkins, Chairman of the U.S. Securities and Exchange Commission (SEC), announced that in response to President Donald Trump’s request, he would propose a rule change to replace quarterly corporate reporting with semiannual reporting. In an interview with CNBC, he said this matter has been placed on the SEC’s immediate agenda. With Republicans holding a 3-1 majority on the commission, such a change could be approved by a simple majority vote. This move would disrupt the traditional reporting and disclosure cycle, making investors wait longer intervals for corporate financial information.
In a Truth Social post, Trump wrote: “This change will cut costs and allow executives to focus on running companies properly instead of worrying about quarterly reports.” He also added: “You’ve heard people say China takes a 50- to 100-year perspective on corporate management, yet we run our companies quarter by quarter. That’s not good at all!” Atkins stressed that the matter remains only a proposal for now and requires review, meaning it is not yet finalized. Significant lobbying efforts are expected around this issue.
Following a week dominated by central bank decisions, markets in the coming days will shift their attention to a wide range of inflation, industrial, and housing data. Alongside these releases, the speech of Steven Miran, the newly appointed Fed member, is set to be a pivotal moment for investors.
Monday will be packed with monetary policy remarks, with Andrew Bailey and Huw Pill from the Bank of England, Rogers and Kozicki from the Bank of Canada, and Williams, Musalem, Barkin, and Harker from the Fed scheduled to speak. Nevertheless, the spotlight will be on New York, where Miran will deliver a speech at the Economic Club at noon local time. Having consistently advocated for faster and deeper rate cuts, his comments are being watched closely by markets.
On Tuesday morning, the release of the preliminary S&P Global PMI for September will coincide with Jerome Powell’s first remarks following the recent FOMC meeting. A day later, U.S. new home sales data will be published.
Thursday will bring the Swiss National Bank’s monetary policy decision. At the same time, markets will receive final U.S. Q2 GDP figures, durable goods orders, weekly jobless claims, and existing home sales data.
The week will conclude on Friday morning with the release of the Personal Consumption Expenditures (PCE) price index for August, the Fed’s preferred inflation gauge. On the same day, the revised University of Michigan consumer sentiment survey for September will also be released, offering a fuller picture of consumer confidence.
Currently, many leading financial institutions expect further consecutive rate cuts in the Fed’s two remaining meetings of 2025. In this context, upcoming speeches from key Fed members could shape expectations. Markets are particularly focused on comments from Waller and Bowman, who previously opposed Miran’s proposal for a 50-basis-point cut. On the political side, it is anticipated that President Trump will once again direct sharp criticism at Powell, a factor that could weigh further on market sentiment.
Separately, Berkshire Hathaway, led by Warren Buffett, has fully exited its investment in Chinese automaker BYD, ending a 17-year-long position. The divestment followed a gradual reduction of shares starting in 2022, and according to Berkshire’s energy unit, the investment had fallen to zero value by the end of Q1 2025.
A company spokesperson confirmed that the position was fully closed. Meanwhile, BYD’s head of public relations expressed gratitude for Berkshire’s long-term support since 2008, noting that the ownership stake began shrinking in 2022 and fell below 5% by mid-2024. This investment is regarded as one of Berkshire’s most successful ventures in Asia.

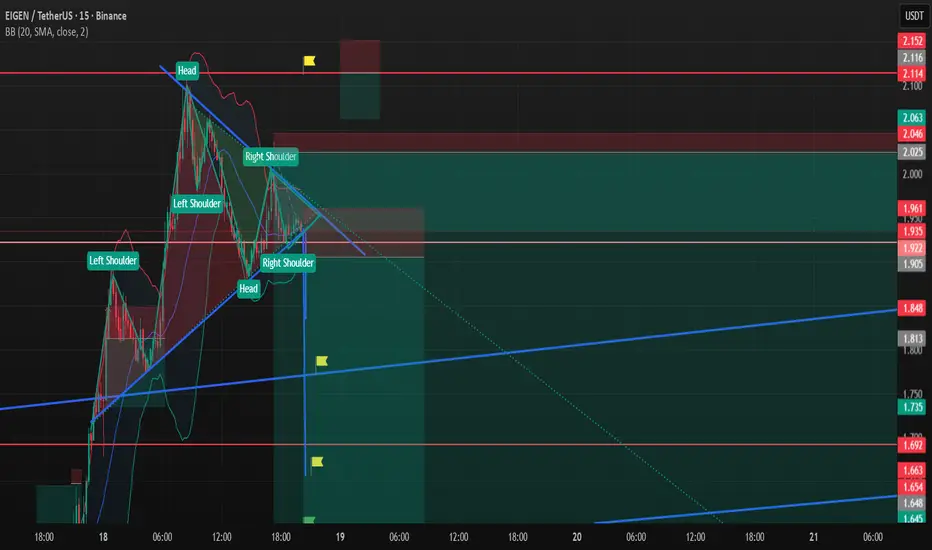
Eigen Short SetupI couldnt publish targets for the last idea it was in rush here I am for the second chart of the same position and also I added a new short position you can follow if you couldnt catch
There is both bullish and bearish head and shoulder formation I assume bearish version will work
Always manage your own risks this is not a investment advise I am not responsible neither your loss nor profit.
Targets
TP1 Blue trendline
TP2 1.658
TP3 1.590
Wall Street Weekly Outlook - Week 39 2025Every week I release a Wall Street Weekly Outlook that highlights the key themes, market drivers, and risks that professional traders are watching.
This week promises to be particularly important, with several events likely to move markets. 📊 Stay ahead of the curve—watch the video now and get prepared like a Wall Street insider.
Any questions? Drop a comment or reach out directly.
-Meikel
