GEO Group: BullishThe War on Fraud
People Will go to Jail
Government Expenditures are being reduced, however, by giving contracts to the GEO group, the government is bullish on this company.
Fundamentally, net income and net revenue increase, bullish, especially in a time when the US dollar is increasing in value.
Michael Burry's only stock position is GEO group
I see no resistance or walls until at least $20 price levels, easy 100% return on investment. By buying shares, I do not need extra exposure which I typically use option plays for. I will sit on this play. I typically am never this long on something, but I truly believe that in this age of BTC and fraud from people who think the IRS are fools, will be surprised when the feds come knocking for the money. If the fed needs to reduce the money supply, it will do so by any means necessary. Also, like fundamentals, and financials, fully agree with this being way too undervalued.
Just for the record I think EV cars will fail because they have zero towing capacity, likely will look into Hydrogen power instead.
Recession

Wheat up four days consecutively & approaching local resistanceTechnically, wheat has seen 4 consecutive sessions of strength. This is in the face of a stronger dollar and recessionary fears, which in theory should sap sentiment and forward demand dynamics. Wheat is approaching key level of resistance at 810. This is a previous POC, that has proved difficult to breach. Though fundamentally wheat should stay bid, considering macro outlook and supply issues, MACD, vwap and RSI all point down to further pressure should this fib retrace become invalidated

Oil Further DownsideOil is going through an indecisive patch.
Was this a Double top? That is the key question we need to answer.
Let us look at some fundamentals:
as the world swings towards a recession, the demand for Oil will see a further fall. Japan wants to restart their nuclear plants, the world is looking for ways to ween off Gas and Oil. Germany & Canada signs a deal to produce green H2.
Looks like the long term headwinds for Oil will stay. In the short term, the indecision is caused by fears of a recession vs the impact of the Jackson Hole annual meetup and its impact on the dollar.
In the short term Oil may head to 95, but in the mid term, it will continue its drive down to 80 and below.

Profit-taking halts the dollar's advanceEUR/USD 🔽
GBP/USD 🔽
AUD/USD 🔽
USD/CAD 🔼
USD/CHF 🔼
USD/JPY 🔼
XAU 🔽
WTI 🔽
A surge in dollar values throughout the first half of the day was followed by a decline against most of the dollar's key competitors. This was caused by unfavorable US statistics, such as the US Services S&P Global PMI dropping to 44.1. Manufacturing contracted at a slower pace than expected from 52.2 to 51.3.
S&P Global PMIs for the majority of the main economies, however, showed sluggish economic growth and even recession, demonstrating it is a global problem. Prior to Wall Street's close, the dollar made some gains as risk-off flows persisted. In the midst of extreme overbought circumstances, the dollar's slide appears corrective. Investors were able to record some profits thanks to tepid US data, but a trend reversal is not evident.
Fabio Panetta, a member of the ECB Executive Board, gave a bleak picture. He stated that when the likelihood of a recession rises, the central bank may need to further modify its monetary policies. In the meantime, speculative interest is gradually but steadily rising on a 75 basis point rate hike by the US Federal Reserve in September.
The GBP/USD exchange rate is at 1.1830, while the AUD/USD rate is around 0.6920. The USD/CAD pair dropped significantly throughout the day, closing at 1.2950.
Safe-haven currencies saw gains against the dollar, with the USD/CHF rate circling at 0.9640 and the USD/JPY rate trading at 136.77.
The price of gold is currently up for the day at $1,7477 per troy ounce, while the price of crude oil has continued its recent rise amid market speculation that OPEC+ may reduce production. Currently, WTI is $93.60 per barrel.
Asia's macroeconomic calendar will stay empty, with Wednesday's US Durable Goods Orders report taking center stage.
More information on Mitrade website.

Yield curve inversion cyclesUS10Y treasury yield minus US02Y treasury yield is an accurate predictor of impending economic recession. Here we compare the 10 Aug 2022 yield curve inversion low point to the low points in 2007 and 2000 that pre-dated the Great Recession and Dot Com stock market crashes. While a small inversion (below 0) does not always pre-date a recession, inversions as low as the current 10 Aug 2022 always have.
Even more interesting is when you zoom in to the daily chart. Here we see the 10Y - 2Y moving back towards 0 from 10 Aug 2022 through 22 Aug 2022, even as stocks have begun to decline since release of the Fed minutes and recent commentary from Fed officials about the importance of continuing with additional rate hikes based on current inflation data.

Just Closed the long postion on the #SQQQ % 4.87 ProfitBase on the technical, the moving 200 day Moving avg of the S&P 500, Give me the indication of this trade
-The fundamentals of the economy aren't improving.
- The negative moment is cause by the Jackson Holl on Fridays, Markets are preparing cause by uncertainty.
I will be DCA on my long term stocks and cryptos and also lock more trades ideas.
Right now is hard to know what the floor is going to, we need more info from the economy, and also know what the fed plants to be which we are going to know on Friday's Jackson Hole meting.

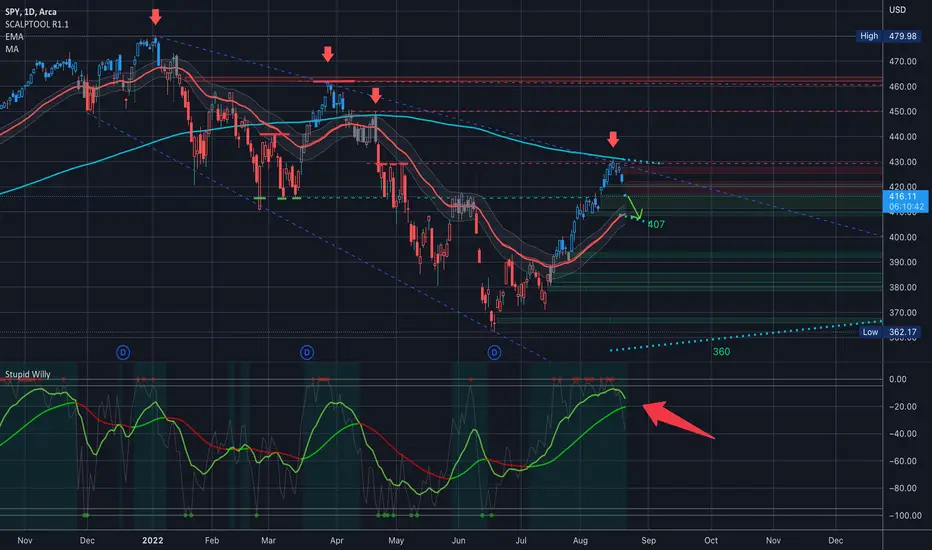
$SPY $SPX Analysis, Key Levels & Targets$SPY Analysis, Key Levels & Targets
When 200MA’s Attack!!! This was almost as good as the April 21st 200MA attach where SPY was literally slapped down… Beautiful open, y’all…. Gapped down over the up gap…. And created another down gap…
This is like gap country, which should be fun to navigate…
The 4 hour chart has rolled over and the daily is just about there…
All of my puts are up pretty big this morning and I shut down some of the shorted dated ones, and I’m looking to sell against some of the longer dated ones….
Looks like another fun week ahead….
Happy trading!!
—-
I am not your financial advisor. Watch my setups first before you jump in… My trade set ups work very well and they are for my personal reference and if you decide to trade them you do so at your own risk. I will gladly answer questions to the best of my knowledge but ultimately the risk is on you. I will update targets as needed.
GL and happy trading.
IF you need anything analyzed Technically just comment with the Ticker and I’ll do it as soon as possible…
Market split bets on the next Fed rate hikeEUR/USD 🔽
GBP/USD 🔽
AUD/USD 🔽
USD/CAD 🔼
XAU 🔽
WTI ▶️
There is a month between now and the next US Federal Reserve interest rate decision and the investors are undecided about how high it would be. Given the falling gas prices, strong labor market, and the looming recession, the US central bank could favor a 50 bps rate hike. On the other hand, the latest comments from Fed officials maintained they are adamant about controlling inflation to 2%, hinting at another 75 bps rate hike.
As a result, the greenback extends its strong run against its peers. EUR/USD slid to 1.0034, and despite having slightly optimistic retail sales readings, GBP/USD stabilized at 1.1820 and closed at 1.1827. The Aussie was held back by a sluggish Chinese economy, AUD/USD went below 0.7000 to 0.6872, while USD/CAD climbed to 1.2993 and edged towards 1.3000.
With another rate hike marked on the calendar, gold’s safe haven status was overshadowed by the US dollar, gold futures declined to $1,762.9 an ounce. Oil prices were stuck between prospects of Iranian oil entering the market and a possible recession, which ended up closing at $90.44 with little change.
In US stocks, Bed Bath & Beyond (BBBY) enjoyed a rapid rise that reached meme status, but it just lost 40.54% of its market cap, after a major shareholder sold his entire stake.
More information on Mitrade website.

DXY's delayed reaction to yieldsI had this confusing idea and I will show it to you with this confusing chart.
1. First we define the blue vertical lines. These are the drawn on the date of the peak of yield.
( Even though yields drop, dollar continues to grow. Like a delayed reaction. Unsurprisingly, yields lead DXY growth. )
2. Then we draw fib retracements, with 1 being the DXY value at the time of yields peaking. And 0 being the bottom of the DXY jump. The peak of DXY is conveniently at 1.618. (or maybe I conveniently drew the chart such that 1.618 appears every time, to further validate myself)
3. When yields return to "normal levels" (red vertical lines), DXY dives.
The location of the red vertical lines, as well as what is defined as "normal yield level" are defined by the arbitrary target of 1.618 I put.
IF yields have already peaked, and if my theory is correct, DXY will reach 120, and when yields return to where they were. Even if the price target is inaccurate, the fact that DXY continues to grow after yields peak, cannot be ignored.

You must first drop if you want to growThe common saying is "you must get up if you fall"
In my mind, the opposite makes more sense.
If you want to get up, you must first fall. As if you sabotage yourself.
Also BTC 100k by 2026.

21-AUG - BTC in stagflation and global recessionIf you just take into consideration, that so far entire #cryptocurrencies #ecosystem grew up in global #hossa and that #hossa has ended and #global #market is going into #recession, what could this mean to e.g. #BTCUSD ?
During each previous recession (dotcom bubble in 2001, global recession in 2008, etc.) #SPX500 fell down >50%.
We should take into consideration, that #Bitcoin had so far only positive market conditions and previous #BTC #cycles just were the #elliotwave in #uptrend and we shall enter corrective Elliot wave.
#SPX500 could fall again >50% that would crash #Bitcoin heavily.
It's not investment recommendation !!

SPX Bull trap?It is time to pause, I will look into and analyze history'because as they say "history does not repeat itself but it rhymes" I would like to present the comparison of the SPX with the fall suffered in 2007.
If we take as a reference the fall of the Great Recession of 2007, it was a fall of 57% during 518 days that means 17 continuous months of fall, the situation was terrible.
Extrapolating it to 2022, taking into account that the fall lasted that long and the fall was -57%, it replicates so far the trend and movements of 2007.
Are we facing a BULL TRAP or should we rather BUY THE DIP?
Today 20/08/2022 Best regards, good investment.

NASDAQ NQ1 - Brace Yourselves, "Fear" is ComingWhen people consider the COVID-era market cycle, especially the part where everything went up on a 75 degree angle without any particular pullback for a year and a half, they seem to have been groomed during that long process to consider that normal, and that it's going to happen again.
Well, the truth is that it probably is going to happen again. One really critical characteristic of the 30% retrace we've experienced this year is VIX really could not get beyond 35. The demolition was very controlled, and there was little to no fear.
But now that we've had a two month-long bear market rally/bull trap, it's time for fear to take hold, because you need to capitulate, lose money, and get short so that you can buy back higher in October.
In the conventional bubble cycle, such as in WTI Crude 2008 or like, every Bitcoin/crypto pump and dump, markets have followed the conventional bubble pattern:
However, what I believe we have ahead for us is actually a Bump and Run Reversal (BARR) , which will be characterized by a significant, quick, and violent dump below the previous lows.
Then, we go and make a new all time high again and everyone is drawn into the Party like they've got nothing better to do than lose money chasing $200 AAPL.
Actually, this is more or less the idea of what we've already seen manifest in action with Bitcoin (BTC).
Hint: BTC is not going to bounce. Ethereum is going to Flippening instead. And then: Central Bank Digital Currencies.
So what lies ahead over the next few weeks is some monstrous sell offs. With it will come all the chatter about the recession this and interest rates that and inflation and housing crisis and credit crisis oh my!
There's no FOMC this month but I hear that Jackson Hole is August 25 to 27. You can probably expect an intermezzo rate hike that may be a lot heavier than 75 basis points.
Then, probably at the Sept. 20 FOMC, after everything has dumped in an astounding way, the Fed will slash rates back to zero, because "reasons," and then we're off to the races placating society for October midterm political theatre and the setup for January of 2023.
So what should you do? Reduce risk and also don't capitulate. Stop listening to Zerohedge, Bloomberg, and Fintwit. They're all just Fabians leading you to the slaughterhouse.
Buy when there's blood in the streets, a little bit at a time. Don't short the bottom.

S&P Bear RallyS&P500 Peaked 4800, with pull backs to 4630.
Current pullback to 4300 and we're seeing a huge drop to close the week. China's earnings report brought some storm to the market, shaking the bear rally.
1. Inflation has not gotten any better - it just stayed flat MoM
2. Rate hikes expected to continue to tackle inflation
3. Market structure still maintaining a down trend
4. Although oil prices had a hard dip but prices are still high compared to prior year. Fairly bullish last 2 days, closing the W candle with a huge bottom wick. If this continues, expecting a higher CPI which will signal inflation still on the table. Energy troubles coming at year end with the winter season. Energy troubles in China, and also many other countries.
5. A lot of news of surrounding lay-offs, being on the cards. Some companies already played the card.
And, of course there are more factors pointing to a bearish market. Looking at debt, and the commodity dips. Probably going back to risk-off season, holding the dollar with the expectation of continued rate hikes.
Looking to short S&P at key price levels if 4300 holds, alongside market structure. Economic conditions are messy in this current period.
Stay adaptive.

A Bearish Call On Financial Markets and The Global Economy China/Europe/EM: The UK and the entirety of Europe are in trouble. The UK now experiencing double-digit inflation and to make matters worse they are facing extreme weather and an energy shortage going into the winter. All the while Putin's war is complicating European energy supply and political ties even further. China is experiencing civil unrest, mostly thanks to an ugly property crisis. China also is experiencing lower-than-expected GDP growth. China's economy slowing has large implications given its massive presence in global trade. Emerging markets are struggling partly due to an incredibly strong dollar as well as a tight global food/energy supply.
US: The US housing market is in a recession with 6 straight months of declining sales and more importantly a monthly decrease in median home prices for the first time in years (the housing market gets hit first by rising rates… remember 08?). US consumer credit I.e., debt levels, are through the roof. Signaling that the consumer might not be as strong as market commentators are saying. Layoffs are increasing steadily, while inflation is staying high. I am bothered to see the number of peak inflation calls after just ONE MONTH of zero gains in headline inflation. The FED is now in a lose-lose scenario where they can continue to aggressively tighten and bring down this wildly levered up global economy or back out and try to save the issue for a later date. The latter would cause additions to the size of their already immense balance sheet and create an ultra-severe recession later down the line. Either way, the recent rate hikes have not at all been fully felt by markets, and add on the possibility that the FED truly commits to QT, then a few quarters down the line we will start to see a serious weakening of market conditions across the board (equities, bonds, real estate, you name it).
Forecast: Risk assets globally are going to get decimated during the next several months of trading, especially low-quality speculative names. Crypto investors should prepare to see some nasty losses, BTC to 9800, and ETH to 575 seem attainable in the medium-term. S&P 500 will NOT make any substantial or sustainable gains over the 4300 mark, 3500 is my next low target. Nasdaq 100, like crypto, is in for a large selloff, next target: 10,200. VIX will rise substantially, and could easily double from current levels. The dollar will stay higher as US rates rally upward, likely well higher than markets currently have priced in. Some commodities will make new highs- nat gas- while others like oil are poised to depreciate modestly but remain historically high. Low/non-profitable, high debt companies- Wingstop and its zombie cohorts - are at high risk of bankruptcy in the coming quarters. Widespread bankruptcies are on the horizon. Things look a little too good to be true right now in financial markets… well that's because they are. On the bright side, this bear market bounce of the past 60ish days has provided a good opportunity to exit risk assets, load up on cash and begin to add on to short positions.
As always this is not financial advice. Good luck!

How to manage Capital in an Economic DownturnThe Great Recession is not the first time that the economy has experienced downturn or recession. The last one occurred during the early 1980s, and it caused unemployment to spike and home prices to drop. However, that doesn’t mean that a similar situation cannot happen again. The effects of a recession have lasting implications for consumers and businesses. When consumers have less money to spend on goods and services, businesses must make adjustments in order to remain profitable. In fact, recessions can lead to innovation in industries like technology where creative minds come up with cheaper solutions for everyday problems. Here’s a look at how consumers are affected by recessions, what they’re doing about it, as well as how you can manage your money in these challenging times.
What Happens When the Economy Recovers?
When the economy recovers from a recession, there are typically two ways that consumers spend their money. One way is that consumers continue to spend on the same products and services that they bought before the recession. The other spending trend that occurs during a recovery is that consumers change the products and services that they spend money on. The reason for this change in spending habits is that consumers have changed their priorities during the recession. When a recession has caused consumers to have less disposable income, they tend to make their money go further. When consumers have less disposable income, they can no longer afford to spend money on certain products and services.
The Impact of a Recession on Consumers
A recession can have a lasting impact on consumers. Consumers who experience a recession tend to have less confidence in their ability to manage their money. This can cause lasting damage to their credit scores as they seek out lower interest loans or take out a repayment plan. A recession can also impact a consumer’s career and ability to earn a living wage. When a recession occurs, businesses have to make changes to remain profitable. This might include laying off employees or reducing the hours that part-time workers are scheduled for. A recession can impact consumers’ ability to buy a home as well. Mortgage rates tend to be higher during a recession as investors seek out higher returns because of the increased risk of default.
Consumer Responses During a Recession
When a recession occurs, consumers are likely to make changes to their spending habits in order to save money. The first thing that consumers are likely to do is reduce discretionary spending. Discretionary spending is the money that is spent on entertainment activities, eating out at restaurants, shopping for luxury items, and on travel. Another common response of consumers during a recession is to change how they get their services. When a recession occurs, consumers are likely to change how they get their banking, insurance , and healthcare services as well as how they pay their bills.
How Consumers Can Manage Their Money in a Recession
The best way for consumers to manage their money during a recession is to make a budget. A budget for spending should include all of the money that goes out of your bank account each month as well as how much money comes into your account. When making a budget, it is important to consider your expenses and income to see if there is any room in your budget to make changes. This can include looking at your monthly expenses and trying to reduce the amount that you spend on certain items. When you are making a budget, it is important to keep in mind that you will have to change it as time goes on. As your income changes, you may have more or less money available to spend each month. Likewise, you may also have more or less expenses to pay each month.
Investing in the Stock Market: The stock market is one of the riskiest investments you can make. It’s also one of the most profitable when things go right. The stock market has its ups and downs, but it always rebounds in the long run. Even during a recession, savvy investors know how to make money in the stock market by investing in stocks and other types of securities. Investing in the stock market may seem intimidating at first, but it’s not as complicated as you think! In this Educational article, we’ll show you how to invest in the stock market if you have less than $5,000 to invest. With these tips and tricks to invest in a recession, you’ll be on your way to becoming a successful investor with an impressive portfolio sooner than you think!
How to invest in the stock market with $5,000
Before you dive head first into the stock market, it’s important to know how much you have to invest. While the stock market can be rewarding, it’s also one of the riskiest investments you can make. Investing in the stock market is all about risk and reward — the more risk you take, the bigger your reward can be. Investing in the stock market requires at least $5,000 in order to diversify your portfolio. Diversification is key to long-term success in the stock market. Rather than putting all of your eggs in one basket, diversification allows you to spread your funds across many different investments.
Diversification is key
When you’re investing in the stock market, it’s important to diversify your portfolio. Diversification allows you to spread your funds across many different investments for two reasons: risk reduction and opportunity enhancement. Risk reduction is accomplished by not putting all of your funds into one investment. Instead, you’re spreading the funds across different types of investments. Opportunity enhancement allows you to take advantage of different types of growth opportunities.
Understand why you’re investing
Before you invest in the stock market, it’s important to understand why you’re investing in the first place. If you’re investing for growth, you’re looking for stocks that are currently undervalued to increase in value over time. If you’re investing for income, you’re looking for stocks that pay dividends.
Take advantage of no-fee investments
When you invest in the stock market, you pay fees for the management of your portfolio. Mutual funds and exchange-traded funds (ETFs) are mutual funds that are pre-packaged and purchased as a single unit. Mutual funds are professionally managed funds that are offered by financial institutions, whereas ETFs are professionally managed funds that are traded on a stock exchange. If you’re investing a small amount of money in the stock market, you’re better off choosing mutual funds or ETFs that have no or low management fees. Mutual funds and ETFs with no or low management fees are often referred to as no-load funds.
Shorting ETFs can be profitable (This strategy is best suitable for Professional Traders)
Shorting ETFs can be profitable if you’re investing a large amount of money in the stock market. Shorting ETFs allows you to profit from a declining market. Shorting ETFs is a very risky investment strategy and is not recommended for beginners. If you’re interested in shorting ETFs, be sure to talk to a financial advisor before making any investments.
Additional Note: When the global economy is on the verge of recession, investors are scared and their first thought is to run towards things that are safe. In recent years, markets have grown to distrust risky investments such as stocks and other volatile assets. When the global economy is about to go into recession, commodities like gold and oil usually become hot properties for investors wanting to preserve their capital. There are a number of asset classes that thrive during a recession: real estate, bonds, and value stocks—or anything with a low correlation to the stock market. However, at the same time there are also some that suffer: high-beta stocks; growth stocks; growth real estate; luxury goods; emerging market equities; and anything else with a high correlation to the stock market. In our next article we will analyze Gold and Silver as an hedge against inflation and their performance in an economic downturn.
Conclusion
The recession that took place in the early 2000s is a great example of how a recession can change the way consumers spend their money. During this recession, consumers were likely to spend more money on food and clothing since those were necessities that consumers could not do without. When the next recession occurs, consumers may change their spending habits once again. However, it is important to remember that a recession is a natural part of the business cycle. It is likely that consumers will continue to spend their money in the future even in the face of a recession. Investing in the stock market is a smart way to diversify your investment portfolio. It’s also a great way to earn passive income through dividends. The best way to invest in the stock market if you have less than $5,000 to invest is through mutual funds or ETFs with no or low management fees. Shorting ETFs can also be a great way to make money in a recession if you have a large amount of funds to invest.
Even though the technical definition of a recession has been changed/modified it is important to know that unemployment rate determines the condition of a recession.

Federal rising rates continue……Federal rising rates continue and causes fall of Dow jones 30 and Nas100. Highly possible we will see another crash of a big fall since Biden signed the inflation reduction act; after few weeks of wining streaks; the brief we may seen won’t be pretty as Wall ST preparing for its losing streaks.
Monkeypox are still on a spread ; everybody ignored the global health emergency .. made the economy a lot worse but soon will collapse. China attacked Taiwan But then preparing sending ground troops to invade as china warned USA that will declare world war.
On top of that Taiwan are preparing ground troops of china play games. COVID-19 Omnicron variant mutated more of variant B.A 2.75 had become dangerous and spread even faster than before.. so becareful we be seeing another crash as economy is slowing down
THIS IS NOT FINANCIAL ADVISE

SPY Rally is over. Prepare for a huge DROPMultiple indicators signal the end of multiple indices like SPY & QQQ. Time to go short

Slowing Chinese economy sends US dollar higherEUR/USD 🔽
GBP/USD 🔽
AUD/USD 🔽
USD/CAD 🔼
XAU 🔽
WTI 🔽
Yesterday, the latest Chinese Industrial Production readings recorded a 3.8% growth - falling short of the 4.6% forecast, and raised concerns of a possible recession. On the same day, the Chinese central bank lowered its interest rate from 3.70% to 2.75%, in order to stimulate the economy while dealing with the pandemic.
As such, a weakened global demand saw WTI oil futures fall to $89.41 a barrel. Meanwhile, safe-haven demand is increased with growing recession signs, the US dollar gained much momentum, USD/CAD rose and stabilized at 1.2904, gaining over 100 pips.
The Reserve Bank of Australia has released its meeting minutes this morning, expecting to raise rates even further to “normalize monetary conditions over the months ahead”. The Aussie almost dropped a full 1% against the greenback, declining and slowing at 0.7020, to a closing price of 0.7022.
Euro and Pound both suffered noticeable losses, EUR/USD slid to 1.016, and the GBP/USD pair closed at 1.2054. Gold futures went below the $1,800 level to $1,798.1 an ounce.
More information on Mitrade website.

Does it make too much sense?The daily NASDAQ hasn't fallen below the 900d MA since the Great Recession.
Leading up to the Great Recession, there were 2 traps on the NASDAQ (one pushed the 0.38 fib and the other pushed the 0.5). When the second trap hit the 0.5 fib level, the NASDAQ crashed. In other words, it bounced off the 900d twice before capitulation set in. The current market saw the NASDAQ break through the 0.38 level (assuming because of market aggression and the fact that the dollar is inflated) and it reached the intersection of the 100d and 200d MAs earlier this year, and now it's approaching the 0.5 level again.
The economy is chalked.... The economy was saved during COVID via a bubble. Print and hand out money to keep things going (probably necessary). But the Fed didn't react quick enough with the rate increases, especially once everyone realized our "leaders" had no clue what they were talking about related to COVID. So, the bubble grew. Oh, and Ukraine, China, etc....
I have a chart on my page that overlays the inflation rate over time and unemployment rate over time. Every time the inflation rate spiked, unemployment follows on a lag. So, I'm expecting unemployment to increase in the coming months, and this lines up well with the movements described above. I mean, we're already in one, but our government is either that far gone or that stupid... idk which is worse.
So, there are so many things that say the crash is coming, but does it make too much sense?
TVC:NDQ
NASDAQ:NDX

'01 & '08 Type BeatFrom not only a fractal's perspective as many of you have seen from comparing price action from 08 & 01 to the present, the Moving Average distance has reached the historically critical levels as well.
The below indicator is MA_dist - measuring the distance price is above & below the set Moving Average (100 daily). The price has stuck its head up above the moving average at the exact same level seen in '01 and '08. This is a critical point in distinguishing what type of bear market we're in. A return to the lows seen a few months ago would likely mean that we're only half way through this bear market capitulation.
Shorting here with a tight SL would probably be my best call. The fear that put us in this price market isn't gone, it's merely priced in & there's really no reason to see any economic upside quite yet.
I'm not sure how this Fall's "famine" & migration in the middle-east is going to affect all of this - there'll surely be fear & for good reason - but I couldn't say how that'll affect the current prices. Is this Fall supposed to be bullish for the US economy? One could argue for & against it - but I'll leave that up to the economists.

DXY (1W) ready for next BULL Run = Risk Off mode incoming. Hi Traders,
As you probably think what is the best indicator // driving force of current Stock / Crypto / Commodity markets (?)...
Its probably Dollar Index. You can see its going upwards in a HUGE channel.
If there is THE Recession coming (or its already in progress) ... than we Have to follow what is doing the World reserve currency. (Until it well be replaced or loose some of its position in a mix of other currencies).
So MAJOR trend is upwards, as you can see at 1W/1M chart.
Minor trend at 1D chart is currently sideways / down. 1D chart is attached. = Seems like its forming a BULL flag.
Hence right now most indexes are in corrective stage and many of them corrected about 50%+ Upwards from local lows.
Lets see what is going to happen in next months.
My Humble expectation is there will be 6+ (up to 18 months) of Bear market.
It will depend a LOT what can do Central banks to save the situation if its really necessary (High inflation, decreasing GDP, Economic slowdown, ...).
Take care and stay Green ;)

GOLD BILL RUNOANDA:XAUUSD
The MONTHLY chart shows the ratio between the spot gold price
and the US inflation rate.
While overall, the ratio is quite stable or consolidated for a period
of more than 15 years.
Hpwever. y three episodes are noted where the ratio rose parabolically
including 2009, 2015 and the Covid 2022 time period
.
For the present, the RSI Swing Indicator has printed a Buy Signal.
and
the MACD shows an early K/D crossover under the histogram.
Does this suggest an impending hard Bullrun for XAUUSD?
Please comment and offer your opinion. OANDA:XAUUSD
