TLT Breaks Out of Descending Wedge to seek new All-Time Highs?Using the same fractal analysis method I used to forecast the BTC dump & dead-cat bounce, I began watching US Treasuries as TLT was set to break out of a descending wedge.
Now that it is has, I'm publishing the idea for others to weigh in on.
If the pattern plays out we could see new all time highs; which suggests we could be entering another period of recession much like the financial crisis of '08.
I do not currently have a position & this is not financial advice. Just sharing observations as they occur.
If you wanted to play the pattern, TMF(long) & TMV(short) are leveraged ETFs you can use.
Recession

The global market crash of 2020 and the invisible recessionThe global market crash of 2020 and the invisible recession:
Laying over a select number of my tweets from 2019 and 2020 with calls for the a 40% correction, the start of the recession, and tentative dates for the global market crash.
I was off by a few days, but it's hard to predict the future. Obviously, right?
Also, I had my confirming signal exactly two years ago in July 2019 which is why I am sharing this now.
2 years since from confirmation.
I used various dark patterns, analyses, and techniques which gave me then the confidence that there was a black swan underway.

Massive Correction coming in the financial markets!!DXY
SELF DEVELOPMENT/METHODOLOGY/PSYCHOLOGY
SMP Strategy
Market Direction: Long Position
Chart time frame - MONTHLY
Timeframe - 4-5 Months
You will see a very strong USD move to the north which will drive down commodity levels, Metals and the crypto market. This may last for 4-5 months so hold on!!
Plenty of opportunities in the second half of the year!
A – Activating Event
Market will meet support in zone @ current levels - ... . In order to enter into this trade, the pair MUST be in line with my Entry Procedure....
B – Beliefs
Market will move towards the first Target 1 level @ 110.00
C - Fundamentals that may affect the pair
N/A
D - Trade Management
Entered @ 92.8
Stop Loss @ .....
Trailing Stop Loss@.....
Target 1 @ 110.00
Target 2 @ ....
Risk/Reward @ 1.4
Happy trading :)
Follow your Trading plan, Remain disciplined and Keep learning !!
Please Follow, Like,Comment & Follow :)
This information is not a recommendation to buy or sell. It is to be used for educational purposes only!

USOIL OPEC+ 2021'mess, first ceiling of 2021?USOIL - OPEC+
Just one word: GREED! ...
OPEC+ Crisis Propels Oil to Six-Year High as Market Tightens
TVC:USOIL
www.bloomberg.com
www.nasdaq.com
www.bloomberg.com

Lumber bubble pops - what does it mean?Some may not be aware of the importance of lumber price movements.
Basically lumber rocketed like nobody's business, then crashed (>50% correction) pretty quickly. This post is not an analysis of why lumber prices rose so crazily. Viewers will need to do some background reading.
The collapse was the worst seen since 1978 . That's something to chew on. In essence it was a bubble that popped. It was about demand going wild for all sorts of reasons, with no true underlying 'value'. That phenomenon has been seen repeatedly across all asset classes. It happens when something is fundamentally wrong with market booms.
Those who would purchase lumber wised up; the market became saturated in extreme overbought territory, and those who would have been using lumber (for house-building etc) basically switched from 'commodity' purchases to 'services'. That's the broad brush and I can't give chapter and verse here. People went on holidays! I didn't say 'everybody'. Yes - read about it. They decided, ' Now is not a good time - I'll do some travelling and living instead '. Funny but true.
But what's underlying the lumber bubble pop, is that the Housing market has suffered a similar pop. Ahhhh.. some will disagree with me because they're not seeing much about that in the news. Well BigMedia news is usually 3 to 6 months late! And of course, people believe more than 50% of what they read in the #LameStreamMedia news - but will never admit that.
I'm not about to deviate onto the metrics for the Housing Bubble pop here. Serious traders and investors can find that on the net from reputable channels on popular non-conventional streaming channels. But don't expect the whole picture to be found in one place.
The lumber pop, in conjunction with the housing pop - is basically bad news for loads of commodity sectors. If you don't believe me go back to 2007-2009. This is literally where the 'house of cards' (pun intended) collapsed. History repeats itself because human nature doesn't change much.
Disclaimers : This is not advice or encouragement to trade securities on live accounts. Chart positions shown are not suggestions intended to assure you of an advantage. No predictions and no guarantees are supplied or implied. The author trades mostly trend following set ups which have a low win rate of approximately 40%. Heavy losses can be expected if trading live accounts. Any previous advantageous performance shown in other scenarios, is not indicative of future performance. If you make decisions based on opinion expressed here or on my profile and you lose your money, kindly sue yourself.

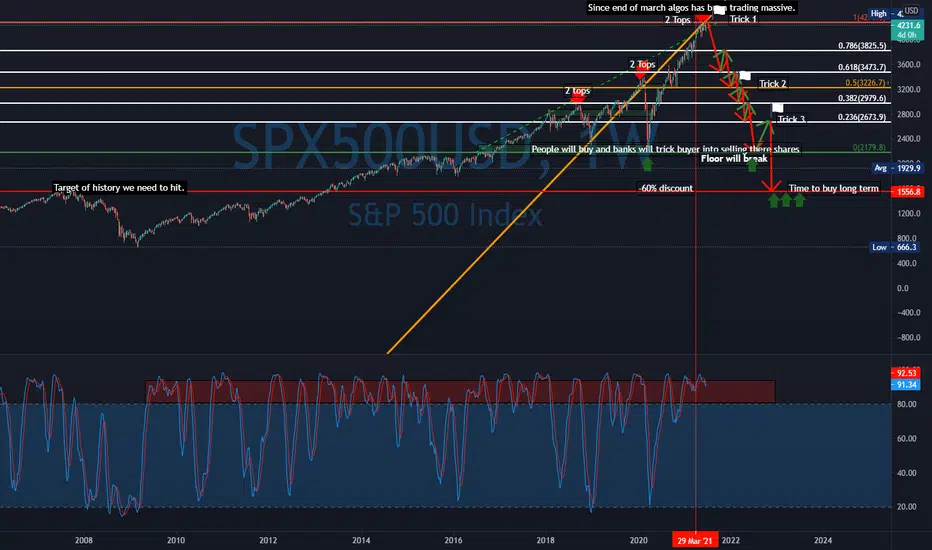
The target no one believes. (Recession)The target no one believes. (Recession)
-Dollar at massive support. Deflation = recession
-Oil at big ressistence.
-Banks cant keep risking printing money anymore, would risk hyperinflation
-Double tops with massive algo trasaction growing with big insider selling high staks.
-Summer is the slowest part of the investing period
-Momentum totaly useless
-Vix at history lows and making support.
-EURUSD and GBPUSD at massive resistence. Currencies getting too expensive.
-Gasoline prices too high to sustain profits in airline indutries.
-Unemployment still too high.
-More small companies are suffering, big index stocks overvalued.
BTC SHORTS for the LONGS btc to the 21K-25K range then will continue it's bull run the bear market will persist for the entirety of this summer

Major Market Correction/Crash Imminent(Not financial Advice)
They say History repeats itself, but history rhymes throughout the times.
Last week NASDAQ seemed to perform relatively well in relation to the DOW JONES (DJI,US30). However there are signals of a correction or a potential crash.
FUNDAMENTALS
- Drastic increase of inflation , the highest since 2008 before the collapse. When the cost of goods/services rise, people will not have the money to invest.
-INSIDER TRADING, Directors, CEO's, Upper Level Management across the board have been selling their shares
From Amazon, Google, Microsoft, Walmart, Apple ect.
- Gold/Lumber Ratio has declined. When the prices of lumber rise it usually signals people moving into more risk-on assets. But as Lumber prices have started to significantly
decline it may signal the start of a potential downturn if Gold rallies higher.
-PE Ratios and other valuation methods are similar to levels of Dot Com.
TECHNICALS
DOW JONES and other Major Indices crossing over on the Weekly MACD
DOW JONES Dow theory can come into fruition
US 10 Year Treasury Bond
4hr MACD cross over
The Majority of the people in the markets do not make money over a long period of time. Where the masses come at the top of a market.
The majority/masses also do not understand "what is money?" and what is true genuine value. Where when the market crashes a lot will sell at a loss forcing prices to drive lower.

Are we entering recession phase now? Nasdaq is looking similar to other major indexes around the world and that is exhausted, the #crypto rally is also looking tired now. Maybe this is the time the bull run finally comes to the end.
Nasdaq made ATH near 14k just few weeks back, but that was an failed rally to get back in the ascending channel. If we were to continue this bull run it shall get back up and above 15k this time otherwise we will see it continue declining to near 12k as first stop and then after some battle maybe near 10k.
10k comes with a very strong support so we likely wont give up easy but remember that 20% off from ATH will be around 11500 so if we hit anywhere below 11500, the economy will be considered in recession.
Higher taxes, and not so strong job numbers, slow growth due to global hit of COVID will have a prolonged recession this time.
I wish this was not true, but sometime you do not choose your battle - the battle choose you. So its recommended to go light on high beta stocks, and heavy on cash or FMCG sector

BTC To 73300All you dogecoin piss heads will lose your entire net worth and in debt due to your roach minded logic and lifestyle
BTC to 73300
Also when crypto crashes
I'll be ready to take your money this time around

Greatest Depression in Our Lifetimes This Decade?This is all just hypothetical. Everything will eventually form a parabola. Do people really think we'll have another 10+ years of an artificial bull market in America? Do people really think there's no consequences for the unlimited printing of money? Do people really think the stock market won't eventually have a massive correction?
It will be interesting to see how this decade will play out. Personally I'm pretty pessimistic about the future of the dollar and this potential market correction could be catastrophic and lead to social unrest given the rise in populism. Worst case scenario equals a modern day great depression that would be the biggest in the history of America. Just my opinion.
Hedge well. Much peace love health and wealth.

ETH - Tales From The CryptPlease note that ;
this is not a technical anaylsis , just another different long term projection.
agree /or not agree , comments are welcome here. ^^

Oil had already been rejected at the 1.618 fibOil is at the highly significant 1.618 fib retracement which coincides with a trendline resistance. Current global conditions are highly unfavourable for oil prices due to political and economics factors. There is tension both internally as well as externally within opec countries and this is on top of the recession that has left a permanent damage on oil demand. Higher oil prices negatively impact global recovery and further price increases will likely be met with great downwards selling pressure from oil importing countries.

Next leg up seems certain here.-Strong break out of descending channel
-Resting on .618
-Will likely backtest the channel first (BTC loves to backtest triangle/wedge/channel breakouts)
-Approaching the 10 year trendline I wrote about in my previous analysis ~$80,000, 2.618. Very interested to see what happens up there.
-Bulls defended the relatively steep 1Y support
-MACD ready to cross over again
I was a little spooked by the last dip, but strong hands & cool wits prevailed. Defended the 50k level beautifully in the end. I say we are ready for 60-70 now.

10 Year Treasury / 3 Month Treasury Yield Inversion & RecessionNot my idea, but it does seem to hold some water. Note the orange spikes above the 10 Yr T Bill and pull up history 1990/2000/2008 serious corrections
6-18 months after the 3 Mo/10yr treasury rates invert, the US economy goes into recession
1991 was a 33% drop, 2001 - 83%, 2008 - 54%
I've seen longer data sets that hold true even farther back from FRED
*NOT FINANCIAL ADVICE - NOT A FINANCIAL ADVISOR*

QS - the Lance Armstrong - Down to $22 we GoNote the special shape that's appearing on every stock. PP - Lance Armstrong Edition
I think God is trying to send us a message, or maybe it's the other guy given the message.
21.87 looks like the next support level and happens to coincide with a FIB number.
