Trading Commodity MarketsIn this video we will look at the current state of oil..
You shall also learn how to understand and track commodity markets.
This involves market Sentiment at all times and mixes in TECH analysis.
Search in ideas for "COMMODITY"

Is silver about to break out? Commodities by themselves are not deflationary! They are dug out of the earth, and that both needs technology and people! The demand for gold and silver is higher, it becomes even higher when there is an industrial application to it.
Along with inflation, it cost more and more to refine and dig out Silver/Gold! it cost more for machinery and people. Is Silver about to break out, this will be the 3rd time it will hit resistance, and this breaks then all the algo's will follow and drive it higher and higher.
Its been a very long time since we had a commodity super cycle.

DBA - Invesco Agriculture Fund Commodities are currently repricing lower due to the looming global slowdown. Meaning, there is more potential downside for commodities
However,
There are more significant tailwinds that will push commodity prices higher in the longer term.
DBA ETF broke out of yearly downtrend in 2020 indicating that higher food prices are in the global outlook for the upcoming years.
A pullback is probably overdue but after prices stabilize, we can see the DBA ETF push significantly higher. The first stop is fair value (red line).

still no sign of bullish signal on COmmodity and oilit proves the dollar still bullish
maybe we need to wait for the 2 November 2022 FOMC 75 bps rate hike...

DB. commodity index idea (13/09/2022)DB. commodity index
We expect the index to continue declining because prices are below the 27.05 resistance point, and wave (2) has already ended and started falling in waves (3). We expect prices to drop to 1.618% at 22.18, but currently, we expect the correction to continue to 61% at 26.06 to end wave 2 before descending again.

DB. commodity index idea (07/09/2022)DB. commodity index
We expect the index to continue to decline since prices are below the 27.05 resistance point, and wave (2) has already ended and started descending in waves (3). We expect prices to drop to 1.618% levels at 22.18 prices

GSC - Goldman Sachs Commodity Index - Bullish UpTrend intactGSC - Goldman Sachs Commodity Index - Bullish UpTrend intact.
Broken red long term DownTrend line.
Reverse yellow Head & Shoulders reversal pattern.
New Green UpTrend line being adhered too.

COINbase Long Bitcoin future as commodity Expecting a pull back towards $88-89 as Day pivot 3-Buy retest and form a 30F pivot zone.
Then a spike towards $111 is looking ahead.
Bitcoin and Ethereum as commodity era is coming.

Cotton Futures Reversal (MCX)The commodity has broken out long back and retested now, therefore may undergo a reversal rally. Trade is supported by Supports Nearby.
Risk Reward Ratio - 1.5:1
SL is placed below the support zone & the lower trendline. The target is placed near resistance.

Silver Breakdown (MCX)The commodity has broken down and retested, therefore may undergo a correction. Trade is supported by Resistances Nearby.
Risk Reward Ratio - 1.5:1
SL is placed above the resistance zone & the upper trendline. The target is placed near support.

Iron ore miners to Bull hard Hey guys,
Good time to load up on iron ore miners who have been sold off recently but i dont see prices falling below that major long term support line it has bounced off.
This chart is part of my thesis on the Inflation cycle to calm down over the next few months but as commodities like iron ore, copper, Oil etc start to bull again as people still have cash at hand to deploy as prices come back down. The Bullwhip effect has certainly started with retailers increasing stock by +25% while sales Revenue only increases by 3% something that confirms prices have started to fall but Major support being hit here and in other commodity showing people are back to buying and the commodities will lead the way back up starting the next wave of inflation that will hit a higher peak then current levels.

EURAUD: BULLISH EXPANDING 🔺 BIAS: BULLISH 🔺
TECHNICAL PROJECTION: BULLISH 🔺
We have a H4 breakout bullish confirmation, bullish momentum is expected to carry to 1.556 target.
AREAS OF INTEREST:
H4 time frame, bullish breakout confirmed- will be attempting to join in the "E wave" by break & retest method.
FUNDAMENTAL PROJECTION:
AUD is weak and will become weaker as it gets weighed down by lower commodity prices. The markets await the upcoming rate decision where there is a possible chance from 25 bps to 50bps on 5th July, which may bring strength to AUD... but until then we will be playing AUD weakness!
EUR:
As ECB President Lagarde indicated, the ECB would be looking to the CPI data as a guidance to their interest rate decision. A higher than expected CPI data which was revealed on Friday (8.6% Previous: 8.1%) could spur the ECB into a more aggressive policy adjustment which will strengthen EURO.

CRB Index ending Diagonal - is the commodity cycle done ? CRB Index has been trending steadily since the time the logistics issues cropped up along the Covid wave across countries , gaining additional impetus from the crude oil rally - ukraine war. However off late its a bit surprising that so many of the commodity shortage or panic demand factors are so quickly priced in , as the ending diagonal in CRB almost makes it certain by way of wave theory that a significant top is placed. This also shows the tendency to stay out of commodities as the central banks who have suddenly woken up to inflation - rather late are now not leaving any scope to increase rates.

What to buy and how to ride the commodity bull?Discussion:
1. Example on Natural Gas - breaking away from its range
2. Beginning stage of a “Growth” stage
3. Identifying and trading in its uptrend with multiple timeframes
Disclaimer:
• What presented here is not a recommendation, please consult your licensed broker.
• Our mission is to create lateral thinking skills for every investor and trader, knowing when to take a calculated risk with market uncertainty and a bolder risk when opportunity arises.

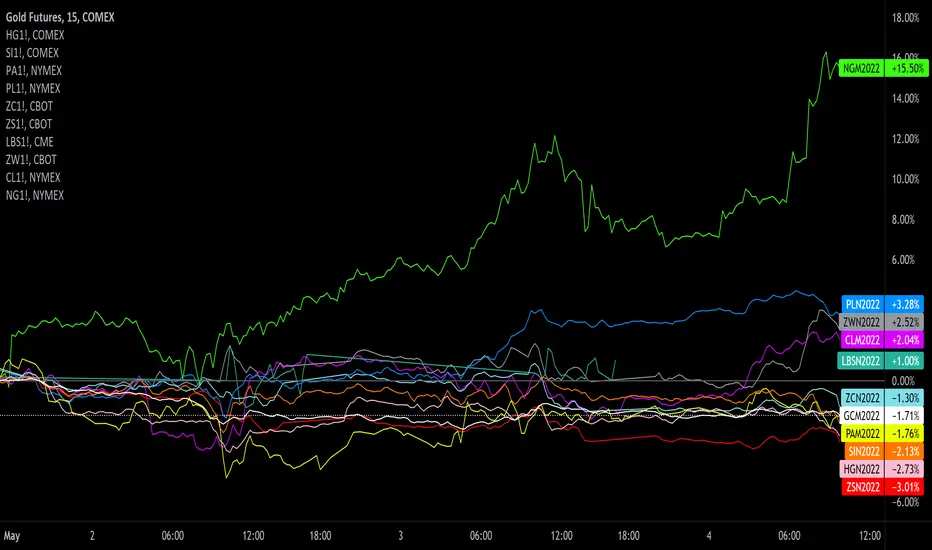
May commodity checkMay commodity check:
GC1! GOLD
HG1! COPPER
SI1! SILVER
PA1! PALLADIUM
PL1! PLATINUM
ZC1! CORN
ZS1! SOYBEAN
LBS1! LUMBER
ZW1! WHEAT
CL1! OIL
NG1! GAS
Do your own due diligence, your risk is 100% your responsibility. This is for educational and entertainment purposes only. You win some or you learn some. Consider being charitable with some of your profit to help humankind. Good luck and happy trading friends...
*3x lucky 7s of trading*
7pt Trading compass:
Price action, entry/exit
Volume average/direction
Trend, patterns, momentum
Newsworthy current events
Revenue
Earnings
Balance sheet
7 Common mistakes:
+5% portfolio trades, capital risk management
Beware of analyst's motives
Emotions & Opinions
FOMO : bad timing, the market is ruthless, be shrewd
Lack of planning & discipline
Forgetting restraint
Obdurate repetitive errors, no adaptation
7 Important tools:
Trading View app!, Brokerage UI
Accurate indicators & settings
Wide screen monitor/s
Trading log (pencil & graph paper)
Big, organized desk
Reading books, playing chess
Sorted watch-list
Checkout my indicators:
Fibonacci VIP - volume
Fibonacci MA7 - price
pi RSI - trend momentum
TTC - trend channel
AlertiT - notification
tickerTracker - MFI Oscillator
www.tradingview.com
AUDUSD and Commodity PricesFundamentals:
Australia's exports are, mainly, iron ore, coal, petroleum gas, gold , and frozen bovine meat (4% and above total exports; especially iron ore and other ores (>20% of total exports). They also export inorganic materials, wheat and cereal, but this is less than 2% of total exports. Anything 4% and above is more significant. Australia's largest trade in exports with China, Japan, South Korea, United States, and India.
The USD has seen strength and will continue to see strength in the near-term as the yield spread continues to favor a strong dollar.
Drought in Argentina (informed by a close friend in Argentina)
"Drought in US soil as of April 19, 2022 46.35% of the US and 55.38% of the lower 48 states are in drought. Acres of crops in the U.S. are experiencing drought conditions."
www.drought.gov
Demand from China has risen due to China's desire to urbanize its peasant farmers and the rest of their populace. Also, China's local producers have been severely impacted by China's zero covid policy. The country needs to import food as a result.
The EU will use biofuel as a replacement of gas from Russia.
Looking at this list and at commodity prices in general, I believe that this has and will eventually help to support and/or continue to support AUD or CAD currencies. This situation will help Australia's import/export terms of trade index. IT is only a matter of time until the RBA must raise rates.
I think taking a small position in AUDUSD is ok here.
Technicals:
Horizontal Support
Volume support
I do not believe it will fly like a stock. But, I believe that it will bounce back up to major resistance in the medium-term; a quarter from now; maybe after the USD finishes is upward trajectory.
Taking a small risk here is ok with me.
Entered @ 0.7121
Stop@ 0.6965
Target@ 0.7590
Risk% = 0.50%
Reward-to-Risk Ratio = 3:1
Potential loss = $1000
Potential gain = $3000

BRENT OIL SHORT TERM AND LONG TERM ANALYSISBRENT OIL SHORT TERM AND LONG TERM ANALYSIS.
Here in this analysis we have the road map of BRENT OIL.
There might be a huge decrease in the price of this commodity be aware of it.

Sugar Long - SBK22Buy Signal
Entry - 19.06
TP#1 - 19.86
TP#2 - 20.23
SL - 18.44
**Trading commodity futures and options involves substantial risk of loss.
The recommendations contained in this letter is of opinion only and
does not guarantee any profits. These are risky markets and only
risk capital should be used. Past performance is not indicative of future results**

Lower commodity prices before higher $96 first, $80s nextEveryone's bullish commodities and calling for a supercycle and a breakout here. However, every commodity chart looks like it's in the process of topping or has already topped.
Then if you look at this chart, it just hit resistance again and hasn't been able to break through.
The highest probability scenario to me here is that we reject and fall lower to $96, then rally over summer, and fall lower in the fall/early 2023 to find a bottom in the $80 region.
After that, I can see the case for commodities to rally, but don't think commodities are going to go up here like everyone thinks.

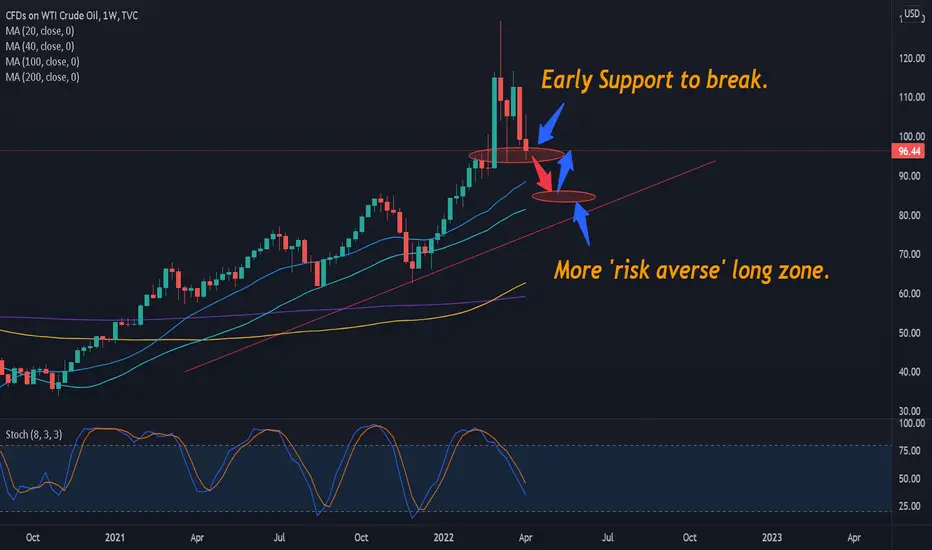
USOIL Longs on the fallOur OILUSD Chart demonstrates a fast change in sentiment dragging a key commodity down.
We are arriving at early support. For those with accurate RM you can stagger positions.
If you are happy to wait and are more risk averse, you take LZ2 underneath.
bullish long-term trend for commoditySP follows a steady trend in history, whereas commodities tends to be more volatile. We usually call it cycle.
If you followed more historical data, you would find a significant two sessions cycle made the equity/commodity curve inching up.
I believe this is the beginning not the end.
(I should publish this earlier, it would be more useful. Now I put it here just for monitoring the trend.)

AUDUSD Weekly- Commodity currency breaks outAUDUSD Weekly- Commodity currency breaking out of consolidation flag.
Heading towards 0.80000 ?

CRB Commodity Index predictionCRB Commodity Index prediction
When it gets highs the equity takes opposite affect
so its inversely proportional
