MARA Macro analysis | The bigger picture | Long-term holdersNASDAQ:MARA
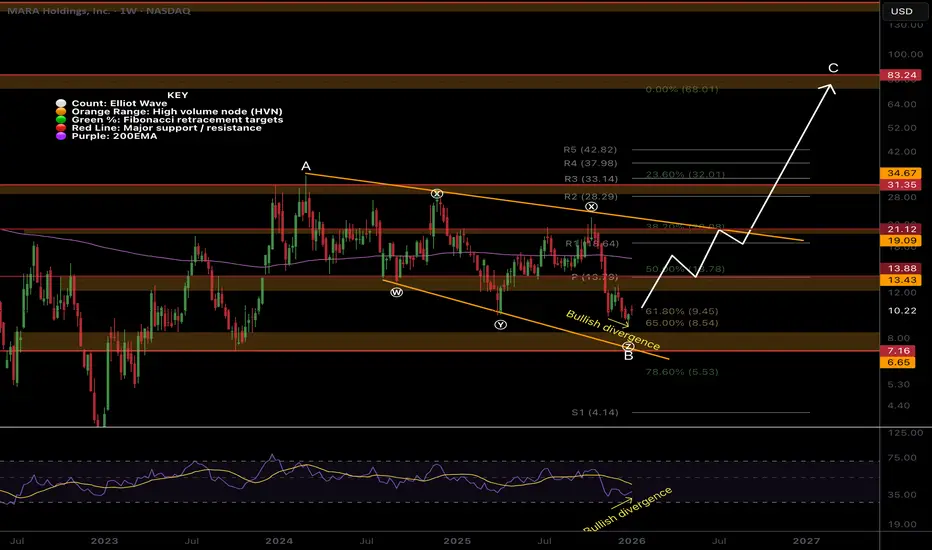
🎯 Mara remains at the golden pocket support and channel lower boundary. It is below the daily pivot and 200EMA, showing the bears are in control. Price appears to be in an Elliot wave B, restricting upside targets to the 1:1 Fibonacci extensions at $106.
📈 Weekly RSI is nearing oversold with room to fall but has bullish divergence
👉 Analysis is invalidated if we close back below wave (II), $3.07
Safe trading
Treasury
MSTR Macro analysis | The bigger picture | Long-term holdersNASDAQ:MSTR
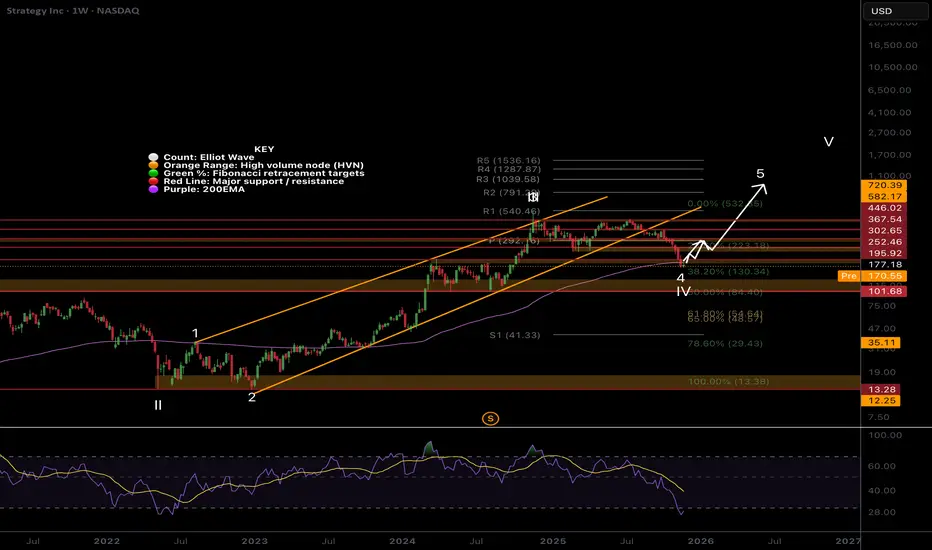
🎯 Sentiment is low, the asset is hated and misunderstood by TradFi and retail. It’s a recipe for a bottom! Price is now below the weekly 200EMA and pivot, in wave 4, hitting the 0.382 Fibonacci retracement. The bears are in control.
📈 Weekly RSI hit oversold with hidden bullish divergence
👉 Analysis is invalidated if we close back below $101
Safe trading

MSTR Short-term analysis | Trading and expectationsNASDAQ:MSTR
🎯 Price dropped hard wave Y of 4, invalidating the previous analysis. Wave Y can complete any time in this flat correction pattern, but is approaching the 0.382 Fibonacci retracement, a high probability bottom.
📈 Daily RSI went deep into oversold on bullish divergence
👉 Continued downside has a target of the S1 pivot, $136
Safe trading

MSTR when will it end? Soon...NASDAQ:MSTR Sentiment is low, the asset is hated and misunderstood by TradFi and retail. It’s a recipe for a bottom!
Price hit the weekly 200EMA in wave 4. Not much more to add, there is room to fall to $101 High Volume Node, but a bottom should emerge soon.
🎯 Terminal target for the business cycle could see prices as high as $1000 based on pivots
📈 Weekly RSI hit oversold with bullish divergence from wave 2
👉 Analysis is invalidated if we close back below $84
Safe trading
MSTR nearing bottom?NASDAQ:MSTR Price dropped hard wave Y of IV, invalidating the previous analysis.
Wave Y can complete any time in this flat correction pattern, but is approaching the 0.382 Fibonacci retracement, a high probability bottom.
📈 Daily RSI went deep into oversold, negating the bullish divergence
👉 Continued downside has a target of the High Volume Node, $101
Safe trading

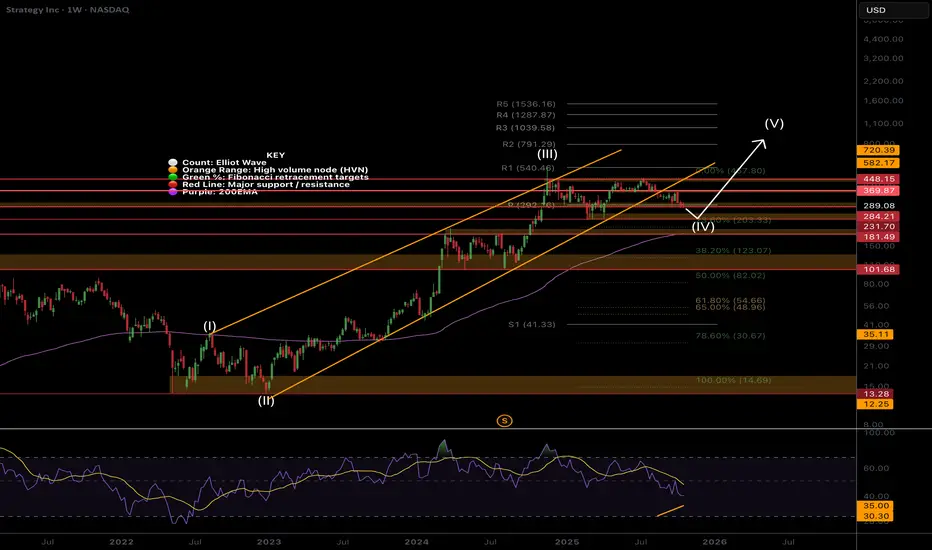
MSTR weekly bull divergence on low sentimentSentiment is low, the asset is hated and misunderstood by TradFi and retail. It’s a recipe for a bottom!
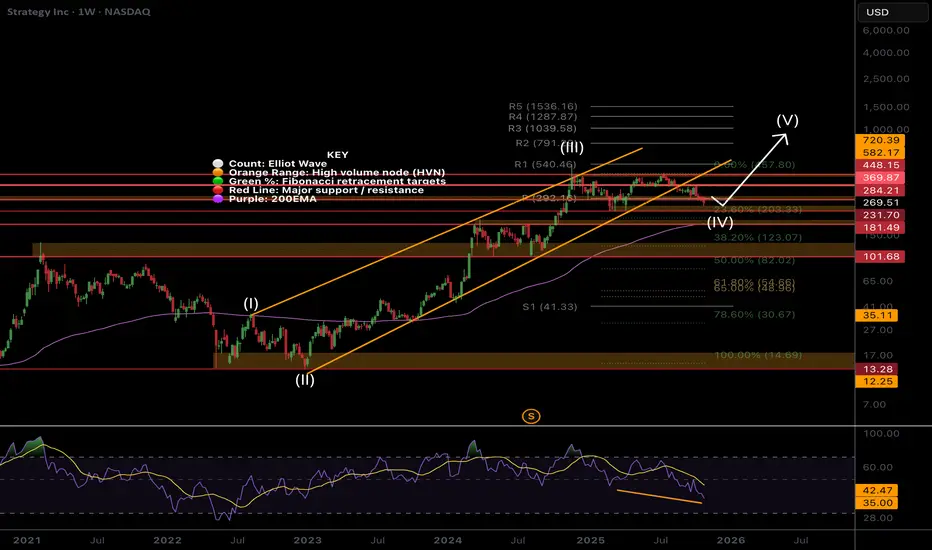
Price is still in a wave (IV) which are expected to be long and drawn out, driving investors into shallow capitulation through boredom into patient hands. I don’t expect wave (V) to kick in until Bitcoin moves. Wave (V) has an expected target of the R3 daily pivot at $1039 but will overextend if Bitcoin does.
Price has fallen out of the lower channel boundary and sitting below the weekly pivot, still above the weekly 200EMA so the outlook is bullish. Wave (4) may complete at the 0.236 Fibonacci retracement at $230. For now I am waiting to see what happens before entering. Good opportunities are setting up.
🎯 Terminal target for the business cycle could see prices as high as $1000 based on Fibonacci extensions
📈 Weekly RSI has bullish divergence
👉 Analysis is invalidated if we close back below $82
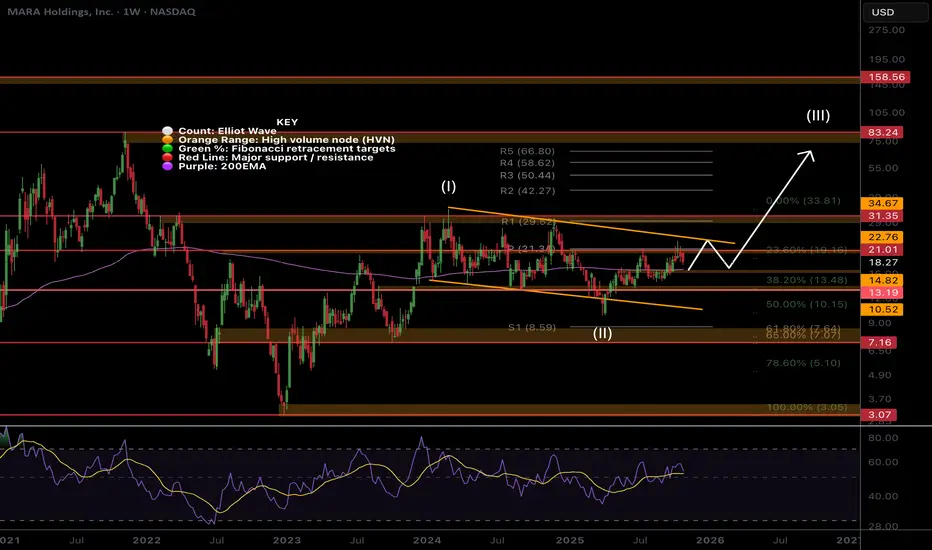
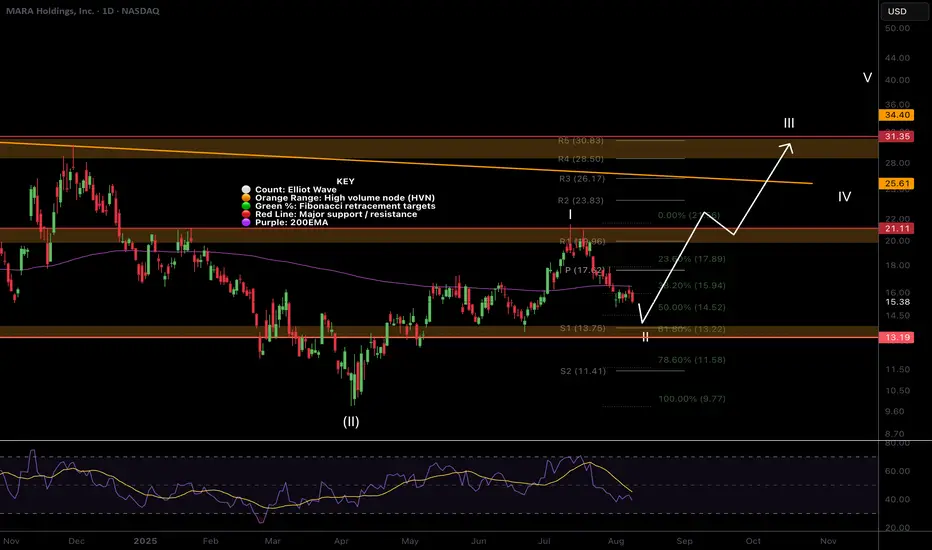
MARA boring... Investors cant waitMara has the potential for a strong move alongside Bitcoin but has ultimately been boring. Investors struggle the most with boredom and see is as negative and bearish. This is not the case and it could just be accumulating towards a strong breakout.
Price is stalling at the weekly pivot as expected but is above the 200EMA- a great buy spot. Wave (II) appears complete at the 0.5 Fibonacci retracement with a swing below the lower boundary trend-line. Wave 3 of (III) appears to be underway so I am looking for an aggressive breakout to the upside once we clear the current resistance. The R1 pivot is the first target at $30 where the last bit of major resistance is. Wave (III) has a target of $83 at the next major High Volume Node resistance, just above the R5 pivot.
🎯 Terminal target for the business cycle could see prices as high as $80 based on Fibonacci extensions and High Volume Nodes
📈 Weekly RSI is at the EQ.
👉 Analysis is invalidated if we close back below wave 2 at $9.50.
MSTR still in wave 4 rangeNASDAQ:MSTR Price is still in a wave (IV) which are expected to be long and drawn out, yet shallow which is what we have here. I don’t expect wave (V) to kick in until Bitcoin moves. Wave (V) has an expected of the R3 daily pivot at $1039 but will overextend if Bitcoin does.
Price has fallen out of the lower channel boundary and sitting at the weekly pivot, still above the weekly 200EMA so the outlook us bullish. wave (4) may complete at the 0.236 Fibonacci retracement at $203. For now I am waiting to see what happens before entering but believe good opportunities are setting up.
Safe trading
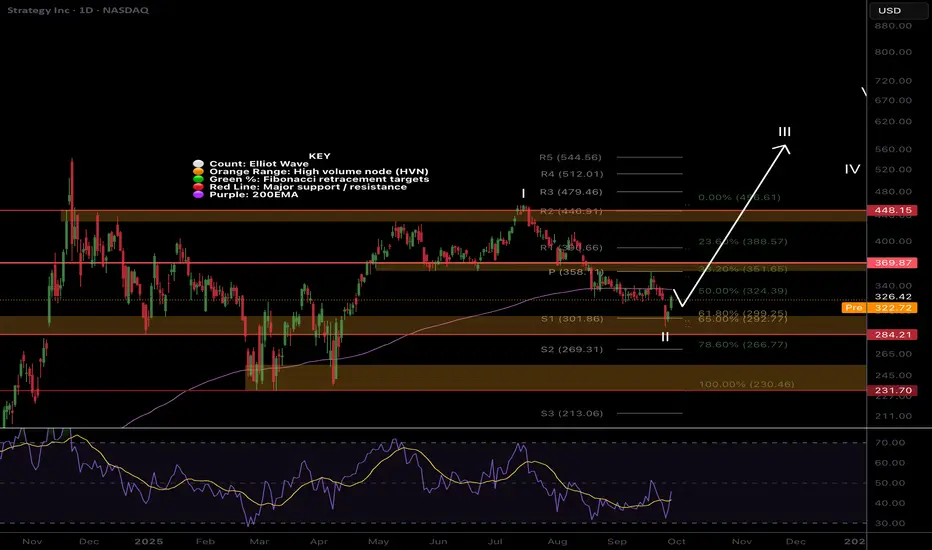
MSTR Wave II bottom?NASDAQ:MSTR is finally catching a bid from the triple support zone of the Fibonacci golden pocket, S1 pivot and High Volume Node.
It must overcome the daily 200EMA to add confidence to a reversal and wave II bottom being in.
Daily RSI has printed bullish divergence from oversold. Vanguard disclosed massive MSTR holdings ad the sentiment is awful online adding confluence to a bottom soon.
Wave III target is the R5 daily pivot $544, losing the support zone has a downside target of $232
Safe trading
MARA Huge bullish engulfing!NASDAQ:MARA had a huge bullish engulfing candle yesterdays almost eclipsing 9 days of price action in 1 session, a characteristic candle for wave 3!
Partial take profit target for me is the High Volume Node between the R4 and R5 pivot, $20, where I expect price to struggle before more upside. Next target is $28 at the descending macro resistance trend-line.
RSI didn't hit overbought and was rejected back to EQ resetting for higher.
Safe trading

MARA Wave III Underway!Local Analysis / Targets / Elliot Wave
MARA appears to have begun wave III with a rally out of the range and above the daily 200EMA. Wave III has a price target of the High Volume Node resistance at $31 but with the current tailwindsI I expect to overextend.
RSI is overbought and there is looming resistance from the wave 1 high just ahead. Traders should be cautious of this resistance and expect a range below for a while.
Standard Deviation Band Analysis
Standard deviation bands shows price coming into the fair value regression line as resistance. A breakout above this will bring up the SD+2 threshold target of $55. Bands offered a great buy opportunity when price dipped into the green opportunity zone at $3.
Safe trading

SBET vs DFDV: Which Crypto Treasury Horse Will Run Fastest?SharpLink Gaming (SBET) and DeFi Development Corp. (DFDV) are prime examples of the MicroStrategy model applied to different digital assets, Ethereum and Solana, respectively.
SharpLink Gaming, formerly an online gaming company, has made a dramatic and public pivot to become one of the world's largest corporate holders of Ether (ETH). Its strategy is to act as a direct and transparent vehicle for investors to gain exposure to the Ethereum ecosystem. The company actively raises significant capital through equity offerings, such as its recent multi-billion dollar ATM program, to fund its ETH acquisitions. It also generates yield by staking its ETH, which is a key part of its business model. The company's stock price and market narrative are now almost exclusively tied to the performance of its growing ETH treasury, making it a high-beta proxy for Ethereum.
DeFi Development Corp. has a similar, dedicated focus on Solana (SOL). The company's business is centered on accumulating, compounding, and providing exposure to SOL. DFDV's core strategy is to grow its "SOL per share" metric, which is its equivalent to MicroStrategy's Bitcoin per share. To achieve this, DFDV also engages in aggressive capital raises. Like SharpLink, it also generates revenue by actively participating in the ecosystem through staking, operating its own validator nodes, and exploring other on-chain opportunities.
In essence, both companies have fundamentally transformed their business models to serve as publicly-traded, regulated treasury vehicles for their respective assets. They both use financial engineering, like capital raises, to grow their holdings and create a leveraged play for investors. The primary difference is the underlying asset—ETH for SBET and SOL for DFDV—and the specific ecosystem activities they engage in to generate additional value beyond simple price appreciation.
Market Cap
Comparing the market capitalization of Ethereum (ETH) and Solana (SOL) is crucial for understanding the capital flows needed for one to outperform the other. As of late August 2025, ETH's market cap is approximately $429 billion, while SOL's is about $87 billion, meaning ETH is nearly 5 times larger.
For SOL to outperform ETH, it must grow at a much faster rate. Due to its smaller size, SOL requires a proportionally smaller amount of new capital to achieve a significant price increase. For example, to close the market cap gap by 10%, SOL would need an additional $43 billion in inflows, which would cause its price to more than double. In contrast, for ETH to achieve the same proportional gain (e.g., a 10% increase), it would need over $40 billion in new capital inflows.
Essentially, SOL has a higher beta and a lower monetary hurdle to achieve significant percentage gains. A steady inflow of tens of billions of dollars would have a much more dramatic impact on SOL's price than on ETH's. However, with ETH's sheer size and institutional backing, particularly with the recent launch of spot ETFs, it can absorb and channel much larger capital flows, which is a key reason its price is less volatile. Therefore, SOL's smaller size makes it more sensitive to inflows, making it easier for it to outperform ETH on a percentage basis, especially during a retail-driven bull market.
Impact of Spot ETFs
A significant number of spot Ethereum ETFs have already been approved and are trading in the United States. Following the approval of the initial 19b-4 filings in May 2024, the SEC subsequently declared several S-1 registration statements effective in July 2024, allowing the ETFs to begin trading. There are currently nine SEC-approved spot ETH ETFs from major issuers like BlackRock, Fidelity, and Grayscale. There are currently no approved SOL spot ETFs in the United States. However, several applications are under active consideration by the SEC. Filings from major issuers such as Bitwise and 21Shares have been submitted, but the SEC has consistently delayed its decision on them. There is a general expectation that if the SEC continues to follow the precedent set by Bitcoin and Ethereum, a Solana ETF could be the next in line for approval. In summary, a clear distinction exists: ETH spot ETFs are a reality, with multiple products already trading, while SOL spot ETFs are still in the application and review phase, awaiting a decision from the SEC.
Summary
While ETH has had relative outperformance in August 2025 against Bitcoin and most large-cap alts, the approval of Solana spot ETFs will provide a significant tailwind for SOL and SOL treasury companies like DFDV. While Ethereum is the strongest horse among the alts, has experienced no downtime, and gas fee transactions on the main chain have become much cheaper than they were the last cycle, hot money will quickly allocate capital towards the highest-beta alts and crypto treasury companies as ETFs are approved; possibly on a rolling basis if underlying assets are approved at different times in Q4. However, expect ETH and SBET to do exceptional through 2026 as ETH hits mainstream adoption through ERC-20 based tokenized stocks, prediction markets, etc. and as spot ETF inflows accelerate.

$MARA Setting Up for A Huge Move?This stocks price action has been subdued far too long after they sold shares to investors but should be moving more aggressively alongside Bitcoin, being the second largest holder of BTC in its treasury.
Price appears to have completed an awkward wave 1 potentially a leading diagonal with wave 2 now underway while price is under the daily and weekly 200EMA. Wave 2 target is a little bit lower in the Fibonacci retracement golden pocket and major High Volume Node support $13.19.
Daily RSI has made its way lower currently showing bullish divergence. If the count is right wave 3 should be hard and fast!
Bitcoin stocks have all had a decent retracement causing me to upgrade my Elliot Wave count to a completed macro wave 1 with wave 2 now underway, suggesting the best returns are still to come over the next months for this category asset class in wave 3!
Analysis is invalidated if we go to new highs above $21.5 or lose $9.85
New long signals are certainly building in the DEMA PBR and Price Action strategies so keep an eye out on the Trade Signals Substack as we have made very food profits lately in these markets!
Safe trading
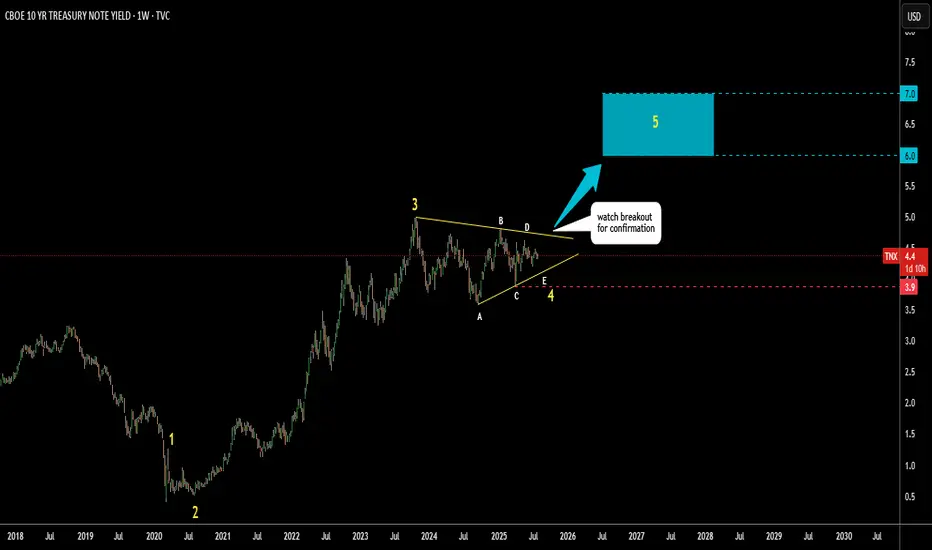
US 10Y yield: Triangular Consolidation, next 6-7%I’ve spotted a well-known triangular pattern forming on the US 10-year Treasury yield.
This appears to be the development of a large Wave 4.
Wave E of Wave 4 may still be unfolding.
Watch to see if it holds above the Wave C low at 3.9%.
A breakout above resistance near 4.7% would confirm the pattern.
The target zone is set between the 38.2% and 61.8% retracement levels of Waves 1 to 3,
highlighted with a blue box between 6% and 7%.
Could tariffs cause a major spike in yields—or will something else trigger it?
Share your thoughts in the comments below.
US10Y Technical Breakdown – Post-Moody’s DowngradeMoody’s has downgraded the US credit rating for the first time since 2011, citing rising debt levels and long-term fiscal challenges.
This move sends a clear warning signal about America’s fiscal path and adds fresh uncertainty to markets already navigating interest rates, inflation, and geopolitical risks.
Focus on the US 10-Year Treasury Yield as the market’s pulse on sovereign risk, inflation expectations, and future borrowing costs. Tracking its medium-term trend will provide crucial clues on market sentiment and risk appetite.
Medium-Term Market Analysis
(6-12 Months)
1. Structural Fiscal Risks
This downgrade highlights growing concerns over the US debt trajectory and political gridlock around spending and debt ceilings.
It’s less about an immediate crisis, more about long-term sustainability.
2. Rising Yields and Market Volatility
The 10-year Treasury yield could move higher, beyond 4.60% we could see rates possibly testing previous resistance of 4.80% (Jan 2025) or 5.00% (Oct 2023).
Higher yields mean increased borrowing costs, which can pressure interest-sensitive sectors like tech and real estate and add volatility to equities.
3. Federal Reserve’s Tough Balancing Act
With bond yields edging up, the Fed faces a dilemma: delaying cuts further could risk inflation climbing higher.
However, this downgrade raises the likelihood that the Fed could keep rates higher for longer than many investors expect.
4. Dollar and Capital Flow Shifts
While a credit downgrade may initially pressure the US dollar, its safe-haven status remains strong.
Global capital could increasingly look to alternatives like emerging markets or gold, leading to shifts in international financial flows.
Perspective
While Moody’s downgrade is a serious signal, it’s important to consider:
1) Political Leverage: Sometimes, rating agencies’ decisions can influence political negotiations. This downgrade may add pressure on US lawmakers to reach fiscal compromises. It’s a tool, not necessarily a verdict.
2) US Dollar & Debt Demand Resilience: Despite concerns, US Treasury securities remain the world’s primary safe asset, with global demand still robust. This could temper yield spikes and limit fallout.
Some could view the downgrade as “priced in” to a degree, given ongoing debt ceiling battles and past political brinkmanship.
If true, markets may react less dramatically than feared.
Watch
US 10-Year Yield: Key indicator to watch for shifts in risk sentiment and inflation expectations.
Equities: Prepare for increased volatility; consider defensive sectors and value plays.
Credit Markets: Monitor for widening spreads as risk aversion grows.
Policy Signals: Fed communications and US political developments will be critical catalysts.
This Moody’s downgrade isn’t just a headline, it’s a medium-term signal to recalibrate risk and position for a more uncertain fiscal backdrop.

USTEC rose after avoiding Lutnick as a Treasury Secretary
The Nasdaq index has surged, fueled by solid expectations surrounding Nvidia's Q3 earnings and the alleviation of uncertainty following the appointment of the new Treasury Secretary.
Investors are breathing a sigh of relief as Howard Lutnick, a staunch supporter of Trump's tariff policies, has been nominated for Commerce Secretary rather than Treasury Secretary. In contrast, Kevin Warsh, who is running for Treasury Secretary, has openly criticized protectionist measures such as tariffs. This shift has heightened expectations that some economic issues stemming from Trump’s tariff policies will be mitigated.
Furthermore, Wall Street consistently raises Nvidia's target stock price. Investors anticipate that Nvidia's Q3 earnings will surpass market consensus, and Wall Street confidently anticipates that the Q4 guidance will also exceed expectations.
USTEC briefly tested the support at 20300 and rebounded to 20770. The index sustains upward momentum, holding above the trend line. If USTEC sustains its upward trend above the resistance at 20700, the index could gain upward momentum toward the 21250 high. Conversely, if USTEC fails to hold above the trend line and 20300, the index may fall further to 19950.

TLT +50% Every Time This Happens and It's Happening NowTLT/SPX Monthly RSI (8 Period Close)
It makes sense to analyze the most common institutional portfolio allocation (Equities and Bonds) rather than Equities or Bonds separately. Most investors focus on Fed Funds, unemployment, the business cycle, rates, to analyze the bond market. But those metrics are poorly correlated to returns at best. When you focus on allocation, as in Bonds plus Equities, you start making some progress. That's exactly what this chart represents; where the money is going and when. Hint: it's going into Bonds. Soon.
BBOT (Bonds Blast Off Time) is here

Bitcoin - Another sign that Fed credibility is waning.A Sick Feeling in the Belly of the Yield Curve
Another sign that Fed credibility is waning.
The socioeconomic point of view is that, as the Supercycle bear market develops, central banks will lose their mantle as being omnipotent directors of markets. Whereas in the bull market, central bankers like Alan “the Maestro” Greenspan were lauded because positive social mood was driving the stock market higher, in the bear market central bankers will be vilified as negative social mood causes a downtrend in stock prices.
Yesterday, Fed Chairman Jerome Powell sought to reassure Americans that the series of interest rate hikes that the central bank is embarking on would not tip the U.S. economy into recession. The bond market promptly ignored those soothing words and the yield curve flattened. A flattening yield curve, whereby the positive gap between short-dated bonds and long-dated bonds is narrowing, is a sign that the market is anticipating slower economic growth. When the yield curve inverts, with long-dated yields below short-dated, it has historically been a signal that an economic recession is on the horizon.
That historical relationship is most generally related to the yield spread between 2-year yields and 10-year yields, and that yield curve has been flattening over the past year from 1.50% to around 0.20% where it is currently hovering. So, not quite inverted yet, but trending in that direction.
However, in the so-called belly of the yield curve, the area between 5 and 10-year maturity, the message is already here. The chart below shows that the yield spread between 5 and 10-year U.S. Treasury yields has declined precipitously over the last year and, yesterday, turned negative. This yield curve inversion is a clue that a 2-yr /10-yr (2s 10s in industry vernacular) inversion is probably on its way.
Despite what the Fed says, a beast of a recession may be approaching.
U.S. Treasury 10-Year Yield Minus 5-Year Yield

USDJPY Analysis: Potential Bullish Bias for the Upcoming Week!USDJPY Analysis: Potential Bullish Bias for the Upcoming Week (Sept 23-29, 2024)
As we look ahead to the coming week, USDJPY appears poised for a potential slightly bullish bias. This outlook is based on a confluence of fundamental factors and current market conditions that favor USD strength relative to the Japanese yen. Below is a breakdown of key drivers supporting this outlook, along with insights that could influence price action.
1. Federal Reserve's Hawkish Stance
One of the key drivers for a potential bullish bias in USDJPY next week is the persistent hawkish tone from the Federal Reserve. Although the Fed opted to pause rate hikes in September, policymakers have indicated that they are open to further tightening if inflationary pressures persist. Recent inflation data in the U.S. showed a slight uptick in the Consumer Price Index (CPI), suggesting that the Fed may still consider additional rate hikes in 2024. Higher U.S. interest rates would continue to bolster the U.S. dollar, driving demand for USDJPY as traders seek yield differentials.
2. Bank of Japan's Dovish Policy
In stark contrast to the Fed, the Bank of Japan (BoJ) remains committed to its ultra-loose monetary policy, including negative interest rates and yield curve control. The BoJ's dovish approach continues to weigh on the Japanese yen, especially in an environment where other major central banks are tightening monetary policy. While some market participants expect the BoJ to consider policy changes in the future, there have been no concrete signals indicating a shift in the near term. This widening policy divergence between the Fed and BoJ is a key factor supporting a bullish outlook for USDJPY.
3. Safe Haven Demand Waning
The yen is traditionally viewed as a safe-haven asset, particularly during periods of global market volatility. However, recent market stability, coupled with optimism surrounding global growth prospects, has reduced demand for the yen as a haven. As risk sentiment improves, investors are more likely to allocate capital into higher-yielding assets, which could further weaken the yen.
Moreover, geopolitical tensions that previously supported yen demand have eased slightly, making USDJPY more likely to drift higher in a low-risk environment.
4. U.S. Treasury Yields Rising
Another factor contributing to the bullish bias in USDJPY is the rise in U.S. Treasury yields. Higher yields on U.S. government bonds make the dollar more attractive to foreign investors, adding upward pressure to USDJPY. The correlation between USDJPY and U.S. Treasury yields is well-documented, and as yields rise, so too does the currency pair. Traders will be closely monitoring U.S. economic data next week, including durable goods orders and GDP figures, to gauge the potential for further yield increases.
5. Technical Analysis: Key Support and Resistance Levels
From a technical perspective, USDJPY is trading within a well-defined range, but with a slight bullish bias as long as it holds above key support at the 147.50 level. A break above the psychological 150.00 level could open the door to further upside, with resistance seen at 151.50. On the downside, failure to hold above 147.50 could lead to a test of lower levels around 146.00. Momentum indicators, including the Relative Strength Index (RSI), are currently neutral but leaning slightly toward overbought territory, suggesting room for further gains before a pullback.
6. U.S. Economic Data Next Week
Next week, market participants will pay close attention to several high-impact economic reports out of the U.S., including the Durable Goods Orders on Tuesday and GDP Growth on Thursday. Positive readings on these metrics could fuel further gains in USDJPY, reinforcing the bullish bias. Conversely, any disappointing data could dampen USD strength and lead to some consolidation in the pair.
Conclusion
Given the combination of hawkish signals from the Fed, the BoJ's ongoing dovish stance, rising U.S. Treasury yields, and waning safe-haven demand, USDJPY appears to have a slightly bullish bias heading into next week. Traders should watch for any shifts in risk sentiment or unexpected economic data that could alter this outlook. The key levels to watch are 147.50 for support and 150.00 for resistance.
Keywords: USDJPY forecast, USDJPY bullish, USDJPY analysis, Bank of Japan policy, Federal Reserve rate hikes, U.S. Treasury yields, Japanese yen, safe-haven demand, forex trading, USDJPY technical analysis, USDJPY key levels, USDJPY next week, trading USDJPY.

10yr Treasury Yields Consolidate at Key 4.32% LevelThe world’s most important market, the 10yr US Treasury, is trading directly at a critical level. Going back years, the 4.32% level has served as reliable support/resistance, and today’s drop after peeking above that level yesterday has only emphasized the importance of that key level.
At the same time, the 10yr Treasury yield has put in a series of lower highs and higher lows dating back to Q4 of last year, creating a symmetrical triangle pattern that could lead to an outbreak of volatility in the coming weeks. A bullish breakout above 4.60% would hint at a possible retest of 5.00% (and likely weigh on risk assets like stocks and higher-yielding currencies), whereas a bearish breakdown in yields would open the door for a drop toward the December lows near 3.80%.
-MW

How CPI News Impacts Gold PricesGold prices are affected by Treasury yields and Consumer Price Index (CPI) data. High inflation typically leads to higher Treasury yields due to low unemployment and an overheating economy, which can decrease gold's appeal due to rising unemployment, making gold more attractive as a safe investment. Thus, gold tends to decline with high Treasury yields in inflationary times and increase when Treasury yields fall during deflationary periods.

Short term yields still weak, longer term reversedWhat a difference 11 hours makes.
The 1 & 2 Yr #Yield are STILL under resistance & are weakening.
10 & 30 Yr completely reversed once markets opened. But this tends to be normal, pretty frequent.
This is why waiting for a CLOSE is of utmost importance. IF we CLOSE here, last night's thinking is NO MORE and the best plan of action is to WAIT.
TVC:TNX

Interest Rates NOT showing cuts...Let's keep looking at #InterestRates. Gives us an idea of what the Fed may do.
The 1 & 2 Year are still under their RESISTANCE level. Struggling a bit, but not breaking down. Trend is still there, weak though.
10 Yr looks like it wants to break the resistance zone.
30 YR looks like it's gone. Does not look like it wants to retrace at the moment.
#FederalReserve TVC:TNX
