Inflation SupercycleOn the afternoon of October 3rd, 2023 something unprecedented happened in the U.S. Treasury market. For the first time ever, bear steepening caused the 20-year U.S. Treasury yield and the 2-year U.S. Treasury yield to uninvert.
Bear steepening refers to a scenario in which long-duration bond yields rise faster than short-duration bond yields, as bond yields rise across the term structure. In all past instances, inverted yield curves have normalized due to bull steepening . The probability that bear steepening would cause an inverted yield curve to normalize is so low that, until now, most term structure models excluded the possibility of it ever happening. In this post, I'll explain why this anomalous event is a major stagflation warning.
The chart above shows that the 10-year Treasury yield has been rising much faster than the 3-month Treasury yield throughout 2023, narrowing the once-deep yield curve inversion.
Since a yield curve inversion indicates that a recession is coming, and bear steepening indicates that the market is pricing in higher inflation for the short term, and even more so, for the long term, then bear steepening during a yield curve inversion indicates that high inflation may persist even during the recessionary phase. High inflation during the recessionary period is what defines stagflation . Since very strong bear steepening is normalizing a deeply inverted yield curve, the combination of these events is a warning that severe stagflation is likely coming.
High inflation has caused Treasury yields to surge at an astronomical rate of change. Bond prices, which move in the opposite direction as yields, have sharply declined causing destabilizing losses. The effects of these massive bond losses are not even close to being fully realized by the broad economy.
The image above shows a bond ETF heatmap with year-to-date returns. Large losses have been mounting across numerous bond ETFs. Long-duration Treasury ETF NASDAQ:TLT has declined by more than 18% this year. Click here to interact with the bond ETF heatmap
Despite the extreme pace of monetary tightening, many central banks are still struggling to contain inflation. Inflationary fiscal spending and ballooning debt-to-GDP levels are confounding central bank monetary policy efforts. In Argentina, for example, inflation continues to spiral higher despite the central bank raising interest rates to 133%.
The chart above shows that the central bank of Argentina has hiked interest rates to 133%. Despite this extreme interest rate, the country's inflation rate continues to spiral higher. In an inflationary spiral, there is no upper limit to how high interest rates can go.
As the Federal Reserve tightens the supply of the U.S. dollar -- the predominant global reserve currency -- all other countries (with less demanded fiat currency) generally must tighten their monetary supply by a greater degree in order to contain inflation. If a country fails to maintain tighter monetary conditions than the Federal Reserve, then the supply of that country's (lesser demanded) fiat currency will grow against the supply of the (greater demanded, and scarcer) U.S. dollar, causing devaluation of the former against the latter. In effect, by controlling the global reserve currency, the Federal Reserve is able to export inflation to other countries. This phenomenon is explained by the Dollar Milkshake Theory .
The forex chart above shows FX:USDJPY pushing up against 150 yen to the dollar. The longer the Bank of Japan continues to maintain significantly looser monetary conditions than the Fed, the longer the yen will continue to devalue against the U.S. dollar.
The meteoric rise in bond yields is particularly concerning because it has broken the long-term downtrend, signaling the start of a new supercycle. After hitting the zero lower bound in 2020, yields have rebounded and pierced through long-term resistance levels.
The chart above shows that the 10-year U.S. Treasury yield broke above long-term resistance, ending the period of declining interest rates that characterized the monetary easing supercycle.
We've entered into a new supercycle, one in which lower interest rates over time are a thing of the past. The new supercycle will be characterized by persistently high inflation. It will start off insidiously, with brief periods of disinflation, but over the long term it will accelerate higher and higher, ultimately causing today's fiat currencies to meet the same fate that every fiat currency in history has met: hyperinflation.
* * *
Important Disclaimer
Nothing in this post should be considered financial advice. Trading and investing always involve risks and one should carefully review all such risks before making a trade or investment decision. Do not buy or sell any security based on anything in this post. Please consult with a financial advisor before making any financial decisions. This post is for educational purposes only.
Treasury

Yields Surging / TLT FallingThe technical weekly uptrend that yields have formed is rather astonishing.
The sheer power of this move suggests likely more upside yields. Some basic measured moves suggest a potential whopping 5.7% on the 20 year.
Imagine TLT long bond traders!
Nothing is probable but it makes you wonder if inflation is becoming more entrenched since the bond market is very forward looking.

Bond Yield Inversion vs. SPXThis is nothing new, really. People who have been in markets long enough know that when short term bond yields (3 month and 2 year, for example) come up to meet and invert to a higher yield than longer term bonds (like the 10 year, 30 year etc) that it often precedes a large market sell off as well as a recession that affects most everyone, not just stock prices.
On this graph, I maybe got a little carried away. I have the 1 month, 3 month, 1 year, 2 year, 10 year and 30 year as well as the actual Fed Funds rate with SPX in the background.
This goes back to the mid 1990s, you can see the dotcom boom, you see the yields invert, SPX tops and then takes near 3 years to finally find bottom before reversing course.
Unfortunately for long only stock holders, the treasury yields started to climb with stocks as well until they inverted in 2007 once more. Stocks started to come down, and, well, then 2008 happened...
You can see that in general, the fed funds and the shorter term yields find a plateau at their top, tend to stay there for awhile (sometimes for a whole year), then as they start to come back down, the stock market tends to be near its highs, and then the stock market starts to come down.
Big money tends to see higher treasury yields as a safer haven for their money than stocks at this point. If you have the ability to hold the treasury to expiration, you're guaranteed to get 100% of the money back plus whatever the yield % was at time of purchase as interest paid to you by the government.
Furthermore, there is an inverse relationship between bond yield percentage going up, and the value of bonds on the open market. As yields go up, the value of bonds goes down. Vice versa, as yields start to retract, bond values go up. So, there is high incentive to start buying a lot of bonds as the rates plateau near the top. Maybe some of these large hedges start to sell some equities as a hedge and buy more bonds as we get to that point. Rebalance their portfolio to be more bond-heavy.
Higher short term yields, higher fed funds rate also generally mean that the cost to borrow money for anyone is higher. Higher interest rates means more money out of the pocket of anyone borrowing to pay interest. Bonds themselves are just government debt.
The stock market is generally forward looking, so it's often making moves in response to moves in the bond market before main street really starts to feel the effects of the tightening in a meaningful sense. As time has gone on, it seems the market is reacting earlier and earlier to rate hike cycles.
Take 2018 for example, the yields didn't really invert until they all were already on their way back down. 2018 had volmeggedon to deal with to start the year, then came back, set a new high, then had a very rough second half of the year as bond yields plateaued. But, as the market saw that this small rate hike cycle didn't do any meaningful harm to the economy and started retracting, stocks took off again:
Then COVID happened, yields plummet, cost to borrow was as cheap as it ever has been, the government pumped money everywhere to try and prevent a complete collapse of everything, stocks were off to the races harder than ever before after finding bottom just a few weeks into the pandemic.
But, mentioning the market kind-of getting ahead of itself again, we had all of 2022, as it became apparent that inflation was now raging and bigger rate hikes than we've seen since the Great Financial Crisis would be necessary, the stock market sold off despite the economy still showing very solid recovery out of the pandemic.
But now, treasury yields are still climbing, but so are stocks. Treasuries hit a little hiccup in March as a couple regional banks were found to be overlevered in treasuries that had too low of a yield, and as more people began withdrawing money and those banks needed liquidity, they had to sell those treasuries at a loss. If they didn't have to come up with that liquidity and were able to allow those treasuries to mature, they make that small percent of interest for holding them. But because they were forced to sell them as treasury values were at a low because they had inadequate liquidity to cover deposits being withdrawn.
But, now maybe surprisingly, despite some of the troubles and the market sell off for most of 2022, we're now not all that far off of CBOE:SPX 's highs from the end of 2021, start of 2022. But, we still don't know what the full effect of the current high interest rates are going to be. It's possible the old mechanism where when we finally reach the top for interest rates, right as we get the precipice of rates starting to fall, equities top out and start to sell off shortly thereafter again. For how big and how long? Who knows.
Despite the recent 'skip' from the federal reserve, opting to not hike at the June meeting, the 3 month yield, which typically is what most closely matches/leads what the fed is going to hike to, has in recent days made it look increasingly likely that we see at least a quarter point hike for July. The market probably won't like that news, maybe we get a few red days, but if economy data coming in still looks solid and inflation is showing a slow, steady reduction, it may not be long before the market decides to go back up again. We might even go past the 2021/early 2022 highs this year.
But, eventually, we'll find the top for yields, and I have a feeling a bigger correction for stocks will loom at that point. For right now, seems like a bad idea to go against the bulls. But, keep an eye out for when we finally reach the top in treasury yields, look in particular for the 3 month, fed funds and the 2 year to go sideways. Once all 3 start to go down, pay closer attention to economic data coming in. Also take a look at www.tradingview.com for evidence of lower highs off the lowest point for the current cycle. You see the combination of the two, we may be in for a big correction. Again.

Recap of my trade for today on ZB1!Good afternoon and good evening dear traders!
At the morning I shared a post where I said to sell ZB1!, it's too late but you still have made some profits if you got in early. For my clients and I it was a good day in ZB1! and NATURAL GAS, we could make some good profits on the 4% drop of the NATURAL GAS and on the 1% of the ZB1!, I didn't share the NATURAL GAS one since I already posted the ZB1! one and I can't give the trades I give privately.
See you tomorrow on another forerecast!
If you got any question don't hesitate to ask!

No Landing in the Twilight ZoneCBOT: Micro Treasury Yields ( CBOT_MINI:2YY1! , CBOT_MINI:5YY1! , CBOT_MINI:10Y1! , CBOT_MINI:30Y1! )
Is the US economy heading towards a “no landing”, as opposed to a “hard landing” or a “soft landing"? There is a heated debate among economists and market strategists.
What is a "no landing"? It is a new term drawn up by Wall Street, which describes the economy continuing to grow while the Fed raises interest rates to fight inflation.
Stock investors have a hard time making sense of the latest data from inflation, employment, and corporate earnings. The Fed’s future policy actions are unclear. As a result, the US stock market moved sideways in recent weeks.
Treasury Market in Disarray
With a widening negative yield curve, bond investors are convinced that a US economic recession is on the horizon. Let’s refresh our knowledge on this subject.
Yield curve shows interest rates on Treasury bonds with short-term, intermediate, and long-term maturities, notably 3-month T-Bill, 2-year and 10-year T-Notes, 15-year and 30-year T-Bonds.
Bond investors expect to be paid more for locking up their money for a long stretch, so interest rates on long-term debt are usually higher than those on short-term. Plotted out on a chart, the various yields for bonds create an upward sloping line.
Sometimes short-term rates rise above long-term ones. That downward sloping line is called yield curve inversion or negative yield curve. An inversion has preceded every U.S. recession for the past 50 years. It’s considered a leading indicator of economic downturn.
On July 21st 2022, the 2-year yield stood at 3.00%, above the 2.91% 10-year yield. Since then, we have been in negative yield curve environment for seven months. The 10Y-2Y yield spread has widened to -76.9 bps, but a recession has not yet occurred.
Below are current yields indicated by CBOT Treasury futures as of February 17th:
• 30-day Fed Funds: 4.665%
• 2-year Treasury: 4.618%
• 5-year Treasury: 4.014%
• 10-year Treasury: 3.848%
• 30-year Treasury: 3.883%
We observe that the longer the duration, the lower the yield. The 5Y, 10Y and 30Y yields all price below current Fed Funds rate target of 4.50-4.75%.
The US economy seems surprisingly strong, despite the Fed trying to cool it with eight consecutive rate hikes. However, negative yield curve contradicts the notion of “No Landing”.
Trading Opportunities in Micro Yield Futures
Investors currently expect the Fed to raise interest rates in March and June meetings, with the terminal rate consensus at 5.3% at the end of this tightening cycle.
Clearly, Treasury futures market has not priced in the pending rate hikes. The most underpriced interest rate is the 10-year yield. At 3.85%, it is 90 bps below current Fed Funds target and 1.45% below expected terminal rate.
On February 17th, the February and March 2023 contracts of CBOT 10-Year Micro Yield Futures (10Y) were quoted almost the same rate, at 3.850% and 3.853%, respectively. Investors apparently brushed off the upcoming rate increase in March.
My trading rationale: US businesses continue to expand, which provides solid support for the long-term debt market. With short-term yield rising fast, borrowers would flock to lower rate debt, pushing up demand for the longer-term credit. In my opinion, a 10-year yield below 4% is not sustainable.
For confirmation, let’s take a look at various market interest rates for 10-year duration:
• US Corporate AAA Effective Yield: 4.61%
• US Corporate BBB Effective Yield: 5.64%
• US Mortgage Rate, 10-year fixed: 6.24%
• Bank Certificate of Deposit, 10-year: 4.10% (Discover Bank)
Monthly contracts for the 10Y are listed for 2 consecutive months. Contract notional value is 1,000 index points. A minimum tick of 0.001 (1/10 of 1 bps) is worth $1. This means that a 25-bps increase will translate into $250 per contract. It would be a 77% gain in contract value if we use the $325 initial margin as a cost base.
April contract starts trading on March 1st. If it is quoted similar to the March contract, there is potential to gain. Whether we compare with market rates of debt instruments of the same 10-year duration, or with risk-free Treasury rates of different durations, a 10-year yield pricing below 4% is a bargain. Besides, the FOMC meeting on March 21st-22nd would likely give the contract a big boost, as long as the Fed raises rates. In summary, I would consider a long position for April 10Y contract at or below 4% yield.
What about the idea of yield curve reversal and the narrowing of 10Y-2Y spread? It may still happen, but its timing is unclear at this point.
Micro Yield futures are designed for shorter-term trading with contracts listing for only two calendar months. This is different from CBOT 2-year (ZT) and 10-year (ZN) futures which are listed for 3 consecutive quarters, currently through September. The traditional Treasury futures contracts would be better instruments for a yield spread strategy.
Happy Trading.
Disclaimers
*Trade ideas cited above are for illustration only, as an integral part of a case study to demonstrate the fundamental concepts in risk management under the market scenarios being discussed. They shall not be construed as investment recommendations or advice. Nor are they used to promote any specific products, or services.
CME Real-time Market Data help identify trade set-ups and express my market views. If you have futures in your trading portfolio, check out on CME Group data plans in TradingView that suit your trading needs www.tradingview.com

T10-2Y Treasury Yield - Monthly ChartI tried to predict Treasury yield cycle using Trent lines.
I would like to see if the treasury yield follow the cycle along the trend lines.

Bonds Retrace from our LevelBonds hit resistance at 111'26, dipping back to support at 110'27. We anticipated this in our reports yesterday. It is likely we will continue the sideways correction from here, bound between these two levels. If ZN can break out, then 113'12 is the next target. We expect 110'05 to be a floor for now.

BNX [ TA ] One would like to say " Just buy and hold ".
This is a hidden bull market - it is possible that it will surprise us more than once again

Master of MarketsIn 2008 the U.S. central bank purchased
$1.25 trillion in mortgage-backed securities
$200 billion in agency debt
$300 billion in long-term Treasury securities
2008 was named QE1 and would continue for the next 6 years before the FED paused and eventually began to tighten.
During times of QE, banks, companies, markets all perform great.
There is plenty of liquidity to operate, margin is cheap.
When the fed tightens, markets get volatile.
Margin becomes expensive.
Most companies will survive this volatility.
They just pass the cost on to the consumer.
This creates inflation. Sticky inflation. Fed has to tighten more to fight inflation.
At this point it’s all they can do. But they risk crashing the markets.
The fed controls just how much air is let out and how fast.
That’s why you saw Jay Powell start with easing, into light QT and now in September the amounts they will be selling are very likely to put more down pressure on the markets.
Just realize the FED can manage the market pressure, it’s the unexpected events during times of low liquidity and high volatility that concerns me.
See the effects of Net liquidity on VIX over the past 15 years.
Never reaching above 30 except during extreme events like the flash crash and china crash..
You can see we’re in a time of extreme volatility as clusters of volatility reaching over 30 4 times since Nov 2021.
What is Net liquidity?
Net liquidity is a formula I found on Fintwit that is supposed to predict the markets movements 2 weeks in advance.
I don’t know if I believe that, but I did some Covariance analysis and there are certainly times during QE with high bullish correlation and QT there is high bearish correlations.
To determine Net Liquidity you need to take
The total assets of the Federal Reserve Balance sheet at 8.8 Trillion.
Subtract The Treasury General Account at 617 Billion
Then Subtract the 2.1T Overnight Reverse Repo
You get 5.9 Trillion in Net Liquidity.
Changes in the level of Net Liquidity (step up or step down) are claimed to predict the S&P 500 direction 2 weeks in advance.
The claim is that of a 95% correlation since the transitory quantitive easing and reverse repo were implemented.
I was curious to see if the claims were true.
More on that tomorrow.

Bonds Rise On WeeklyMonthly chart looks like we are topping on the US10Y. Weekly chart tells a different story. I believe the Weekly US10Y is telling us that fed is going to have to be more hawkish with interest rates on 21st September. We will see if i am right.

US 10y yield eyes 200day MA supportThe head and shoulders breakdown on the daily chart confirmed on July 18 opened doors for a roughly 70 basis points slide. That makes the 200-day moving average support, currently at 2.8%, pivotal.

Jamie Dimon’s Hurricane and the Bond Market in Early JuneIn 2021, as the US central bank and the Secretary of the Treasury continued to call rising inflation a “transitory” and pandemic-inspired event, the bond market declined. Bonds watched prices rise while the economists were pouring over stale data. Meanwhile, the Fed and government planted inflationary seeds that sprouted during the second half of 2020, bloomed in 2021, and grew into wild weeds in 2022. The consumer and producer price data began to flash a warning sign in 2021, with the economic condition rising to the highest level in over four decades. The Fed and the Treasury finally woke up. While the Biden administration was already “woke,” the data awakened them to a point where late last month, Treasury Secretary Janet Yellen admitted “transitory” was a mistake. However, there was no admission and self-realization that monetary and fiscal policies created the inflation, and ignoring the warning signs only made it worse.
A storm forecast from JP Morgan Chase’s leader
Bonds are sitting near the lows
The Fed’s FOMC meets on June 14 and 15
Higher rates are on the horizon
Expect lots of volatility in markets
The bond market was far ahead of the Fed and the Treasury, which should have been another warning sign. Consumer and producer prices have skyrocketed, and the central bank is using demand-side tools to address the economic fallout. Meanwhile, the war in Ukraine, sanctions on Russia, and Russian retaliation have only exacerbated the inflationary pressures, as they create supply-side issues making demand-side solutions impotent.
The Biden administration blames the rise in energy prices on Russia, but they were already rising before the invasion and sanctions. The shift in US energy policy to a greener path is equally responsible for record-high gasoline and other fuel prices.
At the end of 2021, a conventional 30-Year fixed-rate mortgage was just below the 3% level, and in less than six months, it rose to 5.5%. On a $300,000 loan, the move increases the monthly payment by $625, a significant rise. We are in the early days of an economic storm that began with the pandemic, continued with a lethargic Fed and government officials, and was exacerbated by the first major war in Europe since WW II. We have not seen the peak of the storm clouds gathering for more than two years.
A storm forecast from JP Morgan Chase’s leader
Jamie Dimon, the Chairman and CEO of JP Morgan Chase, called Bitcoin a “fraud.” A few short years ago, he said he would fire any trader “stupid” enough to trade cryptocurrencies on the bank’s behalf. As recently as late 2021, he said he believes Bitcoin is “worthless.” So far, he has been dead wrong on the asset class. The financial institution he heads replaced real estate with cryptocurrencies in late May, calling them a “preferred alternative asset.”
In his latest comments on markets across all asset classes, Mr. Dimon issued a warning. Quantitative tightening that will ramp up to $95 billion in reduced Fed bond holdings and the Ukraine war led him to tell market participants, “You’d better brace yourself. JP Morgan is bracing ourselves, and we’re going to be very conservative with our balance sheet.” He began by saying, “You know, I said there’s storm clouds, but I’m going to change it…it’s a hurricane.” Mr. Dimon believes QT and the war create substantial changes in the global flow of funds, with an uncertain impact. The leading US bank’s CEO is prepared for “at a minimum, huge volatility.”
His forecast on cryptos aside, the warning is a call to action. There is still time to hedge portfolios and establish a plan for the coming storm. Volatility is a nightmare for passive inventors, but it creates a paradise of opportunities for nimble disciplined traders with their fingers on the pulse of markets.
Bonds are sitting near the lows
Quantitative tightening not only removes the put under the bond market that had supported government-issued fixed income instruments since early 2020, but it also puts downward pressure on bonds and upward pressure on interest rates further out along the yield curve.
The long-term chart of the US 30-Year Treasury bond futures highlights the decline to the most recent low of 134-30, declining below the October 2018 136-16 low, and falling to the lowest level since July 2014. At the 135-20 level on June 10, the bonds are sitting close to an eight-year low, with the next technical support level at the December 2013 127-23 low.
The Fed’s FOMC meets on June 14 and 15
The market expects the US Federal Reserve to increase the Fed Funds Rate by 50 basis points this week at the June meeting. The move will put the short-term rate at the 1.25% to 1.50% level.
The Fed remains far behind the inflationary curve, with CPI and PPI data at an over four-decade high and coming in hotter each past month. While the central bank determines the short-term rate, the bond market has been screaming for the Fed to catch up, warning that inflationary pressures were mounting. The bottom fell out of the long bond futures in 2022 as the Fed began to tighten credit. However, the Fed’s economists will only put the short-term rate at 1.50%, with inflation running at many times that level. A 75 basis move to 1.75% would shock the market, which is not a path the Central Bank wants to follow.
Higher rates are on the horizon
The Fed may have awakened, realizing it must use monetary policy tools to address inflation, but the central bank remains groggy and slow to adjust rates to levels that would choke off rising prices. The economists do not have an easy job as they face supply-side economic problems created by the war in Ukraine. Had they been more agile in 2021 and nipped the rising inflation in the bud with a series of rate hikes, the US Fed would be better positioned to address what has become a no-win situation. The war has caused energy and food prices to soar with no central bank tools to manage the situation.
Last week, gasoline rose to a new high, crude oil was over $120 per barrel, natural gas was over $9.65 per MMBtu, and grain prices remained at elevated levels. Rate hikes and lower bond prices are not likely to cause prices to fall as US energy policy, sanctions on Russia, and Russian retaliation are supply-side issues that leave the central bank with few answers. Higher food and energy prices will keep the inflationary spiral going and will continue to push bond prices lower.
Expect lots of volatility in markets
The US and the world face an unprecedented period that began with the 2020 global pandemic. Artificially low interest rates and the government stimulus that addressed the pandemic were inflationary seeds. The pandemic-inspired supply chain bottlenecks exacerbated the inflationary pressures. A shift in US energy policy increased OPEC and Russia’s pricing power in traditional energy markets.
Meanwhile, the war in Ukraine has turbocharged the economic condition, making a solution challenging for the central bank. The current US Treasury Secretary, and former Fed Chair, Janet Yellen, once said that monetary policy works together with the government’s fiscal policies. In the current environment, fiscal policy and the geopolitical landscape have become the most significant factors for rising inflation.
Jamie Dimon is worried, and the head of the leading US financial institution is battening down the hatches on his balance sheet for a storm. Even though he was mistaken about cryptos, we should heed his warning and hope he is wrong. Markets reflect the economic and geopolitical landscapes, which are highly uncertain in June 2022.
Hedge those portfolios, and make sure you develop a plan for any risk positions. Expect the unexpected because 2022 is anything but a typical year in markets across all asset classes. Fasten your seatbelts for what could be a wild and turbulent ride over the coming months.
--
Trading advice given in this communication, if any, is based on information taken from trades and statistical services and other sources that we believe are reliable. The author does not guarantee that such information is accurate or complete and it should not be relied upon as such. Trading advice reflects the author’s good faith judgment at a specific time and is subject to change without notice. There is no guarantee that the advice the author provides will result in profitable trades. There is risk of loss in all futures and options trading. Any investment involves substantial risks, including, but not limited to, pricing volatility , inadequate liquidity, and the potential complete loss of principal. This article does not in any way constitute an offer or solicitation of an offer to buy or sell any investment, security, or commodity discussed herein, or any security in any jurisdiction in which such an offer would be unlawful under the securities laws of such jurisdiction.

US10Y (Elliot Wave Analysis - A tale of Balloons)The bounce up from pandemic bottom Is corrective, we have a failed wave down after the large ABC thus making it a wave X. Now we are completing the 2nd ABC or WXY pattern into Fib retracements.
Balloons dont follow rules and can fly high, but when they pop it is by all accounts... biblical.
Cheers

T10Y2Y Yield curve inversion potential crucial pointWhenever this chart crosses 0 it means the yield curve for the 2 and 10 year bond yields has inverted. Historically a significant economic downturn followed. It's not perfect but nonetheless I wanted to put this out there for feedback.
Thanks

Market tops after yield compressionThis is a chart showing treasury yields, color coded by duration (yellow is the 1 year, dark blue is the 30 year), with the $SPX in the lower frame. Each red line shows a major market top and how they relate to yield compression followed by inversion. It looks to me like shorter term yields always rise vs longer term yields quite awhile before bear markets occur (in the past its been months or years before). It also looks like short term yields are rising abnormally quickly this time.
Yield inversion is a huge red flag that a bear market is coming and I wonder how long we have this time before that happens.

10-Year Treasury Yield All Set for Summer 2019 Highs?Following another strong US CPI report, the 10-year Treasury yield surged above 2%, further pushing above peaks from late 2019 (1.9073 - 1.9718).
That has exposed peaks from summer 2019 as key resistance (2.1779 - 2.1431).
A bullish Golden Cross remains in play between the 20- and 50-day Simple Moving Averages.
Keep a close eye on RSI, negative divergence shows fading upside momentum. A turn lower may see the SMAs act as support, maintaining the dominant upside focus.
TVC:US10Y

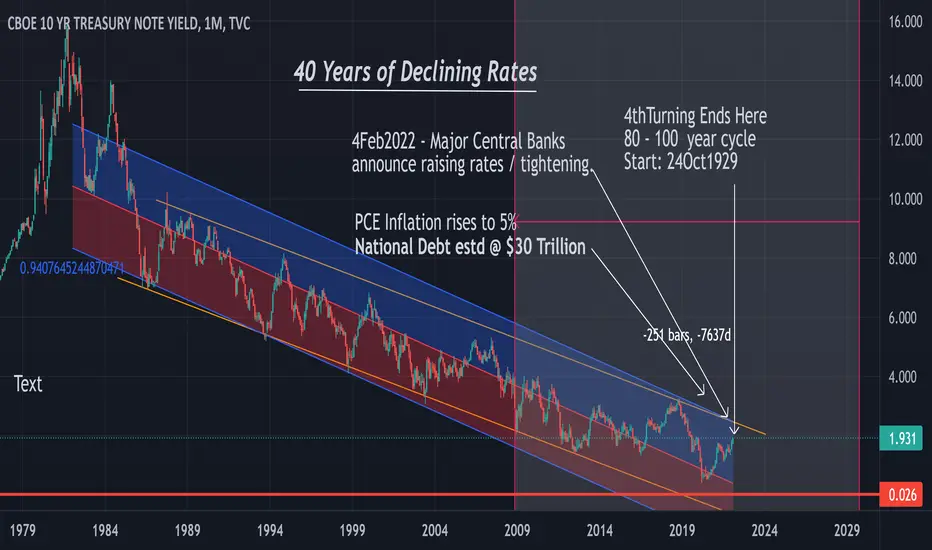
THE 40 YEAR BEAR MARKET IN 10 YEAR TREASURY NOTE INTEREST RATEThe attached chart shows 40 years of declining 10 year rates. As we all know, that rate is the basis for mortgage rates and just about everything else. During that half cycle the housing market boomed, the stock market boomed and generally speaking, corporations and individuals prospered.
But that trend has ended.
Thursday I would have said that rates would either remain low for an indefinite period while inflation soared or rates would be raised to quell inflation. But Friday Central Banks around the world announced tightening.
The party is over!
It is time to batten down the hatches, lock in long term profits on stocks, rentals and any other investments that correlate inversely with interest rates.
Obviously the major players saw this coming and started bailing at the first of2022.
Now us little fish must do what we can to avoid losing the wealth we have.
As an aside, it was announced last year that Bill Gates was diversifying into farm land. Obviously that anticipates food shortages and inflation.............
I will post more on this once the picture becomes clearer.
midnitepoet
Yield will hit above 2% in couple of weeksMomentum: Stochastic still goes up
Pattern: Inverted Head and Shoulder
Price: 2.03%
Time: Q1 - Q2 2022

high probability to rise on the ZB I think the ZB will reach 166' but don't enter with too many contracts good luck guys

ZB treasury bonds are falling down, daily ZB T bond 30 falling down, you have to search only for sell signal,

Bonds Gain as Stocks Sell OffBonds have picked up as stocks have sold off due to increased risk sentiment. We have edged up to 131'02, the technical level we discussed yesterday. The Kovach OBV has picked up significantly, but is starting to level off as ZN finds value in the low 131 handle. We are gradually trekking up in a zig zag pattern, but will face resistance at the next technical level at 131'12. This is a relative high for December which will be difficult to break as we enter the holiday week for Christmas next week. We should have support from below at 130'26 and 130'19.

US Treasury Yield - Bearish Trend is Recession!US 10 years treasury Yield touched it's weekly trend line and bounce, and if bearish trend will continue it's a sign of recession.

Inverse Head and Shoulders in Bonds??Bonds have seen a bit of a relief rally as we predicted yesterday. They hit the exact target we identified, 130'00, before settling near support at 129'26. We anticipate a quiet market as we go into the US hoiday for Thanksgiving. The Kovach OBV is still solidly bearish, suggesting that this rally may be just a relief rally. That being said, we do have an inverse head and shoulders pattern forming with a neckline at 130'00. If we break out further, we could easily hit 130'07, or 130'19. If the selloff continues, our next target is 129'11.
