The power of community
Get inspiration for your next trade. Don't reinvent the wheel.

SILVER TO $750 IN THE NEXT DECADE ?This has to be the biggest Cup & Handle Formation in Human History. Holy Smokes.
Ok, let's dive into the Fundamentals:
1) Industrial Demand: Silver is essential in various high-growth industries such as electronics, solar energy, and medical devices. As technological advancements continue, the dem

ON Semiconductor - betting on corrective UT rallyOn Semi conductor's selling has been weakened since Nov 23 and the larger falling wedge is pointing towards a larger bullish reversal pattern. First the cup and handle is close to a completion and will confirm the pattern once it breaks above US$72.84 resistance.
Volume is low but is a potential s

Nvidia Q1 25 earnings preview – will the Kraken awake?Due to report shortly after market close on 22 May (typically 06:20 AEST / 21:20 UK).
“The most important stock in the world” - That was the label given to Nvidia (NVDA) throughout February as we geared up for its highly anticipated Q424 earnings results. Where, at the time, the sheer number of a

Gold Price (XAU/USD) Is Testing an Important Resistance ZoneGold Price (XAU/USD) Is Testing an Important Resistance Zone
On April 16, we wrote why the $2,380 zone is an important resistance area.
The XAU/USD chart shows that:
1) After fading fluctuations (they formed a narrowing consolidation triangle - shown in green), the price of gold dropped sharply

XAU/USD 13 May 2024 Intraday AnalysisH4 Analysis:
Bias/Analysis remains the same as analysis dated 12 May 2024.
-> Swing: Bullish.
-> Internal: Bullish.
Price has printed a bullish BOS.
After bullish BOS expectation is for price to pullback.
We have nested Daily and H4 supply levels where price is expected to initiate pullback.

GameFi, Blockchain games, Top projectsGameFi
GameFi is a combination of gaming and decentralized finance that combines blockchain technology, NFT (non-flammable tokens), DeFi (decentralized finance), and the play-to-earn (P2E) model to create a unique gaming experience. This innovative approach lets players enjoy the game and earn real


Trading opportunity. What to buy?In the crypto market, the largest assets are currently experiencing similar situations.
On the charts, we can see that six assets have formed sideways trends. Prices for all six assets are currently at the bottom of these sideways trends. For four assets, the price temporarily dropped below the lo

Why will Ethereum drop toward 2500 levelLiquidity is slowing off Etherum toward Bitcoin as show on the ETH/BTC pair
structure at lower timeframe is respecting the 50% fib level and also trending downward inside the channel , as it repeats is similar pattern!!
Thank you for watching
Follow me for more crypto analysis

See all editors' picks ideas
Learn the ins and outs of trading.
New Volume Footprint option on TradingViewHi all,
This is the first (stream replacement) educational video with a very quick overview of volume. Tradingview just released the new Footprint Beta tool. It's something I asked them for a long time ago, so I am glad it's finally here!
In this video I cover the time-price-opportunity tool as

Three Factors Keeping Oil Prices in CheckAT A GLANCE:
Despite ongoing geopolitical conflict, oil prices and volatility are relatively low
A rise in U.S. crude production and weak demand in China are helping oil inventories maintain average levels
Considering many factors like the Russia-Ukraine war, OPEC+ cutting production by 3.6

Exploring Auction Market Theory in Forex TradingAuction Market Theory (AMT) is a conceptual framework used to understand the dynamics of financial markets, viewing them as auctions where buyers and sellers interact to determine prices.
Although the AMT was initially developed to understand & analyse price action movements in the stock market, s

When Are You READY to Trade with REAL MONEY?Hello hello, R2F here with another discussion.
Today, I'd like to go over the question, 'when do you know you are ready to trade with real money?'
Too many traders rush into trading with real capital before they are ready, and end up losing more money than neccessary on learning journey. People a

How To Trade Triangles Like A Pro?Welcome, traders and investors, to our educational post on ascending and descending triangles!
In the fast-paced world of financial markets, understanding chart patterns like these is crucial for making informed trading decisions. Ascending and descending triangles are powerful tools that prov

The TradingView Show: Live With OKX & TradeTravelChillGreetings, TradingViewers worldwide! This interview was conducted live and is now available for playback and on-demand viewing on our TradingView account, accessible for free. This program delves into trader education, cryptocurrencies, and the flexibility of trading from anywhere with an Internet c

Trade identification: Using bitcoin as an exampleHello,
Trade identification is the process through which you are able to identify setups that can be actioned on in the markets. For this example, I shall be using the BTCUSD chart to chant my path as I look for tradeable setups.
1: Structure drawing
Identifying the structure of trades is very k


Putting Risk Reward into PerspectiveMost newbies, and even intermediate traders don't really understand what high risk to reward trades require from themselves and from the market. They think it is something to strive for, and that high RR trades are reserved for the pros. This is far from the truth.
In this video I try to give more

Uncommon Inflation Measures for Analyzing Attitude towards Risk In this analysis we breakdown certain inflation measures that can aid us in capitalizing on longer term trends in various asset classes. The Baltic Dry Index or BDI gives us a real world view of shipping costs. The Index is a measure of the cost to move commodities by the Sea. Therefore, It's a lead

See all editors' picks ideas
Trading explainers – why read when you can watch instead?
New Volume Footprint option on TradingViewHi all,
This is the first (stream replacement) educational video with a very quick overview of volume. Tradingview just released the new Footprint Beta tool. It's something I asked them for a long time ago, so I am glad it's finally here!
In this video I cover the time-price-opportunity tool as
When Are You READY to Trade with REAL MONEY?Hello hello, R2F here with another discussion.
Today, I'd like to go over the question, 'when do you know you are ready to trade with real money?'
Too many traders rush into trading with real capital before they are ready, and end up losing more money than neccessary on learning journey. People a
The TradingView Show: Live With OKX & TradeTravelChillGreetings, TradingViewers worldwide! This interview was conducted live and is now available for playback and on-demand viewing on our TradingView account, accessible for free. This program delves into trader education, cryptocurrencies, and the flexibility of trading from anywhere with an Internet c
Why will Ethereum drop toward 2500 levelLiquidity is slowing off Etherum toward Bitcoin as show on the ETH/BTC pair
structure at lower timeframe is respecting the 50% fib level and also trending downward inside the channel , as it repeats is similar pattern!!
Thank you for watching
Follow me for more crypto analysis
The TradingView Show - Must-see Charts with TradeStationHello to all the global traders! We're live with David Russell, TradeStation's Global Head of Markets. He's also the one who publishes the research and analysis from the official TradeStation account on TradingView. Follow them here: www.tradingview.com
In today's show, we're discussing the most

Putting Risk Reward into PerspectiveMost newbies, and even intermediate traders don't really understand what high risk to reward trades require from themselves and from the market. They think it is something to strive for, and that high RR trades are reserved for the pros. This is far from the truth.
In this video I try to give more
Uncommon Inflation Measures for Analyzing Attitude towards Risk In this analysis we breakdown certain inflation measures that can aid us in capitalizing on longer term trends in various asset classes. The Baltic Dry Index or BDI gives us a real world view of shipping costs. The Index is a measure of the cost to move commodities by the Sea. Therefore, It's a lead
How To Grow A Forex or Crypto Acc Scalping A 5m Time FrameIn this video, we delve into a high-probability scalping strategy, building upon the concepts introduced in our previous videos on developing a trading plan and risk management. This third installment in the series focuses on refining entry points for high-probability trades. We explore a basic tren

See all editors' picks ideas
Trading indicators and strategies built by our community.
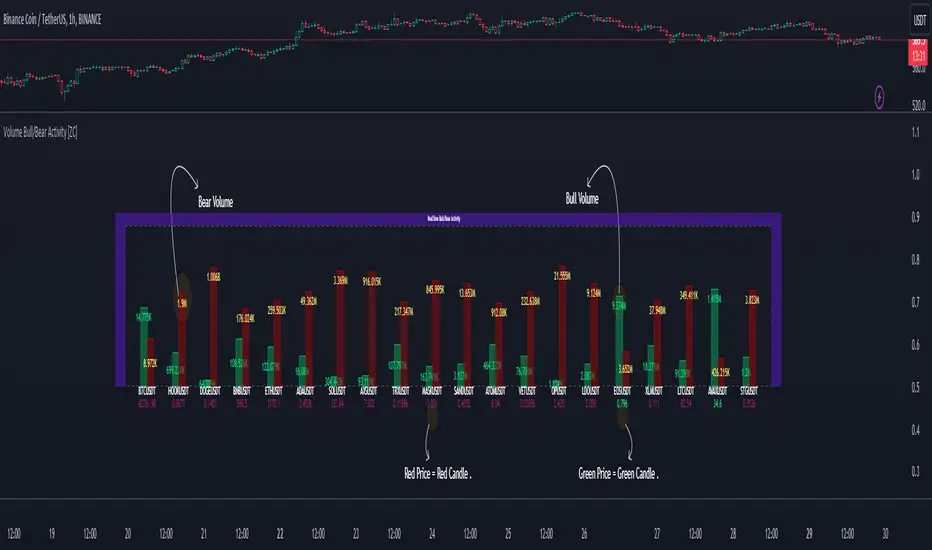
Volume Bull/Bear Activity [ZC]Volume Bull/Bear Activity Summary
This indicator generates a summary of bull/bear activity for 20 symbols.
For each symbol, two bars are displayed, colored green and red.
The green bar indicates bull volume, reflecting activity within the last candle of the symbol.
The red bar signifie
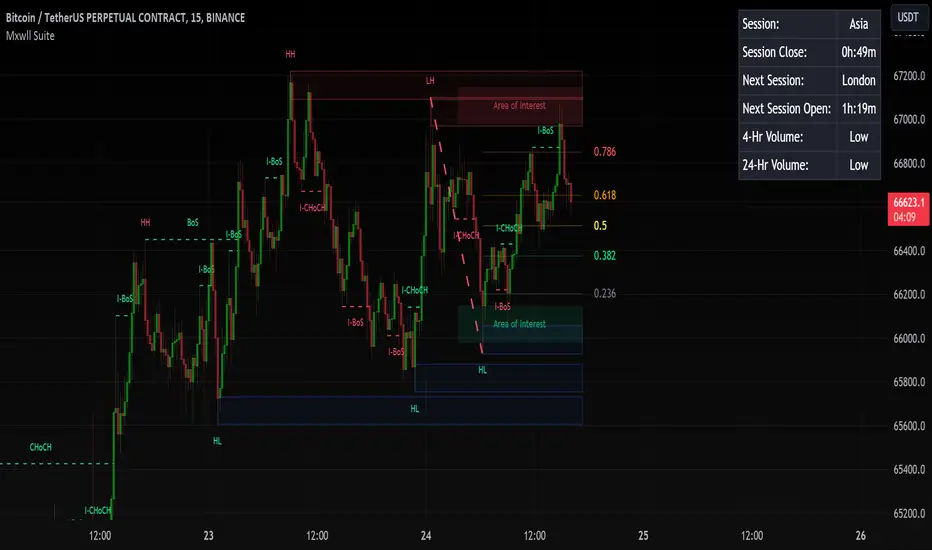
Mxwll Price Action Suite [Mxwll]Introducing the Mxwll Price Action Suite!
The Mxwll Price Action Suite is an all-in-one analysis indicator incorporating elements of SMC and also ideas extending beyond the trading methodology!
Features
Internal structures
External structures
Customizable Sensitivities
BoS/CHoCH
Order B
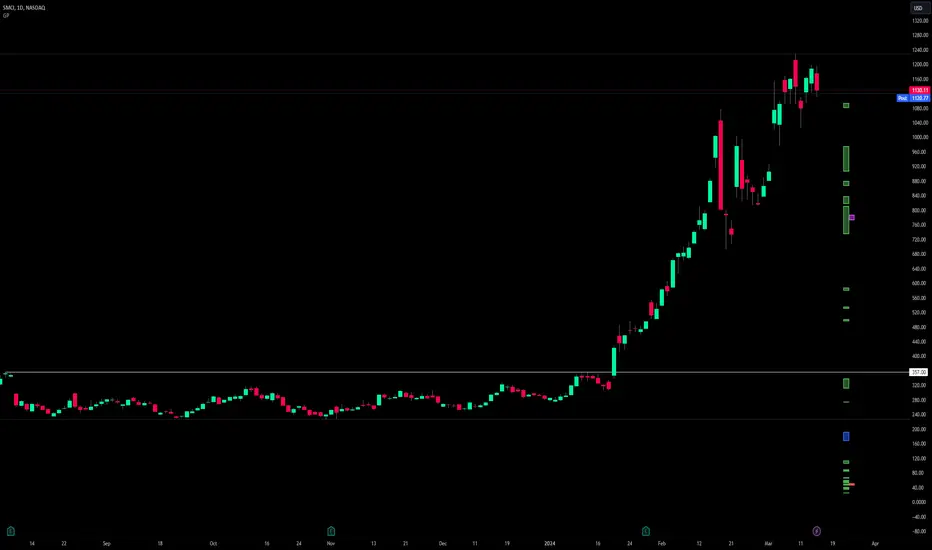
Percent Rank HistogramThis Pine script indicator is designed to create a visual representation of the percent rank for multiple financial instruments. Here's a breakdown of its key features:
Percent Rank Calculation:
The core functionality of this Pine script indicator revolves around the calculation of the percent r

Heat Map SeasonsHeat Map Seasons indicator
Indicator offers traders a unique perspective on market dynamics by visualizing seasonal trends and deviations from typical price behavior. By blending regression analysis with a color-coded heat map, this indicator highlights periods of heightened volatility and helps

Index Generator [By MUQWISHI]▋ INTRODUCTION :
The “Index Generator” simplifies the process of building a custom market index, allowing investors to enter a list of preferred holdings from global securities. It aims to serve as an approach for tracking performance, conducting research, and analyzing specific aspects of the glob

Higher-timeframe requests█ OVERVIEW
This publication focuses on enhancing awareness of the best practices for accessing higher-timeframe (HTF) data via the request.security() function. Some "traditional" approaches, such as what we explored in our previous `security()` revisited publication, have shown limitations

Trailing Management (Zeiierman)█ Overview
The Trailing Management (Zeiierman) indicator is designed for traders who seek an automated and dynamic approach to managing trailing stops. It helps traders make systematic decisions regarding when to enter and exit trades based on the calculated risk-reward ratio. By providing a cle

Periodic Activity Tracker [LuxAlgo]The Periodic Activity Tracker tool periodically tracks the cumulative buy and sell volume in a user-defined period and draws the corresponding matching bars and volume delta for each period.
Users can select a predefined aggregation period from the following options: Hourly, Daily, Weekly, and Mo

Gaps Profile [vnhilton]Note: If you get an error preventing indicator from executing due to a loop running longer than >500ms, please lower the amount of boxes shown and/or increase the minimum gap % threshold.
OVERVIEW
The Gaps Profile (GP) simply shows the remaining gaps on the chart that have yet to be closed. Gaps
TTrades Daily Bias [TFO]Inspired by @TTrades_edu video on daily bias, this indicator aims to develop a higher timeframe bias and collect data on its success rate. While a handful of concepts were introduced in said video, this indicator focuses on one specific method that utilizes previous highs and lows. The following des

See all editors' picks scripts