#BNB BREAKOUT THIS BULLISH PENNANT PATTERN!#BNB retests the bullish pennant pattern. If we successfully retest this pattern, then we can expect a good bounce.
#Crypto
BNBUSDT trade ideas

BNB : NEW ATH !! What's NEXT FOR BNB ??BINANCE:BNBUSDT
Binance coin / BNB has recently made a new ATH 💥🚀 And the price doesn't seem to be ready to turn around just yet. How can we gauge the next possible targets AND retracements for BNB SHORT TERM?
1) Bollinger Bands
Bollinger Band Strategy is excellent to use on lower timeframes, especially when combined with Fibonacci zones. The yellow dot basis (20d Moving Averages) is a common zone to watch for retracements, as well as bounces. As long as the price is bullish, the basis will hold and act as support. The Fib lines up until the basis can be watches for bounce zones:
Notice that periods of contractions is followed by expansion - watch the upper red and purple lines for near term targets (price labels on the right).
2) Fibonacci
Trend based Fibonacci can be helpful to identify key zones that could likely act as resistance, for example:
If we can't close ABOVE the 2.618, we stand a risk to form a nasty M-Pattern, which could indicate the end of the bullish cycle.
3) Moving Averages
The price often corrects towards the moving averages in the daily timeframe. This could be a potential re-entry zone for a swing trade (not accumulation as the price is at the peak of the bullish cycle). Understand that you risk is HIGH if you're looking to buy here. If we lose the 50d (green trendline) that could mean the bullish cycle is coming to an end. You can see the bounce is slightly smaller every time it touches, indicating the end is potentially near:
____________________________

Lingrid | BNBUSDT in CORRECTION phaseThe price perfectly fulfilled my last idea. BINANCE:BNBUSDT has reached an all-time high, riding a wave of momentum as it continues to make higher highs on the daily chart. The recent breakout and close above the massive range zone has been a significant development. Meanwhile, on the 4H timeframe, the market is showing a typical pullback after an impulse move, which is a natural corrective process. It's essential to pay attention to the weekly candle's close, as this will provide valuable insights into the market's future direction. Based on the current trend, I expect the market to experience a squeeze before extending its upward trajectory, potentially forming another compression channel in the process. My goal is recent highs around 730.00
Traders, if you liked this idea or if you have your own opinion about it, write in the comments. I will be glad 👩💻

BNBUSDT IN CORRECT POINT
It sounds like you're analyzing the BNB/USDT pair and noting that it has reached an all-time high, continuing to rise with strong momentum. The breakout and close above a significant range suggest a bullish trend, and you're aiming for a target around $730.00. Here’s a structured approach to evaluate this scenario:
Technical Analysis
Trend Analysis: Confirm the current trend. If BNB/USDT is consistently making higher highs and higher lows, it indicates a strong uptrend
Resistance and Support Levels: Identify key resistance and support levels. Since BNB/USDT has broken out, the previous resistance level could now act as support.
Volume Analysis: Check the trading volume. A breakout accompanied by high volume suggests strong buying interest and confirms the breakout.
Moving Averages: Use moving averages (e.g., 50-day and 200-day) to assess the trend. If the price is above these averages, it’s a positive signal.
Relative Strength Index (RSI): Ensure the RSI is not in
the overbought territory (above 70). If it is, there might be a pullback before further gains.
Fundamental Analysis
News and Developments: Stay updated with news about Binance Coin (BNB), such as partnerships, network upgrades, or regulatory news.
Market Sentiment: Assess the overall market sentiment towards cryptocurrencies. A positive sentiment can drive prices higher.
On-Chain Metrics: Look at on-chain data like the number of active addresses, transaction volume, and holding patterns of large holders (whales).
Risk Management
Position Sizing: Determine the size of your position based on your risk tolerance. Avoid overexposure to a single asset.
Stop-Loss Orders: Set stop-loss orders to protect against significant downturns. For instance, you might place a stop-loss just below the new support level.
Take-Profit Orders: Consider setting take-profit orders around your target price of $730 to lock in gains.

BNB/USDT - 4H - Long My point of view:
1. Strong up trend
2. Up trend volumen zone
3. Correction area
4. 15% down price slide.
Risk/reward = 2.68
IMO worth it.

BNB, Silence is deafening.. low key preppin BIG MOVES at bottom.BNB has somewhat been abandoned in terms of price growth in comparison with its big coin peers alongside other alts. It has stayed at the bottom range for quite sometime. A low key reversal maybe on queue that will be missed by majority.
On our weekly data, BNB has tripled bounced on a solid order block at 220-240 range. This has been visited many times and it keeps bouncing off it for the past 12 months. This range is firm -- and a huge bounce maybe warranted after a few tries already.
Increasing volume has been spotted this past few days with numbers surging +20% from its average numbers.
The coin is currently sitting just above 78.6 FIB LEVEL -- a bargain that can't be missed.
Histogram higher lows is being registered conveying of that a long term trend shift is about to materialize. A bubble up volume (bottom indicator) has finally appeared after 3 months -- since April 2023.
If you missed the LTC, ETH, BTC bull train, BNB is kind enough to give you a chance.
Spotted at 245
TAYOR.
Safeguard capital always.

BNBUSDT Elliott wave countAfter hitting 1.618 fib extension of wave ((i)) below 721.8 we are looking to the downside for wave ((iv)).
Possible target 0.236 fib retracement of wave ((iii)) in the span of previous wave (iv).
We are not excluding one more leg up above 721.8.

BNB support and consolidationPrice seems to be stabilizing around the 600 level. Which seems to be the newest support to be tested.
Initially, we saw a strong upward trend, with higher highs and higher lows. This uptrend was followed by a period of consolidation, where the price moved sideways. Recently, the chart shows a sharp correction from the recent high, breaking down past support levels. The current market sentiment shows bearish pressure in the short term initiated with the formation of strong bearish candlesticks at the recent high. The current price action lead there is a potential support forming here, with the next support levels located at 580 and 550 for accumulation purposes. The new distribution range should be placed above 700. The range plotted here would help us to keep a close eye to the action, and also manage risk efectively

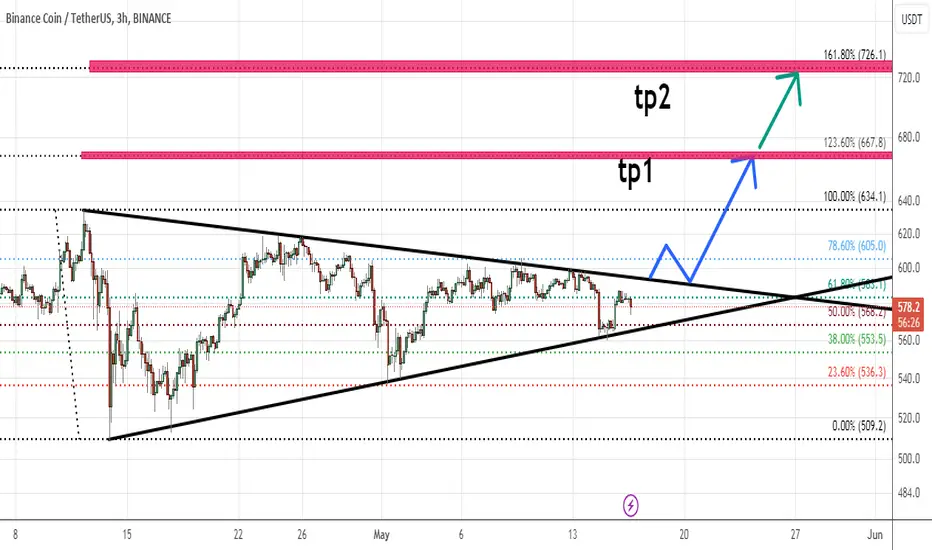
BNB/USDT 1HInterval Chart ReviewHello everyone, let's take a look at the BNB to USDT chart considering the one hour time frame. As we can see, the price is approaching the point of exiting the triangle, after the current recovery.
Let's start by determining the support line, as we can see, the price is based on a significant support at the level of $672, in case of breaking the support, the next support is $656, and then a very strong support at the level of $632.
Looking the other way, you can see the resistance at the price of $682, then there is a point at the price of $696, the third resistance is significant and has doubled the price increase at the level of $720, further resistance can be identified at the price of $736.
When we look at the RSi indicator, we will see that the energy is approaching the lower limit. We have a similar situation on the STOCH indicator, but here we are bouncing off the bottom of the mark, which slows down the decline.

BNB - New ATHs are coming soon BINANCE:BNBUSDT (1D CHART) Technical Analysis Update
BNB is currently trading at $676 and showing overall bullish sentiment sentiment. Price is currently retracing back to strong support. i think this support will hold and bounce back from there. We can enter a trade at current price and then DCA at lower price.
Entry level: $ 676
Stop Loss Level: $ 588
TakeProfit 1: $ 715
TakeProfit 2: $ 761
TakeProfit 3: $ 820.3
TakeProfit 4: $ 909
TakeProfit 4: $ 999
Max Leverage: 5x
Position Size: 1% of capital
Don't forget to keep stop loss.
Follow Our TradingView Account for More Technical Analysis Updates, | Like, Share and Comment Your thoughts.
Cheers
GreenCrypto

BNBUSDT.1DThe BNB/USDT daily chart demonstrates a recent bullish momentum, with the price reaching as high as the R2 resistance level at $724.8 before experiencing a slight retracement. Currently, the price is near the S1 support level at $625.1, which is acting as a pivotal area for potential future price action.
The Moving Average Convergence Divergence (MACD) indicates bullish momentum, as evidenced by the MACD line being above the signal line, although the positive momentum is decreasing as the histogram bars are shortening. This suggests that while the bullish trend may be slowing, it has not yet reversed.
The Relative Strength Index (RSI) is right at the midline (50), indicating a balanced market condition between buyers and sellers. This neutral RSI suggests that there is potential for the price to move in either direction, depending on how market sentiment develops.
Given this analysis, if BNB maintains its position above S1 ($649.1), it may have the strength to retest the R2 level. Breaking above R2 could potentially lead to higher prices towards historical highs. However, if the price breaks below S1, the next support to watch is S2 at $498.2, which could serve as a lower boundary in a more bearish scenario. Investors should watch these levels closely, as they will likely dictate the short-term direction of BNB’s price movement.

The last bullish chance of BNB in Mid term !Hi.
BINANCE:BNBUSD
the BNB is in a ascending triangle now which means the price will increase and also It is expected that the price would at least grow as good as the measured price movement(AB=CD)
Note: we should wait for the breaking of the triangle and than make a move!
Traders, if you liked this idea or have your opinion on it, write in the comments, We will be glad.
_ _ _ _ _ _ _ _ _ _ _ _ _ _ _ _ _ _ _ _ _ _ _ _ _ _ _ _ _ _ _ _ _
✅Thank you, and for more ideas, hit ❤️Like❤️ and 🌟Follow🌟!
⚠️Things can change...
The markets are always changing and even with all these signals, the market changes tend to be strong and fast!!

BNBUSDT Hit New ATHBNBUSDT Technical analysis update
The price of BNB hit a new ATH a few days ago. The price is now bouncing back after retesting the previous support at $670. We can expect a bullish continuation.
Buy zone : Below $695
Stop loss : $655
Regards
Hexa

BNBUSDT: Bullish Flag (Bullish Trend) 🚀 Exciting Trading Opportunity Unfolding! 📈 BNBUSDT.P on the 1-hour chart reveals a meticulously identified Bullish Flag pattern, signaling a potential breakout for lucrative gains! 🌐 Join us as we navigate this promising setup, anticipating a decisive uptrend. 📊 No bearish divergence or trend in sight – the stage is set for a bullish surge! 📢 Traders, seize the moment strategically, position yourselves for maximum advantage, and stay alert for the breakout signal. 📈🚀 Let's ride this wave together! 🌊 #BNBUSDT #BullishFlag #TradingOpportunity #Crypto

BNB - New high on the horizon?The Elliott Wave count, coupled to the oscillators suggests we're finishing (finished?) a wave (iv), meaning, we're again going for a new high before a more consequent correction follows.

BNB Price Analysis
BNB is in an uptrend but the rally is facing resistance at $721.8, suggesting profit booking from short-term traders.
Currently, the price of BNB is testing the EMA21 and is very close to the $630.3 level where a breakout occurred. If the price of BNB holds the support and bounces back from here we can see a good bullish move.
If the price closes below the support at $630.3 and the trend line this might drag the price to $495.8.
There is very little chance for the price to break the trend line because if the price breaks the support it will test the trend line and EMA 55 at the same time and from here the price could bounce back to the upper level.

BNB is waiting for breaking upward upward break is more probable than other scenarios ,so waiting for this break for going toward its tp's .
this analysis is based on fibo level and price action and ichimikou indication .
please share your comments if you like
Bnb analysis Bnb usdt analysis
Binance
Time frame daily
Bnb escaped from yellow triangle
Price came down to edge of triangle and started to pump to my first target 950$

BNB 3 months accumulation about to breakout BNB / USDT
BNB showed stability against BTC moves and printed Long accumulation in ascending triangle pattern since last march
A breakout is expected soon !
Incase of successful breakout we can see strong bullish wave
Keep an eye

#BNB hits new all-time high📊#BNB hits new all-time high💥
🧠From a structural perspective, we successfully broke through the neckline and hit a new all-time high. This means that higher space has been opened at the monthly level, and the ideal target area can be seen at 1379-1804. Therefore, the BNB we hold in the buy zone below can choose to continue to hold it. 💪
➡️From the weekly level, we have continued the bullish trend according to the double bottom bullish structure. Currently, the ideal target area of this structure has been achieved, so there is an expectation of a callback in the mid-term. If your entry point is not ideal, you can choose It makes sense to lock in major profits or close positions. ✔️
🔥New participation opportunities can focus on the main support area 495-536🔥
🤜If you like my analysis, please like 💖and share it💬
💕 Follow me so you don't miss out on any signals and analyze 💯
BINANCE:BNBUSDT

BNB UP to 830 or 850 rangeSymmetrical Triangle pattern clear on one day chart BNB, rising to 830 USD or 850 USD

BNB 1000$ soon ALL trading ideas have entry point + stop loss + take profit + Risk level.
hello Traders, here is the full analysis for this pair, let me know in the comment section below if you have any questions, the entry will be taken only if all rules of the strategies will be satisfied. I suggest you keep this pair on your watchlist and see if the rules of your strategy are satisfied. Please also refer to the Important Risk Notice linked below.
Disclaimer

BNB - Ranges overview BNB is currently breaking its highs and making new highs. Let's see how we play from here.
Plan is simple and straightforward as always. Follow the market and the ranges.
IF we fail to hold above 670$ and close back within the range (clean candle close) expect us to hunt the sellside liquidity resting around 540$ and 520$
IF we hold the current highs expect us to continue higher
PLAN...BE PATIENT and EXECUTE
Stay safe and never risk more than 1-5% of your capital per trade. The following analysis is merely a price action based analysis and does not constitute financial advice in any form.
