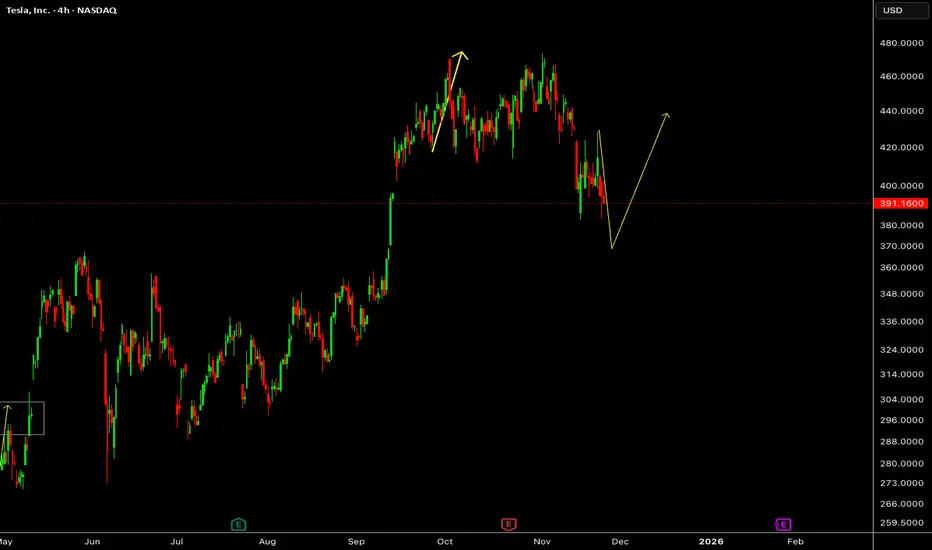
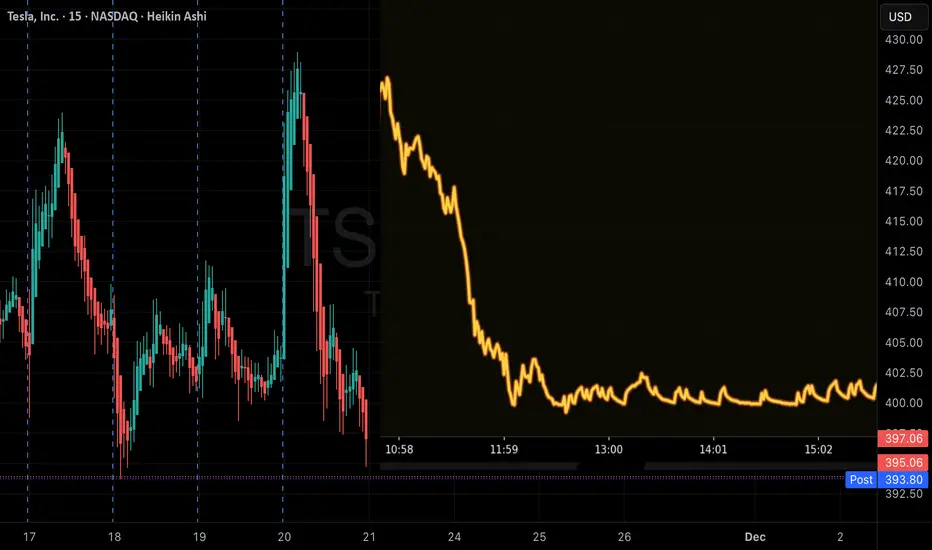
TSLA – Downside Extension Followed by Potential Rebound PhaseTesla has continued to slide after its recent peak, with price action forming a deeper corrective leg. The latest reaction suggests a rebound scenario may develop if momentum begins to shift, paving the way for a possible recovery sequence in the coming sessions.
Disclosure: We are part of Trade Na
Next report date
—
Report period
—
EPS estimate
—
Revenue estimate
—
1.64 USD
7.13 B USD
97.69 B USD
2.39 B
About Tesla, Inc.
Sector
Industry
CEO
Elon Reeve Musk
Website
Headquarters
Austin
Founded
2003
ISIN
US88160R1014
FIGI
BBG000N9MNX3
Tesla, Inc. engages in the design, development, manufacture, and sale of electric vehicles and energy generation and storage systems. It operates through the Automotive and Energy Generation and Storage segments. The Automotive segment includes the design, development, manufacture, sale, and lease of electric vehicles as well as sales of automotive regulatory credits. The Energy Generation and Storage segment is involved in the design, manufacture, installation, sale, and lease of solar energy generation, energy storage products, and related services and sales of solar energy systems incentives. The company was founded by Jeffrey B. Straubel, Elon Reeve Musk, Martin Eberhard, and Marc Tarpenning on July 1, 2003 and is headquartered in Austin, TX.
Related stocks
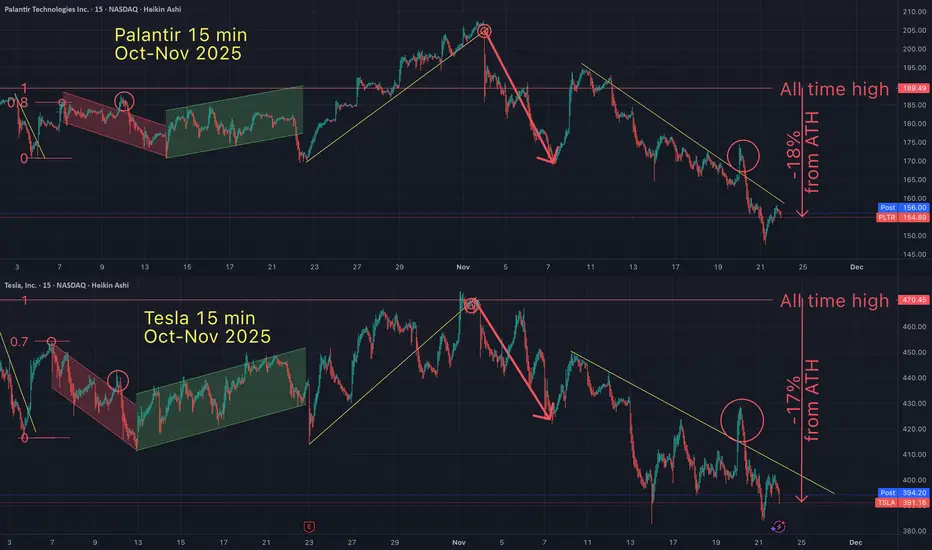
Tesla / Palantir Fractal - 50 Days of identical price action?On oct 7th I suggested that Tesla and Palantir had been in a 'fractal" pattern. Since identifying this pattern, it's been 50 days of identical price action (on the 15 minute timeframe). But this fractal goes back much further in time.
Fractals are a mathmatical anomaly, if you understand linear e
Double Top - Rejection CandlesI do believe we are in the beginning innings of a mild "bear" market for the rest of the year. Too many folks wanting to sell high beta/valuation names. Add the Mag 7 collapse risk and TSLA is particularly vulnerable and may get unwound back to mid 300s.
We do have NVDIA earnings this Wednesday a

TSLA Losing Momentum – Uptrend Breakdown RiskLooking at the current picture, both news flow and technical signals show that Tesla is entering a challenging phase. A series of recent negative developments — from large funds selling off, to declining sales in China, and Elon Musk potentially taking a loss on his latest share purchases — have cle

TSLA: Fundamentals Are Collapsing While Valuation Stays in OrbitTesla is trading near multi-month highs… but the fundamentals tell a very different story.
EPS has dropped by 50%, revenue growth has almost stalled, and yet the stock still carries a Forward P/E of 164.
This combination — slowing growth and extreme valuation — looks like the definition of an insti

Tesla Is Moving Toward a Key Support ZoneHello everyone, Tesla is entering a sensitive phase as the strong rally from 310 USD to 406 USD over the past two months begins to lose momentum. The recent decline is not just a normal pullback; the repeated appearance of red FVGs shows that buying pressure is fading while sellers are gradually ta

TSLA:Truncated 5th at 474 A-Bottom 382 Confirmed-3Scenarios MapTSLA: Truncated 5th at 474 ☠️ A-Bottom 382 Confirmed – 3 Scenarios Mapped: B to 440/460 or Bust? C-Targets 287-367 + Fed Cut Catalyst Dec 9-10:
Tesla's 5-wave impulsive rally from $273 to $474.07 is officially terminated in a classic Truncated 5th Wave pattern – one of the most reliable bearish set

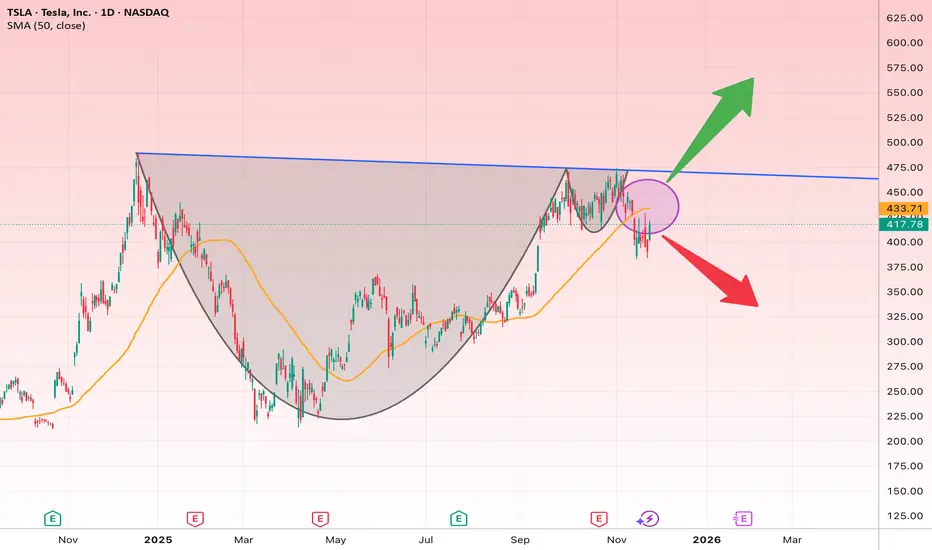
TSLA at a Turning Point: Cup & Handle Breakout or Breakdown?The chart shows a clear Cup & Handle pattern forming on the daily timeframe. Price touched the descending resistance (blue line) and failed to break out, placing TSLA at a critical decision point.
Key Points:
• Main Resistance: 450–465 zone (descending trendline + neckline of pattern)
• Major S
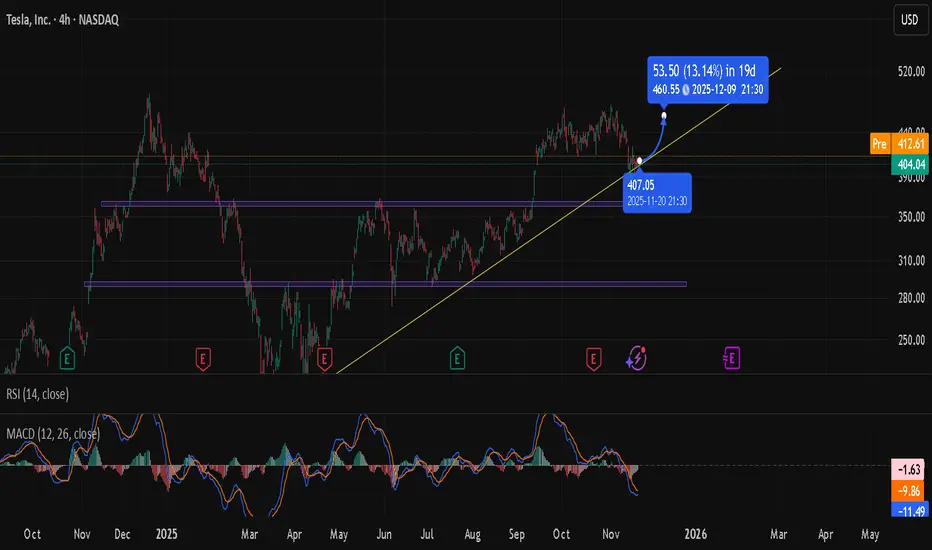
Tesla (TSLA) – Technical Analysis OverviewHello friends, I haven't shared an analysis for a long time. I'm back in the market. Don't forget to follow me for my regular analysis.
The chart shows that Tesla continues to hold its medium-term upward trend. The price recently tested the 408–410 support zone, which aligns with the rising trend
QuantSignals V3 TSLA Alert: Strong Bearish MomentumTSLA 1M | QuantSignals Katy | 2025-11-20
Direction: PUT (Bearish)
Confidence: 75%
Current Price: $427.76
Final Target: $411.82 (-3.73%)
30min Target: $419.17 (-2.01%)
Entry: $427.76
Take Profit: $415.01
Stop Loss: $434.18
Volatility: 24.9%
Analysis:
Katy AI predicts steady bearish movemen
See all ideas
An aggregate view of professional's ratings.
Neutral
SellBuy
Strong sellStrong buy
Strong sellSellNeutralBuyStrong buy
Neutral
SellBuy
Strong sellStrong buy
Strong sellSellNeutralBuyStrong buy
Neutral
SellBuy
Strong sellStrong buy
Strong sellSellNeutralBuyStrong buy
Displays a symbol's price movements over previous years to identify recurring trends.
TSLA4317805
Tesla Energy Operations, Inc. 5.45% 17-DEC-2030Yield to maturity
10.02%
Maturity date
Dec 17, 2030
TSLA4296328
Tesla Energy Operations, Inc. 5.45% 16-OCT-2030Yield to maturity
9.28%
Maturity date
Oct 16, 2030
TSLA4290558
Tesla Energy Operations, Inc. 5.45% 01-OCT-2030Yield to maturity
8.99%
Maturity date
Oct 1, 2030
TSLA4247202
Tesla Energy Operations, Inc. 5.45% 21-MAY-2030Yield to maturity
8.69%
Maturity date
May 21, 2030
TSLA4324758
Tesla Energy Operations, Inc. 4.7% 14-JAN-2026Yield to maturity
8.00%
Maturity date
Jan 14, 2026
TSLA4286421
Tesla Energy Operations, Inc. 5.45% 17-SEP-2030Yield to maturity
7.89%
Maturity date
Sep 17, 2030
TSLA4231716
Tesla Energy Operations, Inc. 5.45% 23-APR-2030Yield to maturity
7.60%
Maturity date
Apr 23, 2030
TSLA4250220
Tesla Energy Operations, Inc. 5.45% 29-MAY-2030Yield to maturity
7.40%
Maturity date
May 29, 2030
TSLA4313161
Tesla Energy Operations, Inc. 5.45% 03-DEC-2030Yield to maturity
7.15%
Maturity date
Dec 3, 2030
TSLA4260133
Tesla Energy Operations, Inc. 5.45% 25-JUN-2030Yield to maturity
7.02%
Maturity date
Jun 25, 2030
TSLA4224815
Tesla Energy Operations, Inc. 5.45% 26-MAR-2030Yield to maturity
6.78%
Maturity date
Mar 26, 2030
See all TSLA bonds
Curated watchlists where TSLA is featured.


Frequently Asked Questions
Depending on the exchange, the stock ticker may vary. For instance, on BOATS exchange Tesla, Inc. stocks are traded under the ticker TSLA.
We've gathered analysts' opinions on Tesla, Inc. future price: according to them, TSLA price has a max estimate of 600.00 USD and a min estimate of 120.00 USD. Watch TSLA chart and read a more detailed Tesla, Inc. stock forecast: see what analysts think of Tesla, Inc. and suggest that you do with its stocks.
TSLA reached its all-time high on Dec 17, 2024 with the price of 474.75 USD, and its all-time low was 106.55 USD and was reached on Dec 28, 2022. View more price dynamics on TSLA chart.
See other stocks reaching their highest and lowest prices.
See other stocks reaching their highest and lowest prices.
Yes, you can track Tesla, Inc. financials in yearly and quarterly reports right on TradingView.
Tesla, Inc. is going to release the next earnings report on Jan 28, 2026. Keep track of upcoming events with our Earnings Calendar.
TSLA earnings for the last quarter are 0.50 USD per share, whereas the estimation was 0.56 USD resulting in a −10.42% surprise. The estimated earnings for the next quarter are 0.45 USD per share. See more details about Tesla, Inc. earnings.
Tesla, Inc. revenue for the last quarter amounts to 28.09 B USD, despite the estimated figure of 26.54 B USD. In the next quarter, revenue is expected to reach 25.16 B USD.
TSLA net income for the last quarter is 1.37 B USD, while the quarter before that showed 1.17 B USD of net income which accounts for 17.15% change. Track more Tesla, Inc. financial stats to get the full picture.
No, TSLA doesn't pay any dividends to its shareholders. But don't worry, we've prepared a list of high-dividend stocks for you.
As of Nov 25, 2025, the company has 125.67 K employees. See our rating of the largest employees — is Tesla, Inc. on this list?
EBITDA measures a company's operating performance, its growth signifies an improvement in the efficiency of a company. Tesla, Inc. EBITDA is 10.87 B USD, and current EBITDA margin is 13.44%. See more stats in Tesla, Inc. financial statements.
Like other stocks, TSLA shares are traded on stock exchanges, e.g. Nasdaq, Nyse, Euronext, and the easiest way to buy them is through an online stock broker. To do this, you need to open an account and follow a broker's procedures, then start trading. You can trade Tesla, Inc. stock right from TradingView charts — choose your broker and connect to your account.