AMP Futures - How to set alertsIn this video we will demonstrate how to create alerts with Tradingview.
www.tradingview.com
ESH2014 trade ideas

AMP Futures - Volume Footprint Chart typeIn this video we will demonstrate how to use the NEW Volume footprint chart type.

Day Trade Using Event Contracts - E-mini S&P Futures Discover trading techniques with Anthony Crudele! 📈 Learn how to leverage CME Group's Event Contracts like 0DTE Options for day trading E-mini S&P Futures on the month's first trading day.

Options Blueprint Series: Secure Interest Rates with Box SpreadsIntroduction
The E-mini S&P 500 Futures is a popular and widely traded derivative product. These futures are used by traders and investors to hedge their portfolios, gain market exposure, and manage risk.
The Options Box Strategy is an advanced options trading technique that involves creating a synthetic long position and a synthetic short position simultaneously. This strategy is designed to lock in interest rates and profit from price discrepancies, essentially securing a risk-free return through arbitrage. By using Box Spreads, traders can secure interest rates and achieve a potential arbitrage opportunity in a controlled and predictable manner.
An interesting application of the Box Spread strategy is using unutilized capital in a trading account. Traders can earn a risk-free return on idle cash by deploying it in Box Spreads. This approach maximizes the utility of available capital, providing an additional revenue stream without increasing market risk exposure, thus enhancing overall portfolio performance.
E-mini S&P 500 Futures Contract Specifications:
Contract Size: $50 times the S&P 500 Index
Minimum Tick Size: 0.25 index points, equal to $12.50 per contract
Trading Hours: Nearly 24 hours a day, five days a week
Margin Requirement: $11,800 at the time of publishing this article
Micro E-minis: 10 times smaller than the E-minis
Understanding Box Spreads
A Box Spread is a sophisticated options strategy that involves simultaneously entering a long call and short put at one strike price and a long put and short call at another strike price.
Components of a Box Spread:
Long Call: Buying a call option at a specific strike price.
Short Put: Selling a put option at the same strike price as the long call.
Long Put: Buying a put option at a different strike price.
Short Call: Selling a call option at the same strike price as the long put.
How Box Spreads Secure Interest Rates: Box Spreads are designed to exploit mispricings between the synthetic long and short positions. By locking in these positions, traders can secure interest rates as the net result of the Box Spread should theoretically yield a risk-free return. This strategy is particularly useful in stable market conditions where interest rate fluctuations can impact the profitability of other trading strategies.
Advantages of Using Box Spreads:
Arbitrage Opportunities: Box Spreads allow traders to capitalize on discrepancies in the pricing of options, securing a risk-free profit.
Predictable Returns: The strategy locks in a fixed rate of return, providing certainty and stability.
Risk Management: By simultaneously holding synthetic long and short positions, the risk is minimized, making it an effective strategy for conservative traders.
Applying Box Spreads on E-mini S&P 500 Futures
To apply the Box Spread strategy on E-mini S&P 500 Futures, follow the following step-by-step approach.
Step-by-Step:
1. Identify Strike Prices:
Choose two strike prices for the options. For instance, select a lower strike price (LK) and a higher strike price (HK).
2. Enter Long Call and Short Put:
Buy a call option at the lower strike price (K1).
Sell a put option at the same lower strike price (K1).
3. Enter Long Put and Short Call:
Buy a put option at the higher strike price (K2).
Sell a call option at the same higher strike price (K2).
Potential Outcomes and Rate Security: The Box Spread locks in a risk-free return by exploiting price discrepancies. The profit is determined by the difference between the strike prices minus the net premium paid. In stable market conditions, this strategy provides a predictable and secure return, effectively locking in interest rates.
Advantages of Applying Box Spreads:
Risk-Free Arbitrage: The primary benefit is securing a risk-free profit through arbitrage.
Predictable Returns: Provides a fixed return, beneficial for conservative traders.
Minimal Risk: By holding both synthetic long and short positions, market risk is mitigated.
Considerations:
Ensure precise execution to avoid slippage and maximize the arbitrage opportunity.
Account for transaction costs, as they can impact the overall profitability.
Monitor market conditions to ensure the strategy remains effective.
Example Trade Setup:
Let's consider a practical example of setting up a Box Spread on the E-mini S&P 500 Futures while its current trading price is 5,531. We'll use the following strike prices:
Lower Strike Price (K1): 5450
Higher Strike Price (K2): 5650
Transactions:
Sell Call at 5650: Premium = 240.01
Buy Put at 5650: Premium = 352.85
Sell Put at 5450: Premium = 270.59
Buy Call at 5450: Premium = 347.39
Note: We are using the CME Group Options Calculator in order to generate fair value prices and Greeks for any options on futures contracts.
Net Premium Calculation:
Net premium paid = 347.39 - 240.01 + 352.85 - 270.59 = 189.64
Potential Profit Calculation:
Profit = (Higher Strike Price - Lower Strike Price) - Net Premium Paid
Profit = 5650 – 5450 – 189.64 = 10.36 points = $518 ($50 per point)
Rate Of Return (ROR) Calculation:
Margin Requirement = (Higher Strike Price - Lower Strike Price) × Contract Multiplier = 200 x 50 = $10,000
ROR = 518 / 10000 = 5.18%
Annualized ROR = 518 / 10000 x 365.25 / 383 = 4.94% (based on the screenshots, expiration will take place in 383.03 days while a year is made of 365.25 days)
Interesting Application: Utilizing Box Spreads with Unutilized Capital
An intriguing application of the Box Spread strategy is the use of unutilized capital in a trading account. Traders often have idle cash in their accounts that isn't actively engaged in trading. By deploying this capital in Box Spreads, traders can earn a risk-free return on otherwise dormant funds. This approach not only maximizes the utility of available capital but also provides an additional revenue stream without increasing market risk exposure. Utilizing Box Spreads in this manner can enhance overall portfolio performance, making efficient use of all available resources.
Importance of Risk Management
Risk management is a critical aspect of any trading strategy, including the implementation of Box Spreads on E-mini S&P 500 Futures. Effective risk management ensures that traders can mitigate potential losses and protect their capital, leading to more consistent and sustainable trading performance.
Conclusion
Implementing the Options Box Strategy on E-mini S&P 500 Futures may allow traders to secure interest rates and potentially achieve risk-free arbitrage opportunities. By understanding the mechanics of Box Spreads and applying them effectively, traders can capitalize on price discrepancies in the options market to lock in predictable returns.
Key points to remember include:
E-mini S&P 500 Futures offer accessible and efficient trading opportunities for both hedging and speculative purposes.
Box Spreads combine synthetic long and short positions, providing a powerful tool for securing interest rates through arbitrage.
By following the outlined steps and leveraging classical technical indicators, traders can enhance their ability to set up and analyze Box Spreads, making the most of this advanced options strategy.
Utilizing Box Spreads on E-mini S&P 500 Futures not only can secure interest rates but can also provide a structured and disciplined approach to trading, leading to more consistent and sustainable trading performance.
When charting futures, the data provided could be delayed. Traders working with the ticker symbols discussed in this idea may prefer to use CME Group real-time data plan on TradingView: www.tradingview.com This consideration is particularly important for shorter-term traders, whereas it may be less critical for those focused on longer-term trading strategies.
General Disclaimer:
The trade ideas presented herein are solely for illustrative purposes forming a part of a case study intended to demonstrate key principles in risk management within the context of the specific market scenarios discussed. These ideas are not to be interpreted as investment recommendations or financial advice. They do not endorse or promote any specific trading strategies, financial products, or services. The information provided is based on data believed to be reliable; however, its accuracy or completeness cannot be guaranteed. Trading in financial markets involves risks, including the potential loss of principal. Each individual should conduct their own research and consult with professional financial advisors before making any investment decisions. The author or publisher of this content bears no responsibility for any actions taken based on the information provided or for any resultant financial or other losses.

AMP Futures - Contract roll over using proper CQG symbol map.In this video we will demonstrate how to roll your contracts over using the proper CQG symbol map.

A Synthetic Covered Call StrategyCME: E-Mini S&P 500 Options ( CME_MINI:ES1! ), E-Mini Nasdaq 100 Options ( CME_MINI:NQ1! )
Last Friday, the S&P 500 closed at 5,277.5, up 10.6% year-to-date. The Nasdaq Composite settled at 16,735.0, advancing 11.5% YTD.
This year, the chances of aggressive interest rate cuts diminished rapidly amid solid employment data and cooling US inflation. However, these headwinds could not stop US stocks from reaching one new record after another.
Over the past year, the Fed’s official rhetoric has shifted from hawkish to dovish, and then back to hawkish again. But action speaks louder than words. Since the last rate hike in July 2023, the Fed has kept the interest rates unchanged in the last six FOMC meetings.
According to CME Group’s FedWatch Tool, the probability of a no-rate-change decision in the June 12th FOMC is 99.7%. There is an 81.2% chance that the Fed Funds rates stay at 5.25%-5.50% on July 31st. The futures market expects the first 25bp rate cut on September 18th, with a 64% probability (Data as of June 4th).
(Link: www.cmegroup.com)
Fed’s monetary policy has been the dominant driver of global financial market conditions in the last two years. The absence of Fed actions helped reduce market volatility. As a result, the VIX index plummeted from 19.2 on April 15th to 12.9 on May 31st.
Exploring Covered Call Options Strategies
Low volatility suggests that the US stock market is likely to move sideways in the near future. If you own stocks, you may finish the year with a positive return, as the two major indexes have already yielded 10-11% YTD.
If you plan to enter the market now, buying stocks is quite challenging. I personally have a hard time justifying a lofty price while the expected return stays low. But what we don’t want to buy, we may be able to sell it. For investors who already own stocks, they could consider a covered call strategy.
In a classic example, an investor owns 100 shares of stock A and sell 1 call option on the underlying stock. Below are three payoff scenarios:
• If A rises and exceeds call strike, options buyer has the right to exercise (“call the stock”). He will pay at the strike (= 100 shares X strike price). Our investor receives both an upfront premium and the sales amount. However, he gave up all the upside.
• If A moves sideways or rises below the strike, our investor will keep the upfront premium as profit. We may consider this as an income enhancement for owning A.
• If A falls a lot, our investor will incur a loss. However, this loss is due to the risk of owning A, not from selling call options on A.
There are some drawbacks with individual stock options.
• Only the most popular stocks have adequate liquidity. Options trading fees and a wide bid-ask spread will cut into the premium income received by the options seller.
• If you own many stocks and repeat this process multiple times, the problem multiplies quickly. The cost and time required to administer this strategy become unbearable.
• At the end, actual returns could be worse off than theoretical payoff suggested.
Synthetic Covered Call Options with E-Mini S&P and Nasdaq
Is there any alternative to single stock options? We could achieve the same objective with options on E-Mini S&P 500 and Nasdaq 100 futures. I call this Synthetic Covered Call strategy. Compared with individual stock options, stock index options are more liquid and capital efficient.
My logic:
• If you own a basket of diverse stocks, when the stock index rises, your stock portfolio will likely gain in value as well.
• If stock indexes go beyond call strikes, the losses incurred in short options could be largely offset by the gain from the underlying stock portfolio.
• Combining with a stock portfolio, short option on stock index futures has significantly lower risk than selling a naked call.
However, we still need to understand investment risk. It lies with the possibility that the portfolio and market indexes could move in different directions. Investors could run an analysis to determine how correlated their portfolio return is to S&P and Nasdaq returns.
On May 31st, the June contract of E-Mini S&P 500 (ESM4) is quoted 5,299.25. The out-of-the-money (OTM) call strike 5,400 is quoted at 13.75. The options contract will expire on June 21st, the third Friday of the contract month.
• To sell 1 call option, the investor is required to deposit a margin of $11,800. He will receive an upfront premium from options buyer for $687.50 (=13.75 X $50).
• If June futures stays below 5,400 in the next three weeks, the investor will pocket the upfront premium as investment income.
• Hypothetically, if futures price reach 5,500, which is 100 points over the strike, our short options position will incur a loss of $5,000 (= 100 x 50). This will be more than the premium received, but still below the margin deposit.
On May 31st, the June contract of E-Mini Nasdaq 100 (NQM4) is quoted 18,570.75. The OTM call strike 19,500 is quoted at 14.50. The options contract will expire on June 21st.
• To sell 1 call option, the investor is required to deposit a margin of $17,700. He will receive an upfront premium from options buyer for $290 (=14.50 X 20).
• If June futures stays below 19,500 in the next three weeks, the investor will pocket the premium as investment income.
• Hypothetically, if futures price reach 20,000, which is 500 points over the strike, our short options position will incur a loss of $10,000 (= 500 x $20). This will be more than the premium received, but still below the margin deposit.
Option selling is risky. The Fed’s inaction and low volatility give us some comfort here, but we still could be wrong.
The June 12th meeting is 12 days before options expiration. If the market indexes rise sharply, options seller could buy back the options in the open market at a loss. He may be able to prevent the loss from getting too big by closing the unprotected position.
Options traders could find CME’s Options Calculator a valuable tool in structuring their options strategies. The best part, it is free.
www.cmegroup.com
Happy Trading.
Disclaimers
*Trade ideas cited above are for illustration only, as an integral part of a case study to demonstrate the fundamental concepts in risk management under the market scenarios being discussed. They shall not be construed as investment recommendations or advice. Nor are they used to promote any specific products, or services.
CME Real-time Market Data help identify trading set-ups and express my market views. If you have futures in your trading portfolio, you can check out on CME Group data plans available that suit your trading needs www.tradingview.com

AMP Futures - Volume Candles Chart typeIn this video we will demonstrate how to access the NEW Volume candles chart type with TradingView.

AMP Futures - Time Price Opportunity (TPO) chart typeIn this video we will demonstrate how to access the NEW Time Price Opportunity (TPO) chart type using TradingView.

Analysis for the Week of 06/03/2024 - SPY QQQ META COIN BTCA video going over my thoughts and expectations for the week, I'll continue to post ideas and updates as things develop throughout the week.

Reversal immenantFriday we went up from S5 to R6. This is the ultimate SELL zone. TTM Squeeze Pro has placed 3 orange SELL dots above the last 15" Bearish harami.
Between this evening,. Sunday's overnight market, and mondays open we might go a little higher first or make the move in the overnight session, but one way or the other we reversa and go xown either this evening or on monday.
Stoch RSI is heading up to overbought.
MACD is totally overbought at an extreme level and rolling over.
TTM squeeze shows strong buying, but that stochastic shows what happen Friday, the next phase is weak biuying and then selling.
I chose neutral, but i could have chosen SELL, it's just a matter of how things look tonight at the open of the futures markets.

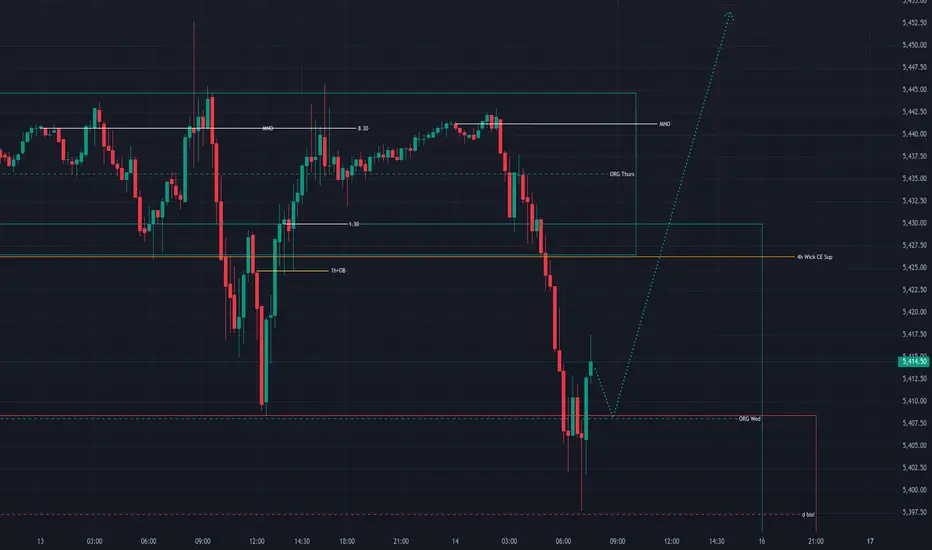
20240614 ESThere is the first +MSS after ss raid and reaction to the HTF PDA level (d bisi CE). => anticipate downside correction and displacement to the upside. Those close proximity highs are very attractive for the upside move and bs raid.
The HI news at 10am is the only thing that can make some unexpected change in this narrative with bullish BIAS.
It is possible to see the continuation of the upside move on the 10am HI news announcement. But some volatility influx is anticipated on this 10 HI new event.
$ES 8 tick scalp ideaEasy scalp idea;
Wait for 5503.75 then if needing to average down 5504.75. Go short here for an easy 8 tick bounce. On future funded accounts using 4 contracts you’ll make; $400 with 8 ticks.

Reviewing ES price action 6-13-24Going over the price action ES for Thursday. looking for clues as to what the market was telling us. how we could have traded better and how the Overnight session looks.

Reviewing ES price action 6-13-24Going over the price action ES for Thursday. looking for clues as to what the market was telling us. how we could have traded better and how the Overnight session looks.

PM Breaker Set up on the ESafter a nice Down leg in the NY AM Session the ES gave us a Bullish breaker setup and delivered 15 handles in the afternoon.
enter once price retraces into breaker box


Long $ES The only way I’ll touch NYSE:ES long is when it retest these levels. I’m fine missing a move. Willing to wait to minimize risk is the name of the game;
5444.75
5439.50
5426.25
5419.50

Long $ES The only way I’ll touch NYSE:ES long is when it retest these levels. I’m fine missing a move. Willing to wait to minimize risk is the name of the game;
5444.75
5439.50
5426.25
5419.50


Market Crash - ES Ascending Wedge BreakoutSo everything went almost exactly as I expected today, but there was a big problem, no sell off and no life for VX. Going into the day I wasn't sure about CPI but figured a hot or cool reading would get a reaction, but didn't expect that big of a rally off of a 0.01% cool print which was mostly as expected.
After CPI release, fed fund futures priced in a 75% chance of a cut in September. I thought this was crazy,.no way they are cutting in September. They never had plans to cut in September unless data changed significantly, which it didn't and today's CPI was not going to change their target rate. The expectation dropped to around 60% before the minutes were released, but was still pricing in way too high of a chance. When I saw this, I thought oh yeah this is the classic bull trap. Everything looks.great but after FOMC when the market realizes it's not getting a September cut, there will be a dump.
Sure enough the minutes are released and there's no September cut. However, the market held up most of the day and had a small pullback before close. I couldn't believe it honestly, VX just didn't get any life whatsoever despite the market not getting what it wanted, which usually leads to panic in my experience. Then AVGO announced a stock split and NQ pumped even more after hours.
So here we are, the market didn't get 2 cuts but doesn't seem to care. However, DXY is showing a lot of strength in the overnight session and assets like BTC and Silver are struggling, which would point to weaker equities. The was weak today and RTY gave up a lot of gains after a strong morning. ES and NQ still remain strong. I fully expect this to end badly because the market was wrong and that is always bad. We should see a bigger reaction soon, once everything settles down. Many things I'm seeing today I would interpret as bearish, but VX just keeps going down and NQ keeps going up.
This is part of being a bear unfortunately,. you're unlikely to pick the top perfectly,.so if you decide to short a seemingly strong market at ATH, you'll probably lose most of the time. I still fully expect the market to run out of steam and keep seeing more and more top signals. However,.it's gonna go up until it stops and if you choose to short it, you've got to be a bit lucky or remain patient. I'm remaining patient, we'll see what tomorrow brings. The sell is coming.

2024-06-12 - a daily price action after hour update - sp500Good Evening and I hope you are well.
overall market comment
What a time to be alive. Bulls got another huge breakout to the upside which opens new targets above. There is a reasonable chance that this bubble continues much further than anyone could ever dream of, just like all the Nvidia employee’s who sold their stock < 100. Couple more days and half of the sp500 will be made of 7 companies. Bears are not getting any help from the news side and bulls are just peak euphoric. Buying everything anytime is making money, so this will continue until it stops. Dax, Russel2000 and DJI are not participating which speaks to the concentration of the price advances to a small basket of stocks.
Commodities had big reversal days, producing bad looking bull bars on the daily chart. Gold was rejected at the daily 20ema and Oil reversed after peaking above the bear trend line from April. I expect more weakness tomorrow.
sp500 e-mini futures
comment: My daily chart is ugly, yes i know. Works though. I have painted 3 wave series for you, which all end around 5500-5600. I won’t write more about this.
current market cycle: bull trend
key levels: 5300 - 5600
bull case: Bulls did it again. A minor pull-back is expected though. Given that tomorrow is Friday, I would not be surprised if we do another 1-2% day to just get this bull trend over with. Straight melt up. Anything below 5360 would be a huge surprise.
Invalidation is below 5360.
bear case: CPI came in soft and the FED is not having any effect on markets currently. Melt up was inevitable. Bears not doing anything and waiting for more bulls to show signs of exhaustion and profit taking. 5500-5600 is where I expect selling pressure to rise again. The 38 point drop from ath 5454 was a bit unexpected tbh but the 1h ema held.
Invalidation is above 5460.
short term: As long was the 1h ema holds and market stays above 5400, it’s max bullishness.
medium-long term: Bearish. We will see 5000 over the next weeks again and 4600 over the next 12 months. —unchanged
current swing trade: None
trade of the day: Just higher lows since Globex, market showed signs of knowing the CPI print, because it went max long into the release and every one tick dip was bought.

Price Action REview ES 6-12-24 CPI + FOMCGoing over the price action for this CPI & FOMC day. intense day very difficult filled with opportunities. keep working hard take shots and manage risk. that is our plan.

ES analysis for CPI day! New ATH Targets // Not financial adviceFor the past few days I've been saying CME_MINI:ES1! is stuck in a range between 5342-5372. After a final failed breakdown of it yesterday that triggered longs, buyers broke us out the range finally. Size down now before CPI…protect your capital. Wait for traps. 5396, 5408, 5421+ next in play for buyers. 5363 lowest must hold on any CPI dips, or we sell
