TSLA Triple TopTriple tops = market drop!
As soon as the market tanks, TSLA is in major trouble!
For 5 long years, people have been trying to pump this stock with no good results. Instead, they got a -75% decline and a -66% decline for their efforts.
This stock will fall bidless! All hype with no substance.
Th
Key facts today
Next report date
—
Report period
—
EPS estimate
—
Revenue estimate
—
1.64 USD
7.13 B USD
97.69 B USD
2.80 B
About Tesla, Inc.
Sector
Industry
CEO
Elon Reeve Musk
Website
Headquarters
Austin
Founded
2003
ISIN
US88160R1014
FIGI
BBG000N9MNX3
Tesla, Inc. engages in the design, development, manufacture, and sale of electric vehicles and energy generation and storage systems. The company operates through Automotive and Energy Generation and Storage. The Automotive segment includes the design, development, manufacture, sale, and lease of electric vehicles as well as sales of automotive regulatory credits. The Energy Generation and Storage segment is involved in the design, manufacture, installation, sale, and lease of stationary energy storage products and solar energy systems, and sale of solar energy systems incentives. The company was founded by Jeffrey B. Straubel, Elon Reeve Musk, Martin Eberhard, and Marc Tarpenning on July 1, 2003 and is headquartered in Austin, TX.
Related stocks

Tesla Approaches $480 Resistance – Uptrend Still IntactHello everyone,
Tesla is trading around $468, continuing its recovery since mid-October. On the 4H chart, the medium-term bullish structure remains clear: price consistently forms upward Fair Value Gaps, stays above the Ichimoku cloud, Tenkan-sen crosses above Kijun-sen, and volume rises above $46

TESLA PT-2 TRILLION DOLLAR PAY CHECKI hope everything is clear now. I have exited all positions here and I am not going into news.
Elon is not going to tell me where my money is going
NOTE:NOT TRADING TSLA

Tesla - Withstanding all weakness!🏹Tesla ( NASDAQ:TSLA ) can still break out:
🔎Analysis summary:
Since Tesla was listed on the Nasdaq back in 2013, we witnessed a lot of triangle breakouts. And starting all the way back in 2020, Tesla once again created a bullish triangle. Last month we saw the breakout and this month we have

TSLA next leg up.RSI- is looking good for a move up because of the descending tops, once you break the resistance line you will fly.
Moving averages- My yellow and blue are good for telling longer term upside, and they are at the point of where the blue will be above the yellow.
Repetition- a lot of patterns end i

TSLA Is Building Momentum Toward New HighsTesla continues to show strong momentum, with higher lows forming across recent sessions. The trend structure remains constructive, and momentum indicators are pointing toward a possible extension toward new highs in the coming week i.e. $500+
According to my Trade Navigator model — a data-driven s
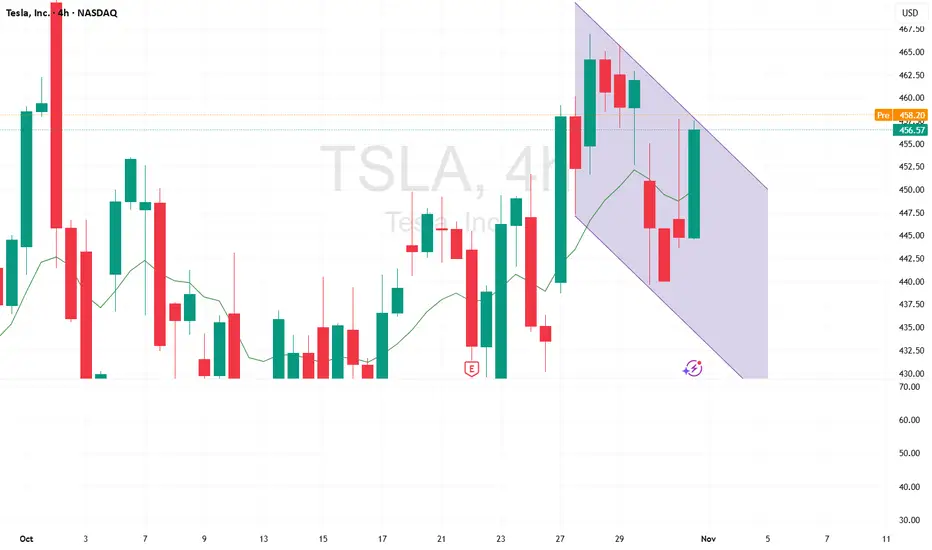
TSLA-Bulls Fighting for Expansion (Nov. 3–7)TSLA Weekly Grind Into Call Walls – Bulls Fighting for Expansion (Nov. 3–7)🚀
WEEKLY TIMEFRAME ANALYSIS
1. Market Structure
TSLA continues its broader bullish expansion on the weekly, confirming a strong BOS over prior swing highs. The previous CHoCH signal was neutralized quickly, and price reclaim

Tesla - Here comes the third breakout!🚀Tesla ( NASDAQ:TSLA ) is finally breaking out:
🔎Analysis summary:
For the past four years, Tesla has been trading in a very clear ascending triangle pattern. But just last month, we finally saw the expected bullish triangle breakout. Considering all of the previous triangle breakouts, Tesla

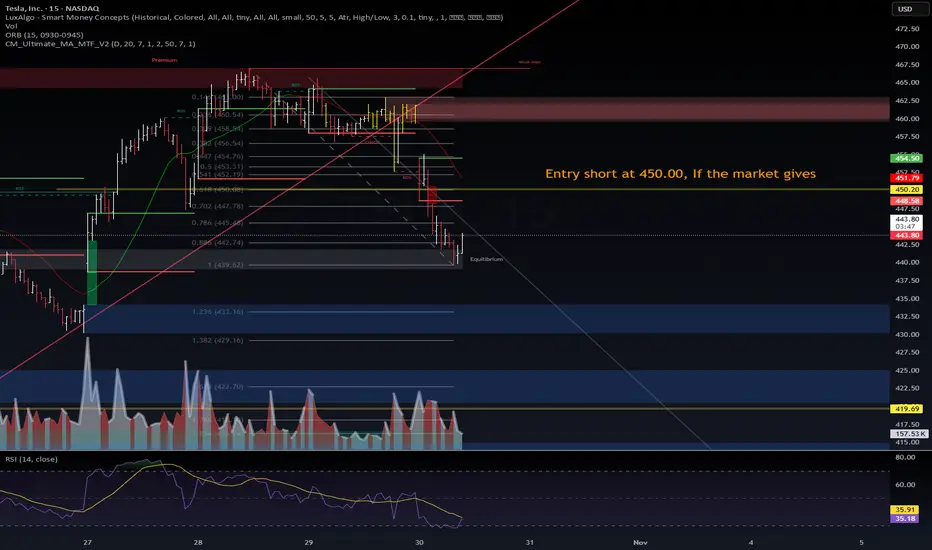
$TSLA | Short Setup Loading — 450 is the Line in the Sand⚙️ NASDAQ:TSLA | Short Setup Loading — 450 is the Line in the Sand
Tesla continues its controlled descent after rejecting the weak high at 465–470.
Price retraced into the 0.786 Fib (≈ 445) zone, finding short-term equilibrium before the next leg.
📊 VolanX DSS Technical Outlook (15m):
Structure
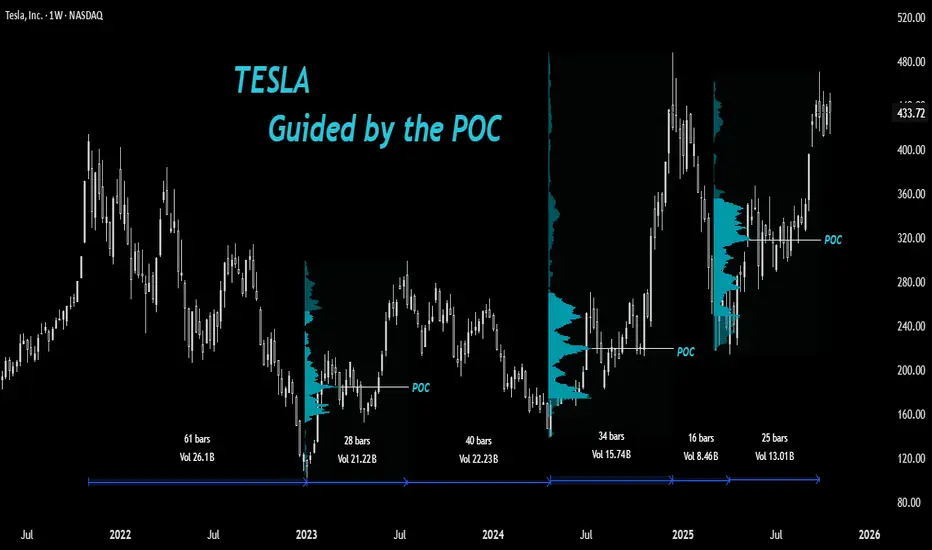
Tesla: Guided by the Point of Control🔎Understanding How Stocks React at Key Volume Profile Levels
In this post, let’s study how a stock can react around important Volume Profile levels and how we, as traders, can take advantage of this behavior.
🔘 A Quick Look at Volume Profile
The Volume Profile shows how much trading took place
See all ideas
Summarizing what the indicators are suggesting.
Neutral
SellBuy
Strong sellStrong buy
Strong sellSellNeutralBuyStrong buy
Neutral
SellBuy
Strong sellStrong buy
Strong sellSellNeutralBuyStrong buy
Neutral
SellBuy
Strong sellStrong buy
Strong sellSellNeutralBuyStrong buy
An aggregate view of professional's ratings.
Neutral
SellBuy
Strong sellStrong buy
Strong sellSellNeutralBuyStrong buy
Neutral
SellBuy
Strong sellStrong buy
Strong sellSellNeutralBuyStrong buy
Neutral
SellBuy
Strong sellStrong buy
Strong sellSellNeutralBuyStrong buy
Displays a symbol's price movements over previous years to identify recurring trends.
TSLA4317805
Tesla Energy Operations, Inc. 5.45% 17-DEC-2030Yield to maturity
10.02%
Maturity date
Dec 17, 2030
TSLA4296328
Tesla Energy Operations, Inc. 5.45% 16-OCT-2030Yield to maturity
9.28%
Maturity date
Oct 16, 2030
TSLA4290558
Tesla Energy Operations, Inc. 5.45% 01-OCT-2030Yield to maturity
8.99%
Maturity date
Oct 1, 2030
TSLA4247202
Tesla Energy Operations, Inc. 5.45% 21-MAY-2030Yield to maturity
8.69%
Maturity date
May 21, 2030
TSLA4324758
Tesla Energy Operations, Inc. 4.7% 14-JAN-2026Yield to maturity
8.00%
Maturity date
Jan 14, 2026
TSLA4286421
Tesla Energy Operations, Inc. 5.45% 17-SEP-2030Yield to maturity
7.89%
Maturity date
Sep 17, 2030
TSLA4231716
Tesla Energy Operations, Inc. 5.45% 23-APR-2030Yield to maturity
7.60%
Maturity date
Apr 23, 2030
TSLA4250220
Tesla Energy Operations, Inc. 5.45% 29-MAY-2030Yield to maturity
7.40%
Maturity date
May 29, 2030
TSLA4313161
Tesla Energy Operations, Inc. 5.45% 03-DEC-2030Yield to maturity
7.15%
Maturity date
Dec 3, 2030
TSLA4224815
Tesla Energy Operations, Inc. 5.45% 26-MAR-2030Yield to maturity
6.78%
Maturity date
Mar 26, 2030
TSLA4265473
Tesla Energy Operations, Inc. 5.45% 16-JUL-2030Yield to maturity
6.72%
Maturity date
Jul 16, 2030
See all TSLA bonds
Curated watchlists where TSLA is featured.


Frequently Asked Questions
The current price of TSLA is 429.52 USD — it has decreased by −4.03% in the past 24 hours. Watch Tesla, Inc. stock price performance more closely on the chart.
Depending on the exchange, the stock ticker may vary. For instance, on NASDAQ exchange Tesla, Inc. stocks are traded under the ticker TSLA.
TSLA stock has fallen by −4.21% compared to the previous week, the month change is a −2.20% fall, over the last year Tesla, Inc. has showed a 48.68% increase.
We've gathered analysts' opinions on Tesla, Inc. future price: according to them, TSLA price has a max estimate of 600.00 USD and a min estimate of 120.00 USD. Watch TSLA chart and read a more detailed Tesla, Inc. stock forecast: see what analysts think of Tesla, Inc. and suggest that you do with its stocks.
TSLA reached its all-time high on Dec 18, 2024 with the price of 488.54 USD, and its all-time low was 1.00 USD and was reached on Jul 7, 2010. View more price dynamics on TSLA chart.
See other stocks reaching their highest and lowest prices.
See other stocks reaching their highest and lowest prices.
TSLA stock is 5.70% volatile and has beta coefficient of 1.88. Track Tesla, Inc. stock price on the chart and check out the list of the most volatile stocks — is Tesla, Inc. there?
Today Tesla, Inc. has the market capitalization of 1.48 T, it has increased by 1.71% over the last week.
Yes, you can track Tesla, Inc. financials in yearly and quarterly reports right on TradingView.
Tesla, Inc. is going to release the next earnings report on Jan 28, 2026. Keep track of upcoming events with our Earnings Calendar.
TSLA earnings for the last quarter are 0.50 USD per share, whereas the estimation was 0.56 USD resulting in a −10.42% surprise. The estimated earnings for the next quarter are 0.44 USD per share. See more details about Tesla, Inc. earnings.
Tesla, Inc. revenue for the last quarter amounts to 28.09 B USD, despite the estimated figure of 26.54 B USD. In the next quarter, revenue is expected to reach 25.33 B USD.
TSLA net income for the last quarter is 1.37 B USD, while the quarter before that showed 1.17 B USD of net income which accounts for 17.15% change. Track more Tesla, Inc. financial stats to get the full picture.
No, TSLA doesn't pay any dividends to its shareholders. But don't worry, we've prepared a list of high-dividend stocks for you.
As of Nov 8, 2025, the company has 125.67 K employees. See our rating of the largest employees — is Tesla, Inc. on this list?
EBITDA measures a company's operating performance, its growth signifies an improvement in the efficiency of a company. Tesla, Inc. EBITDA is 10.87 B USD, and current EBITDA margin is 13.44%. See more stats in Tesla, Inc. financial statements.
Like other stocks, TSLA shares are traded on stock exchanges, e.g. Nasdaq, Nyse, Euronext, and the easiest way to buy them is through an online stock broker. To do this, you need to open an account and follow a broker's procedures, then start trading. You can trade Tesla, Inc. stock right from TradingView charts — choose your broker and connect to your account.
Investing in stocks requires a comprehensive research: you should carefully study all the available data, e.g. company's financials, related news, and its technical analysis. So Tesla, Inc. technincal analysis shows the sell today, and its 1 week rating is buy. Since market conditions are prone to changes, it's worth looking a bit further into the future — according to the 1 month rating Tesla, Inc. stock shows the buy signal. See more of Tesla, Inc. technicals for a more comprehensive analysis.
If you're still not sure, try looking for inspiration in our curated watchlists.
If you're still not sure, try looking for inspiration in our curated watchlists.