Gold Outlook: Macro, Bonds, and Geopolitics Driving the Rally
1. Labor Market Weakness → Fed Pivot Risk
The latest NFP showed just 22K jobs vs. 75K expected, with unemployment climbing to 4.3%. Revisions were deeply negative (-258K), confirming labor market deterioration. Historically, recessions often follow once unemployment rises 0.5–1% from cycle lows — we’re already in that zone.
This means the Fed is boxed in: growth is slowing but inflation is still sticky.
Markets are pricing in a September Fed rate cut, weakening USD and boosting safe-haven demand for Gold.
2. Bonds & Yield Curve Dynamics
US Treasury Yields have started to retreat as bond traders price in Fed cuts. The 2-year yield, which tracks Fed expectations, is easing from highs, signaling policy loosening ahead.
A steeper yield curve could emerge if short-term yields fall faster than long-term, historically bullish for Gold as opportunity cost declines.
Real yields (inflation-adjusted) matter most for Gold. With core inflation at 3.1% and slowing growth, if nominal yields fall but inflation stays sticky, real yields compress lower → Gold rallies.
3. Inflation & Stagflation Risk
Inflation is at 3.1%, above the Fed’s 2% target, while growth is slowing.
This is classic stagflation risk: weak labor + sticky inflation = policy paralysis.
For Gold, stagflation is one of the strongest bullish regimes: fiat currencies lose real value, while safe-havens gain demand.
4. Geopolitical Tailwinds
Tariff pressures and trade disputes are pushing input costs higher. Tariffs are inflationary and growth-negative — another stagflation driver.
Rising geopolitical tensions (trade wars, supply chain disruptions, regional conflicts) add a risk premium. In times of geopolitical uncertainty, central banks (China, India, Middle East) often increase Gold reserves as a hedge against USD exposure.
BRICS talk of de-dollarization is structurally supportive: even a small reserve shift from USD to Gold creates steady demand.
5. Forward Outlook
Near-term (1–3 months): Fed cut in September almost certain. USD likely to weaken further, Gold stays bid. Volatility spikes around CPI (Sept 11) and FOMC (Sept 17).
Medium-term (3–6 months): If inflation doesn’t fall below 3%, Fed may slow rate cuts, but Gold could still benefit from safe-haven + central bank buying.
Key Catalysts to Monitor: September CPI, Fed meetings, earnings season (margin compression risk), geopolitical escalations, tariff policies.
Interestrates

Fed cut odds hit 97% ahead of Friday’s jobs report Markets are waiting for Friday’s U.S. NFP jobs report, which could heavily influence the Federal Reserve’s next move on interest rates.
Traders want a result that supports the case for rate cuts but doesn’t raise fears of a weakening economy. The ADP private payrolls report showed 54,000 new jobs in August. Stocks moved higher on the news, as wall street saw the number as weak enough for the Fed to cut rates in September, but not so weak that it signals a recession.
According to CME Group’s FedWatch tool, there is now a 97% chance the Fed will lower rates when it meets in two weeks.

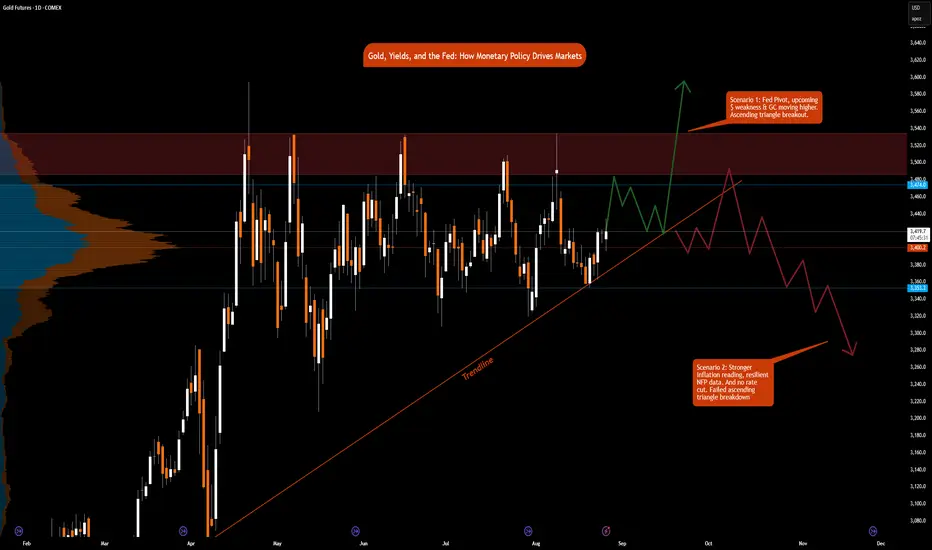
Gold, Yields, and the Fed: How Monetary Policy Drives Markets
Few forces shape global markets more than U.S. monetary policy. The Federal Reserve’s dual mandate, maximum employment and 2% inflation is the anchor for its decisions. For traders, understanding how these objectives translate into interest rate changes is critical for positioning in gold futures and across the yield curve.
The Fed’s Dual Mandate
1. Maximum Employment: Support jobs and minimize unemployment.
2. Stable Prices (2% inflation target): Prevent runaway inflation or deflation.
The Fed balances these goals using interest rates:
• Raising rates: Cools demand, strengthens the dollar, lifts yield, weighs on gold.
• Cutting rates: Stimulates demand, weakens the dollar, lowers real yields, supports gold.
The tension lies in the trade-off: controlling inflation often hurts employment, while boosting employment risks higher inflation.
Gold and Monetary Policy
Gold is highly sensitive to real interest rates (nominal yields minus inflation):
• Hawkish Fed: Higher real yields, dollar strength, gold struggles.
• Dovish Fed: Lower real yields, weaker dollar, gold rallies.
However, given the recent surge in gold prices despite higher rates, traders must ask:
• Will gold continue rising as odds of rate cuts increase, and when they are eventually delivered?
• Is the traditional correlation between the dollar and gold futures prices breaking down?
Gold’s rally has also been driven by geopolitical tensions and rising long term yields, reflecting rising debt burdens across the globe.
Yield Curve and Monetary Policy
The yield curve reflects expectations about growth, inflation, and Fed policy.
• Short end (1M–5Y): Anchored by Fed policy rates. If markets expect hikes/cuts, the front end moves first.
• Long end (10Y–30Y): Driven by expectations for long-term inflation, growth, and Treasury supply/demand dynamics.
Typically, investors and market participants watch for the following patterns:
• Inverted curve: Short yields > long yields, often a recession signal. See last year’s yield curve.
• Steepening curve: Usually follows Fed cuts, as front-end yields drop faster than the back end.
Two Classic Scenarios
Scenario 1: Inflation Stays High, Jobs Weaken
• Fed resists cutting, prioritizing price stability.
• Gold: Consolidates or weakens (real yields elevated).
• Yield curve: While the short end stays pinned, long end could rise on higher inflation risk and increasing debt worries, signaling stagflation risk.
Scenario 2: Inflation Stabilizes, Jobs Weaken
• Fed pivots dovish, prioritizing employment.
• Gold: Breaks higher on falling real yields.
• Yield curve: Steepens as short yields fall faster than long yields.
The Policy Backdrop
Powell’s last symposium before his term ends, at the Jackson Hole appearance, Fed Chair Powell delivered a dovish pivot, highlighting rising risks to the labor market while downplaying the inflationary effects of tariffs. The reasoning behind this shift deserves its own deep dive, but for now, our focus remains squarely on how monetary policy, specifically interest rate decisions, impacts inflation, growth, supply, and demand in the U.S. economy.
What’s on the Docket Until the Next Fed Meeting (September 17, 2025)
Markets will be glued to data in the coming weeks:
• Aug PCE / Core PCE (Aug 28–29) → Fed’s preferred inflation gauge.
• Aug NFP (Sep 5) → Labor market health; weak print strengthens the case for cuts.
• Aug PPI (Sep 10) → Upstream price pressures; hot numbers signal inflation risks.
• Aug CPI & Core CPI (Sep 11) → Key headline data; softer print supports dovish case.
• Fed Decision (Sep 17) → Will Powell stress inflation vigilance, or shift toward labor concerns?
How the Charts Tie It Together
• Gold Futures:
o Ascending Triangle breakout above resistance towards $3,600, if Fed pivots dovish and deliver a rate cut or a bigger rate cut.
o Ascending Triangle breakdown toward $3,350 if inflation remains sticky and the Fed holds. In this scenario, gold remains in balance overall.
• Yield Curve:
o Short end reacts directly to Fed rate expectations.
o Long end reflects investor conviction on inflation, growth and increasing debt concerns.
Takeaway for Traders
The Fed’s dual mandate creates a constant push and pull between inflation control and employment support. Gold and the yield curve are two of the clearest real-time mirrors of that balancing act:
• Watch short-term yields and gold to gauge how markets are pricing the Fed’s next move.
• Watch the long end of the curve to see whether investors believe inflation is truly anchored.
By linking economic data → Fed mandate → asset price response, traders gain a roadmap that works not just for this Fed meeting, but for every one that follows.
In our next educational blog we will briefly explore other policy tools used by the Fed i.e., QE and QT. Quantitative Easing and Quantitative Tightening.
FRED:FEDFUNDS ECONOMICS:USINTR
CME_MINI:ES1! CME_MINI:MNQ1! CME_MINI:NQ1! COMEX:GC1! MCX:GOLD1!
CBOT:ZB1! CBOT:ZN1!
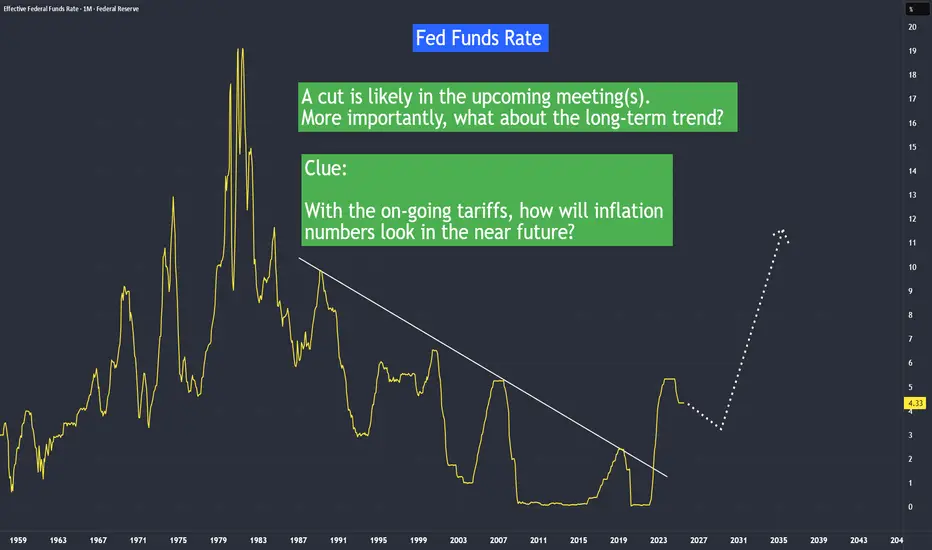
Interest Rate Projection In April, inflation was at its lowest point. It was also the month when the 'Liberation Day' tariffs were introduced, applying a 10% baseline tariff to most countries.
But it wasn’t until August—when the July Core CPI rose to 3.1% from its April low of 2.8%— and now investors began to question whether inflation will be trending higher in the near future with now higher tariffs set in after 1st August.
With a lower non farm payroll or job created the last three months, Fed has to pivot to the economy and likely to ease rates. The real challenge will be lower job numbers and higher inflation number in the coming months.
Which side will Fed pivot to?
Recession or Inflation?
10 Year Yield Futures
Ticker: 10Y
Minimum fluctuation:
0.001 Index points (1/10th basis point per annum) = $1.00
Disclaimer:
• What presented here is not a recommendation, please consult your licensed broker.
• Our mission is to create lateral thinking skills for every investor and trader, knowing when to take a calculated risk with market uncertainty and a bolder risk when opportunity arises.
CME Real-time Market Data help identify trading set-ups in real-time and express my market views. If you have futures in your trading portfolio, you can check out on CME Group data plans available that suit your trading needs tradingview.com/cme/
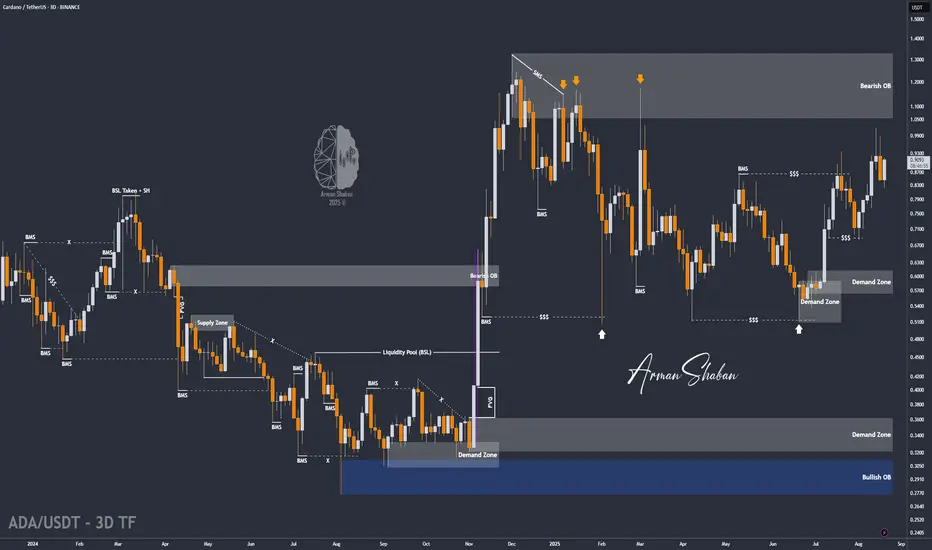
ADA/USDT | Cardano Breaks All Targets – Next Stop: Above $1?By analyzing the Cardano (ADA) chart on the 3-day timeframe, we can see that the price has surged exactly as expected, beautifully hitting all three targets at $0.85, $0.93, and $1! This move delivered an impressive 48% return. Following Jerome Powell’s remarks about the possibility of interest rate cuts in the coming months, Cardano saw renewed demand and has already risen from $0.82 to $0.91 so far. I expect this bullish momentum to continue, with a potential break and hold above the $1 level soon.
Hope you made the most out of this analysis!
Please support me with your likes and comments to motivate me to share more analysis with you and share your opinion about the possible trend of this chart with me !
Best Regards , Arman Shaban
IWM Appears Due for a Minimum 40-60% Downside CorrectionOn the lower timeframes IWM has been treating $223 as short term support with much sold put leverage building at $220 and recently IWM has begun to retrace back down into those levels putting those sold puts at risk of expanding the volatility and of squeezing through these short puts as a result.
The short term the loss of this zone could likely squeeze down to $200.
However in the longer term we have been trading within this much larger parallel channel since the peak and bottom of 2008-2009 GFC and have started to form a potential peak paired with a Bearish Shark. I think that if we were to start to see some serious downside the IWM could trade back down to not just the bottom of the channel but down to one of the 3 major horizontal supports I have plotted on the cart down at $121, $85.74, or even $41.11 if things get real bad.
Personally I will be targeting one of the 2 upper horizontal supports in the longer dated positioning while targeting the $210-$200 levels in the short term.
I'd suspect this decline to come especially as Fed Rate cut expectations are completely priced out of the market, it is worth mentioning that fed funds futures around the start of the month dropped their expectations of rate cuts for the September meeting down to 0 and we may now be on the path to pricing in rate hikes as seen in the chart below.
Alternatively the expectations for rates going into the end of December has been on a fast trajectory of pricing out rate cuts as well, starting at 90BPS of rate cuts at the start of the year, now pricing in only 37.5BPS in rate cuts:
This ongoing shift in these fed futures spreads from positive to negative signifies the amount that Fed Funds Futures are expecting the Fed to hike rates with both the instance of rate hikes and rate cuts likely to cause a collapse in credit spreads as the bond market yield shift higher leaving the interest rate sensitive IWM to be one of the most negatively affected.

Tariffs Effect on InflationIn April, inflation was at its lowest point. It was also the month when the 'Liberation Day' tariffs were introduced, applying a 10% baseline tariff to most countries.
But it wasn’t until August—when the July Core CPI rose to 3.1% from its April low of 2.8%— and now investors began to question whether inflation will be trending higher in the near future with now higher tariffs set in after 1st August.
10 Year Yield Futures
Ticker: 10Y
Minimum fluctuation:
0.001 Index points (1/10th basis point per annum) = $1.00
Disclaimer:
• What presented here is not a recommendation, please consult your licensed broker.
• Our mission is to create lateral thinking skills for every investor and trader, knowing when to take a calculated risk with market uncertainty and a bolder risk when opportunity arises.
CME Real-time Market Data help identify trading set-ups in real-time and express my market views. If you have futures in your trading portfolio, you can check out on CME Group data plans available that suit your trading needs www.tradingview.com

10Y Futures Case Study: Trading the Breakout with Defined Risk1. Introduction
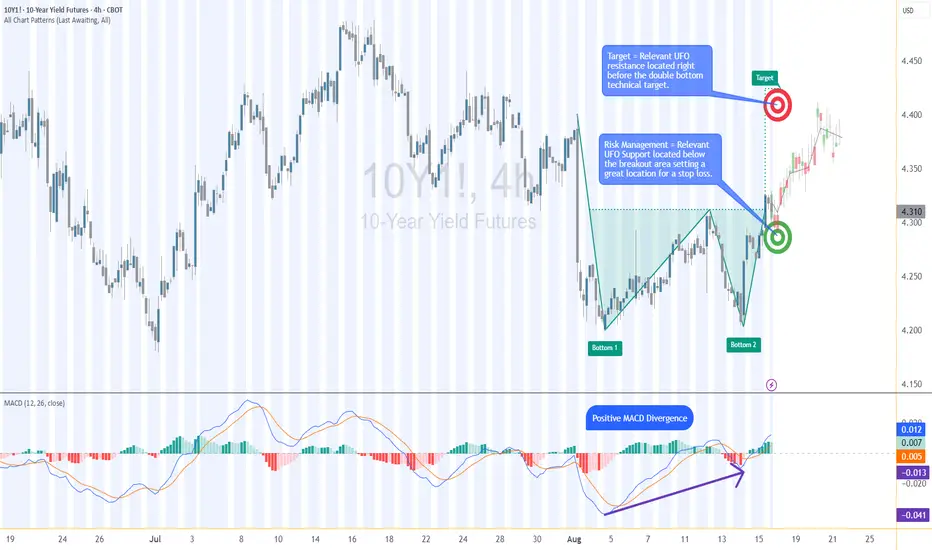
The 10-Year Yield Futures market has recently drawn attention as it builds a constructive base and attempts to shift momentum higher. After weeks of choppy movement, price action on the 4-hour chart has resolved into a breakout scenario that could define the next leg for yields. At the heart of this case study is a double bottom formation, a classical reversal structure, confirmed at 4.321. What makes this setup more compelling is the presence of nearby support and resistance zones, providing a precise technical framework to define entries, targets, and stop placement with discipline.
2. Double Bottom Pattern
The double bottom is one of the most reliable chart patterns signaling the potential exhaustion of selling pressure. It typically forms after a downtrend, with two consecutive troughs creating a strong support base before buyers regain control. In the current 10-Year Yield Futures chart, the first bottom occurred near 4.20, followed by a retest close to the same level. The neckline breakout emerged at 4.312, marking the confirmation point. Applying classical pattern analysis, the measured move points toward a target near 4.396. This alignment of structure and projection provides traders with a clear and objective technical roadmap.
3. MACD Confirmation
Momentum indicators often add depth to price action analysis, and the MACD (Moving Average Convergence Divergence) is one of the most widely followed. Built from the relationship of short- and long-term moving averages, it helps reveal underlying shifts in strength. In the current 10-Year Yield Futures chart, the MACD displayed a positive divergence: while price carved lower lows during the second bottom, the MACD lines began to slope higher. This divergence often signals weakening bearish momentum and the early stages of accumulation. In this case, it reinforces the validity of the double bottom breakout and its bullish potential.
4. UFO Support & Resistance
UnFilled Orders, or UFOs, represent areas where pending buy or sell orders may remain active, providing powerful zones of support or resistance. On the 10-Year Yield Futures chart, a key UFO support sits just below the breakout at 4.278, making it a logical stop-loss placement to protect the trade. Meanwhile, the upside target of the double bottom at 4.396 coincides with a UFO resistance zone. This overlap creates a clear exit area where supply may re-emerge. By combining classical charting techniques with order-flow–based zones, traders gain a structured plan that balances opportunity with risk control.
5. Trade Idea (Illustrative Case Study)
In this case study, the trade idea develops around the breakout point of 4.312 with the current price at the time of writing this article of 4.321. A trader could consider going long if the market sustains above this neckline level. The projected target is the resistance zone at 4.396, while the protective stop loss can be placed just below the UFO support at 4.278. This creates a defined risk profile with a reward-to-risk ratio of roughly 2:1. Alternatively, more conservative traders might consider a wider stop beneath the second bottom, offering more tolerance against volatility but at the expense of risk-reward efficiency. Both options maintain risk clarity and structure.
6. Contract Specifications & Margin Overview
The 10-Year Yield Futures (ticker: 10Y or 10Y1! on TradingView) is a cash-settled futures contract that tracks the 10-year U.S. Treasury yield directly. The gain or loss per tick per contract is as follows: 1 tick = 0.001 Index points (1/10th basis point per annum) = $1.00.
According to CME’s margin schedule (which changes as market conditions change through time), the current margin requirement is approximately $300 per contract. These relatively modest requirements make the product accessible while still providing meaningful exposure to U.S. interest rate markets.
7. Importance of Risk Management
Even with technically strong setups, the defining factor between consistent traders and inconsistent ones is risk management. Futures are leveraged products, meaning a small price move can translate into significant profit or loss. Using stop-loss orders helps enforce discipline, ensuring that one trade does not spiral into uncontrolled exposure. In this case, the support at 4.278 provides a logical technical area for a stop. Regardless of market outlook, avoiding undefined risk is key to long-term survival and consistency.
8. Closing Remarks
The alignment of a double bottom breakout, positive MACD divergence, and key support and resistance zones creates a textbook technical case study in the 10-Year Yield Futures market. With a clearly defined entry, target, and stop-loss, this setup demonstrates how combining price patterns with momentum and order-flow levels can help build structured trade plans. Yet, no analysis guarantees outcomes, and discipline remains at the core of every approach.
When charting futures, the data provided could be delayed. Traders working with the ticker symbols discussed in this idea may prefer to use CME Group real-time data plan on TradingView: www.tradingview.com - This consideration is particularly important for shorter-term traders, whereas it may be less critical for those focused on longer-term trading strategies.
General Disclaimer:
The trade ideas presented herein are solely for illustrative purposes forming a part of a case study intended to demonstrate key principles in risk management within the context of the specific market scenarios discussed. These ideas are not to be interpreted as investment recommendations or financial advice. They do not endorse or promote any specific trading strategies, financial products, or services. The information provided is based on data believed to be reliable; however, its accuracy or completeness cannot be guaranteed. Trading in financial markets involves risks, including the potential loss of principal. Each individual should conduct their own research and consult with professional financial advisors before making any investment decisions. The author or publisher of this content bears no responsibility for any actions taken based on the information provided or for any resultant financial or other losses.
XSP Fed Rate Cut AnalysisCBOE:XSP AMEX:SPY
Based on the chart, since the additional liquidity from the 620 range has been collected, before the Federal Reserve meeting on September 16-17 we could see prices dip to fill the FVG (611-617) and if that doesn’t hold the supply zone (604-610). I am bullish on the rate cuts due to the worsening job market and moderate inflation numbers previously reported including those caused by businesses like Walmart choosing to eat the trumps Tariffs. If rates do get cut, I am targeting 650 (1.618 fib extension). If not we can see a sharp move to the downside, returning back to test the Supply Zone.

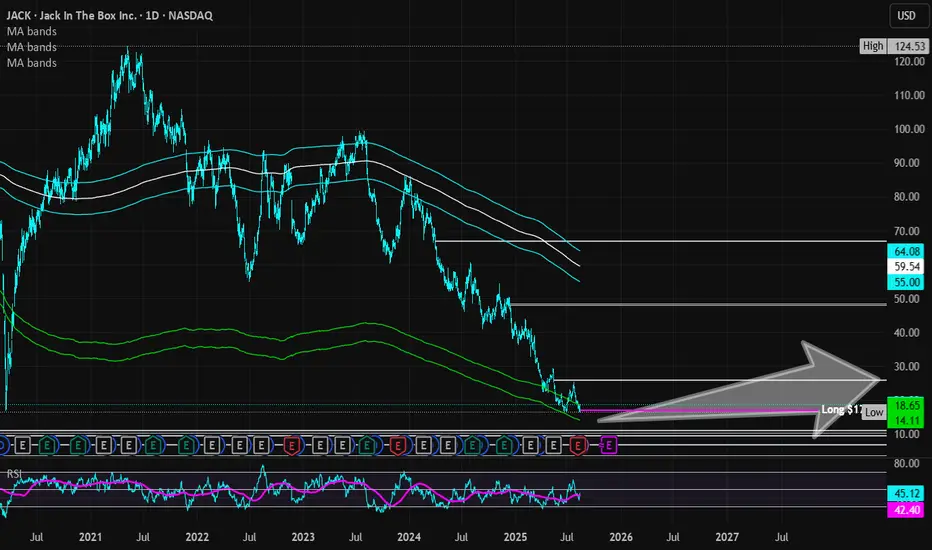
Jack in the Box | JACK | Long at $17.00**This is a reentry after cashing out of the original trade with gains. Basic writeup and technical analysis still apply which was originally written here:
Jack in the Box NASDAQ:JACK reentered my "crash" simple moving average zone. While there is a high chance the price may ride the lines down even further, there is currently a double bottom. A company like NASDAQ:JACK will benefit from interest rate cuts due to its significant debt, but it is a very risky trade. There are better companies out there.
However, with an 18 million float and 27% short interest, this could get very interesting as rates are cut. It's a gamble that hinges highly on company turnaround ("Jack on Track" plan) and the possible sale of Del Taco. Thus, at $17.00, NASDAQ:JACK is in a personal buy zone.
Targets into 2028:
$22.00 (+29.4%)
$26.00 (+53.0%)
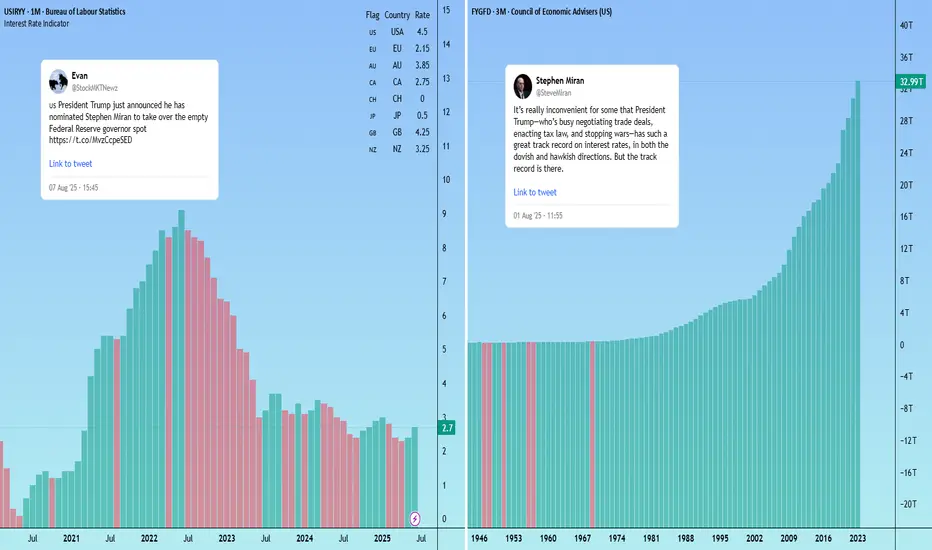
Trump’s Fed pick signals potential softer dollar US President Trump has named CEA Chair Stephen Miran as the temporary replacement for Fed Board member Adriana Kugler, serving until at least January 31, 2026.
As expected, Miran is closely aligned with Trump’s policy views, including support for tariffs and scepticism over the Federal Reserve’s independence.
Notably, Miran is a critic of the U.S. dollar’s current strength and is the author of the “Mar-A-Lago Accord” — a proposal to deliberately weaken the dollar to address the U.S. current account deficit.
The White House is also searching for a new Fed chair. If markets believe the next chair will prioritise Trump’s agenda over an independent monetary policy (a safe assumption at this stage) investors may demand higher yields on U.S. debt to hedge inflation risk. That could add volatility to US pairs.
$GBINTR -BoE Cuts Rates as Expected (August/2025)ECONOMICS:GBINTR
August/2025
source : Bank of England
- The Bank of England voted by a 5–4 majority to cut the key Bank Rate by 25bps to 4% in August, in line with expectations.
This marks the fifth rate cut since August of last year and brings borrowing costs to their lowest level since March 2023.
However, the decision followed an initial three-way split, the first time that two rounds of voting were required to reach a conclusive decision on interest rates.

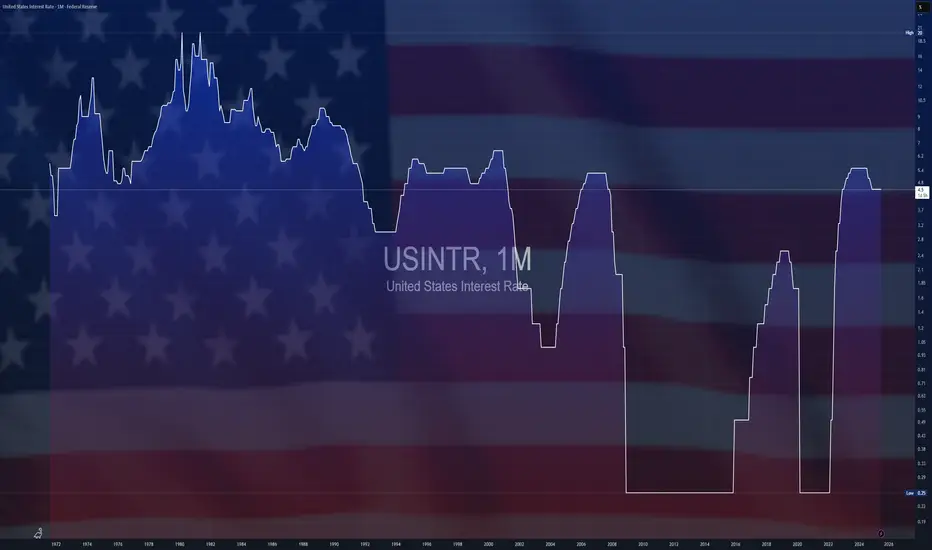
$USINTR -Feds Leaves Rates Steady (July/2025)ECONOMICS:USINTR
July/2025
source: Federal Reserve
- The Federal Reserve held rates steady at 4.25%–4.50% for a fifth straight meeting, defying President Trump’s demands for cuts even after positive GDP growth .
Still, two governors dissented in favor of a cut—the first such dual dissent since 1993.
Policymakers observed that, fluctuations in net exports continue to influence the data, and recent indicators point to a moderation in economic activity during the first half of the year.
The unemployment rate remains low, while Inflation somewhat elevated.
Data Release - Interest Rate DecisionJul 30 2025: Interest Rate Decision (4.5%)
Rates remain unchanged as expected.
OANDA:XAUUSD remains bearish with the help of GDP data.
TVC:DXY remains bullish with the help of GDP data. No major changes in either pairs.
Volatility is increased.
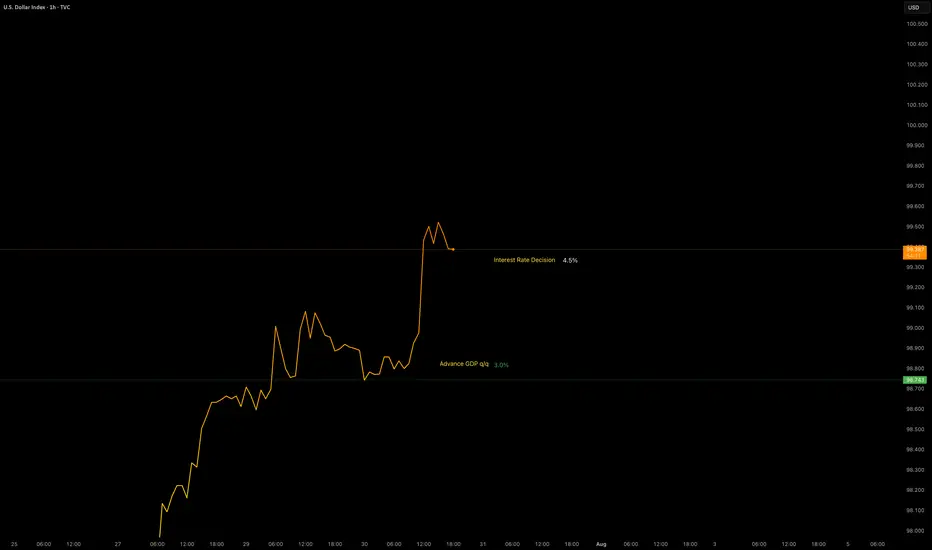
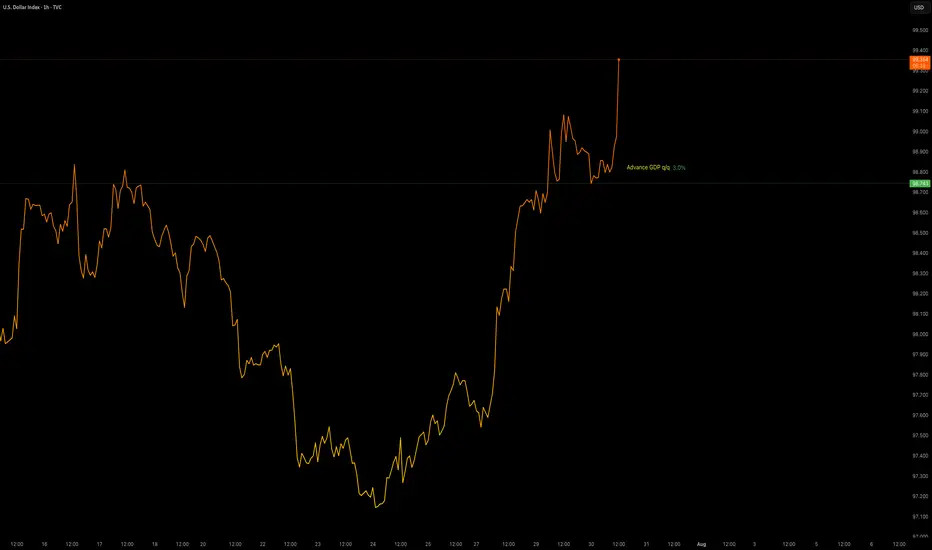
Data Release - Advance GDP q/q (3.0%)Jul 30 2025: ADVANCE GDP q/q (3.0%)
OANDA:XAUUSD sees some downside pressure with positive GDP data.
TVC:DXY gaining strength.
Volatility is increased. This data will be used with Interest Rate Decision later in the day to provide a XAUUSD insight.
$BTC Daily OutlookDaily Chart
Today’s close printed a small bearish doji; visually bearish but still another inside-day that keeps BTC boxed between the High-Volume Node / v-Level cluster at $116 860-$123 300.
Holding $116 860 remains critical; lose it on a daily close and price can easily slide to the weekly breakout shelf near $111 960. We are now 16 days inside this balance. Per Auction-Market-Theory rule #5, the longer price churns at the edge, the more resting liquidity is absorbed, eventually a decisive push will follow. If buyers defend $116 860 again, the path opens toward range high $123 300 and the prior ATH; if they fail, expect a fast flush to the weekly V-Level.
Footprint Read
Value Area High and Low span the full candle, with the POC parked mid-range, classic two-sided trade. Delta finished negative and the heaviest prints sit at session lows: sellers hit the bid hard, yet could not follow through. That absorption leaves shorts vulnerable to a squeeze if new selling momentum doesn’t appear quickly.
Fundamental Pulse – Week Ahead
ETF Flows: Spot-Bitcoin ETFs booked three consecutive inflow days to close last week (+$180 M net). Sustained demand under the range supports the bullish case.
Macro Data: U.S. FOMC & Federal Fund Rates prints for this week; expect more volatility starting from tomorrow.
Game Plan
Primary bias stays long while daily candles close above $116 860; upside trigger is a clean for now or shorts squeeze toward $123 300.
If $116 860 breaks with volume, prepare for a quick liquidity hunt into the weekly shelf at $111 960, where we reassess for swing longs.
Intraday: I’ll monitor the Intraday Chart on tomorrow's High impact events and look for best opportunities across the board. Alt window: a fresh downtick in BTC Dominance could spark rotation; watch high-Open Interest majors if BTC ranges.

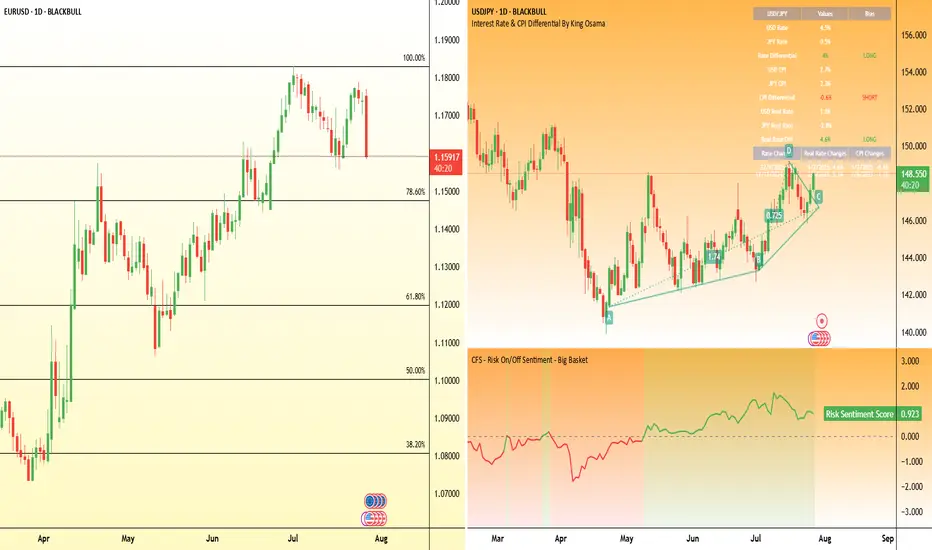
EURUSD ahead of the FEDEURUSD remains below the 1,1600 level following the trade agreement between the US and the European Union.
Today, all eyes are on the FED’s decision regarding interest rates.
Watch for a reaction around the support zone, as it may present an opportunity for the trend to continue.
However, it's advisable to reduce risk and hold off on new entries until after the news is released.

Countdown to Powell’s rate decision: What to watch WednesdayFederal Reserve Chair Jerome Powell is under mounting pressure from President Donald Trump to begin cutting interest rates.
Markets and analysts overwhelmingly expect the Fed to hold rates steady this Wednesday.
But what if the political heat is becoming too much to bear, and Powell and the Fed board advocate for a cut this week? Some Fed governors, Chris Waller and Michelle Bowman , have already signaled support for an early cut.
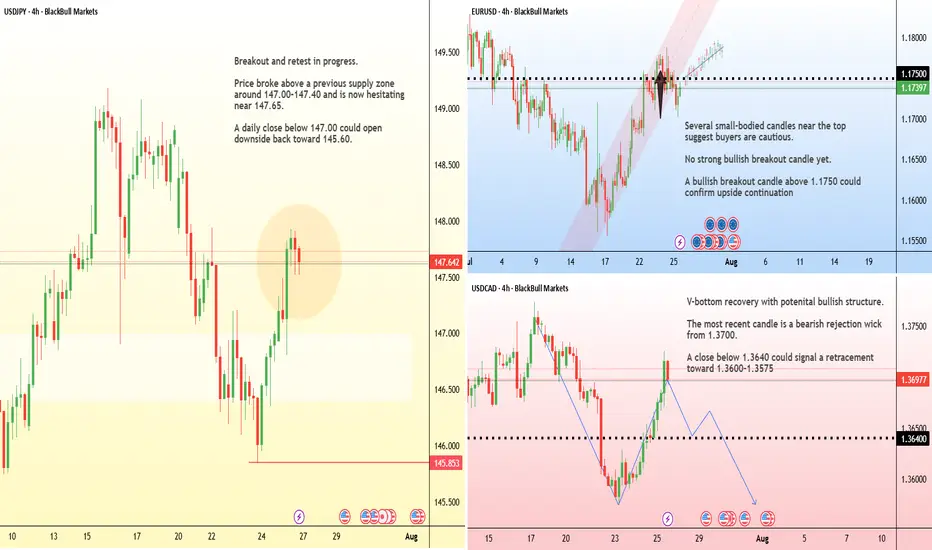
FX pairs to watch
USD/JPY:
This pair remains highly sensitive to yield differentials and broader risk sentiment. However, any hawkish resistance or emphasis on data dependency may keep the pair supported, especially if risk appetite holds.
EUR/USD:
The euro has shown relative strength in recent sessions, but the pair has been hit by the announcement of the trade deal struck between the EU and US. If the Fed clearly signals it's not ready to ease, the USD could regain even ground.
AUD/CAD’s Big Move: Don’t Sleep on This Breakout Setup!Hey traders, Skeptic from Skeptic Lab here! 🔥 While everyone’s freaking out over interest rate news and Non-Farm Employments , AUD/CAD ’s stealing the show on the daily time frame.
📉Post-tariff crash, it’s rebounding strong. A daily resistance break could kick off a major uptrend. Use RSI overbought/oversold ( linked in my TradingView article ) to confirm momentum.
👀Beware of fakeouts this week—volatility’s high! Trade smart, keep risk tight, and don’t FOMO. Share your thoughts in the comments, boost if it helps <3 🩵

Important week for EURUSDOn Friday, EURUSD reached a support level and bounced off it.
This week, all eyes are on the Fed's interest rate decision on Wednesday and the U.S. jobs data on Friday.
The trend remains bullish for now, and the upcoming news will likely determine the next move.
Today and tomorrow, the market may stay in a range as traders wait for the key events.
Don't rush into new trades and avoid using large position sizes!

Markets face a PACKED schedule this weekThe tariff truce between the U.S. and several major trading partners is set to expire on August 1 . A deal with Japan has already been reached, but talks with the EU, Canada, and Mexico remain active.
In monetary policy, the Federal Reserve is widely expected to hold rates steady at 4.5% during its midweek meeting .
Across the border, the Bank of Canada is also expected to leave its interest rate unchanged at 2.75% . After cutting rates twice earlier this year, the BoC is seen as entering a wait-and-see phase.
In Asia, the Bank of Japan will announce its decision on Wednesday . While the BoJ isn’t expected to hike this month, recent U.S.–Japan trade progress has opened the door for policy tightening later this year.
Finally, the week concludes with the U.S. Non-Farm Payrolls report on Friday. Economists expect job gains of around 110,000 in July, down from 147,000 in June.
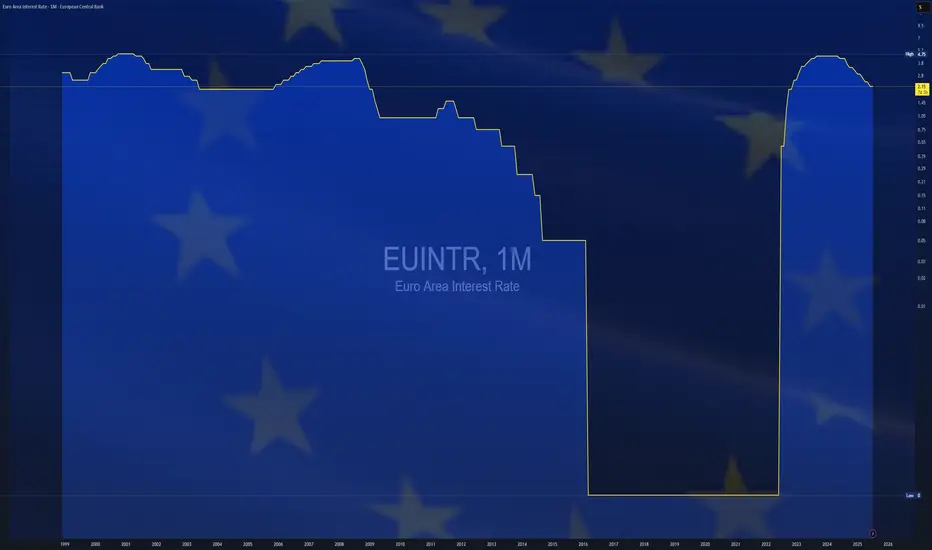
$EUINTR - Europe Interest Rates (July/2025)ECONOMICS:EUINTR
July/2025
source: European Central Bank
- The ECB kept interest rates unchanged in July, effectively marking the end of its current easing cycle after eight cuts over the past year that brought borrowing costs to their lowest levels since November 2022.
The main refinancing rate remains at 2.15%, while the deposit facility rate holds at 2.0%. Policymakers struck a wait-and-see stance, as they evaluate the impact of lingering trade uncertainty and the potential fallout from proposed US tariffs on economic growth and inflation.
Inflation hit the ECB’s 2% target in June, adding to the case for a pause in policy adjustments. Speaking at the ECB press conference, President Lagarde said the central bank is “in a good place” but acknowledged the difficulty in assessing how tariffs will affect price outlooks, given the mix of both inflationary and disinflationary pressures.
On the recent euro appreciation, Lagarde reiterated that the ECB does not target exchange rates directly but considers them when forecasting inflation.
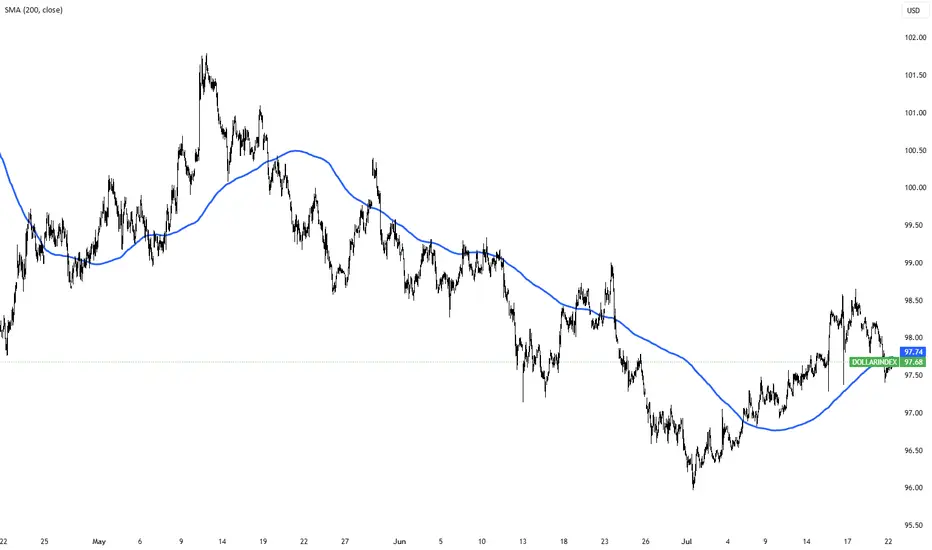
Dollar Index Holds Below 98 as Markets Await Trade Deal ProgressThe dollar index remained below 98 today, extending its two-day decline as investors watched trade negotiations ahead of the August 1 deadline. Treasury Secretary Scott Bessent said deal quality is the priority, suggesting Trump could grant extensions to countries showing real progress.
Markets are also focused on Fed Chair Powell’s speech for signals on interest rates. Despite Trump’s push for a cut, traders are not expecting action this month.