How to Day Trade or Swing Trade S&P500 Futures No IndicatorsHey Traders,
So over the years I bout alot of courses about trading the markets. In one course I took I learned about a reversal strategy using candlesticks on daily charts. Although in the past I didn't consider myself a Day Trader I found this strategy to be appealing for it using the Stock Index futures. So now I sometimes do day trade the market if I get the right setup. The good thing about his strategy is that you only need to check the market once a day to see if there is a setup. Then you just place your stop orders and limit orders according to your risk management or you can also use options.
Enjoy!
Trade Well,
Clifford
Technical Analysis

Fundamentals & Technical AnalysisHow to apply fundamental analysis and macroeconomic trends to complement your technical analysis and trading strategy
Fundamental analysis and macroeconomic trends are important tools for traders who want to understand the underlying forces that drive the market. Technical analysis, on the other hand, focuses on the price action and patterns of the market. By combining both approaches, traders can gain a more comprehensive and balanced perspective on the market and improve their trading strategy.
Fundamental analysis of the macroeconomic environment involves studying the economic, political, and social factors that affect the supply and demand of an asset. Some of the most relevant fundamental indicators are:
- Gross domestic product (GDP): This measures the total value of goods and services produced by a country in a given period. It reflects the economic growth and health of a country. A higher GDP indicates a stronger economy and a higher demand for its currency and assets.
- Inflation: This measures the change in the average price level of goods and services over time. It affects the purchasing power of money and the interest rates. A moderate inflation indicates a healthy economy with stable growth. A high inflation indicates an overheated economy with excessive money supply and a lower demand for its currency and assets.
- Interest rates: This measures the cost of borrowing money. It affects the profitability of investments and the exchange rates. A higher interest rate indicates a tighter monetary policy and a higher demand for its currency and assets. A lower interest rate indicates a looser monetary policy and a lower demand for its currency and assets.
- Trade balance: This measures the difference between a country's exports and imports. It reflects the competitiveness and demand for a country's goods and services in the global market. A positive trade balance indicates a trade surplus and a higher demand for its currency and assets. A negative trade balance indicates a trade deficit and a lower demand for its currency and assets.
To complement technical analysis and trading strategy, traders can use fundamental analysis and macroeconomic trends to identify the long-term direction and strength of the market, as well as potential opportunities and risks. For example, suppose a trader wants to trade EUR/USD, which is the exchange rate between the euro and the US dollar. The trader can use technical analysis to identify the support and resistance levels, trend lines, chart patterns, indicators, and signals on different time frames. The trader can also use fundamental analysis to assess the economic conditions and outlook of both the eurozone and the US, as well as their relative interest rates, inflation rates, trade balances, and other factors that affect their currencies.
Suppose the trader observes that the eurozone has a higher GDP growth rate, lower inflation rate, positive trade balance, and stable interest rate than the US. The trader can infer that the eurozone has a stronger economy than the US, which implies a higher demand for the euro than the US dollar. The trader can also observe that the EUR/USD is in an uptrend on the daily chart, with higher highs and higher lows, supported by a rising moving average. The trader can conclude that the fundamental analysis confirms the technical analysis, which suggests that EUR/USD is likely to continue to rise in the long term.
The trader can then use technical analysis to find an optimal entry point to buy EUR/USD. For example, suppose the trader sees that EUR/USD is retracing from a recent high to test a support level at 1.2000, which coincides with a 50% Fibonacci retracement level and a rising trend line. The trader can also see that there is bullish divergence between the price and an oscillator indicator such as RSI or MACD, which indicates that the downward momentum is weakening. The trader can decide to buy EUR/USD at 1.2000, with a stop loss below 1.1900 and a target at 1.2200.
By applying fundamental analysis and macroeconomic trends to complement technical analysis and trading strategy, traders can gain a deeper understanding of the market dynamics and enhance their trading performance.
If you are stock trading, you should consider the following fundamental indicators which are all readily available as trends on the TradingView platform:
- ROE (Return on Equity): This indicator measures how effective a company is in generating profits for its shareholders. It is calculated by dividing the net income by the shareholders' equity. A high ROE indicates that the company is using its resources efficiently and creating value for its owners.
- EPS (Earnings Per Share): This indicator measures how much profit a company makes per share of its common stock. It is calculated by dividing the net income by the number of outstanding shares. A high EPS indicates that the company is profitable and can potentially pay dividends or reinvest in its growth.
- DYR (Dividend Yield Ratio): This indicator measures how much dividend a company pays per share of its common stock relative to its earnings. It is calculated by dividing the total dividends by the net income or the dividend per share by the earnings per share. A high DYR indicates that the company is rewarding its shareholders with a steady income stream and has confidence in its future prospects.
- FCF (Free Cash Flow): This indicator measures how much cash a company generates from its operations after deducting capital expenditures. It is calculated by subtracting the capital expenditures from the operating cash flow. A high FCF indicates that the company has enough cash to pay its debts, invest in new projects, or return money to its shareholders.
- PEG (Projected Earnings Growth): This indicator measures how fast a company's earnings are expected to grow in the future relative to its current price. It is calculated by dividing the price-to-earnings ratio by the annual earnings growth rate. A low PEG indicates that the company is undervalued and has strong growth potential.
These fundamental indicators can help traders to identify stocks that are overvalued, undervalued, or fairly priced based on their financial performance and future prospects. They can also help traders to compare different stocks within the same industry or across different industries and sectors.

Learn 4 Classic Trade Confirmations
"Look for a confirmation!"
"Wait for a confirmation!"
When I was learning how to trade and when I was watching and reading different trading educators, these words naturally pissed me off. What the hell are you talking about? What confirmation?
It was a full-blown mystery...🤯
Then, once I started to mature in trading and trade full-time, I became an author on TradingView.
Posting my forecasts and trading setups, I frequently mentioned the confirmation.
And now the newbies that are reading me and learning from me are pissed off...🤬
That is so funny I guess.
But the truth is that the confirmation must become a fundamental part of your trading strategy. It is your key to successful trading.
What exactly is the confirmation?
It depends on many many different things, in this article I will discuss with you the 4 main types of confirmation and give you detailed examples.
1️⃣ - PRICE ACTION CONFIRMATION
That is actually what I prefer.
Analyzing different markets and searching for decent trading opportunities often times we find some peculiar instruments to watch.
Identifying the market trend and key levels we find the potential spots to trade from.
But do we just open the trade once the "ZONE" is spotted?
I wish it could be that simple...
Trading just the zone, without additional clues brings very negative figures. We definitely need something else.
Price action & candlestick patterns can be those clues.
Accurate reflection of the current local market sentiment makes the patterns a very reliable confirmation.
Dodji's, pin bars, double tops/bottoms ...
Proven by history, the skill of identification & reading the patterns will pay off quickly.
Being in some sense the language of the market, the patterns are the fundamental part of my trading strategy.
2️⃣ - FIBONACCI LEVELS
Fibonacci levels are a very popular technical tool. Being applied properly it helps the trader to confirm or, alternatively, disqualify the identified "ZONE".
With multiple different methods like confluence trading, fibs are applied in hedge funds and various banking institutions.
The main problem with the fibs, however, is complexity and a high degree of subjectivity. Meeting different traders and watching different posts on TradingView I noticed that all traders tend to have their own vision. There is no universal system to apply here, a proper fib.confirmation technique can be built only with long-lasting backtesting and practicing.
3️⃣ - FUNDAMENTAL NEWS
The figures in the economic calendar, news, tweets. Actual fundamental news can become your best confirmation tool.
However, the main obstacle right here is the promptness, validity and reliability of the data that you get.
The information shouldn't be delayed and it must be objectively true.
The search for such a source is by itself is a very time-consuming and labor-intensive business not even mentioning its potential costs.
And that is not all. Knowing how to make sense of that data, its proper perception, and understanding requires a solid economical and financial background and experience.
At the end of the day, becoming an expert in fundamental analysis , the trader can easily sort the trading zones and trade only the ones that are confirmed by a decent fundamental trigger.
4️⃣ - TECHNICAL INDICATORS
I believe all the traders apply some indicators. From a simple moving average to some complex composite algorithms, indicators play a very important role in trading.
Being 100% objective and providing up-to-date real numbers and figures, they are our allies in a battle against subjectivity.
For many traders, the various signals from indicators are considered to be accurate and reliable confirmations.
Many algotrading solutions are operating simply relying on such signals and being able to bring consistent profits proves the power of technical indicators.
What confirmation type should you rely on?🧐
I guess the main rule right here is that the confirmation must MAKE SENSE to you. You should feel the logic behind that. It must make you confident in your action, even in case of the occasional losses, it must keep you calm and humble.
Let me know in a comment section what confirmation do you prefer!
💝Please, support my work with like and comment!
Thank you for reading.
Let me know, traders, what do you want to learn in the next educational post?

One Trade Does Not Define Your Trading Performance...
Hey traders,
👨🏻💻I am trading forex for more than 8 years.
During the last 5 years, I am actively posting my analysis & trades on TradingView.
Growing my audience, it was very peculiar for me to contemplate the reaction of my followers to my trading performance.
(by the way, we must say thanks to tradingview where the posting system does not allow to delete the posted trades so that each and every author is easily backtestable).
👩👩👧👧👨👨👧👧Those who follow me at least a half a year know that occasionally I have winning streaks when 9 out of 10 of my forecasts play out nicely. Sometimes, however, I face the drawdowns and catch a sequence of losing trades.
And sometimes the performance is mixed with the probabilities being on my side slightly.
🥇While the reaction to winning streaks is quite predictable:
I am praised by the members and get nice tips.
The reaction to losing streaks is worth discussing in detail.
It turned out that quite a huge portion of a trading community has a completely wrong understanding of a trading nature.
🤬The single loss is considered by them to be a failure, a mistake.
Facing the sequence of losses, they quickly become negatively biased to the person that they have just recently praised.
With the continuation of a drawdown, they blame the analyst and launch a barrage of criticism towards him.
🔍Then they are in a search again. They are looking for a trader that will be constantly right. Catching the new one during a winning streak, the cycle repeats.
At some moment such people become disappointed in trading and drop this business...
❗️Losses, losing streaks and negative days/weeks/months are inevitable. If you want to become a full-time trader, you must be prepared for the fact that trading won't give you a stable income.
Your equity curve will be in constant fluctuation.
Your goal in this game is simply to lose less than you make.
You must become disciplined enough to keep following the rules of your trading strategy no matter what.
You must learn to be consistent in your actions.
You should learn to perceive losing trades not as a failure but simply as the moment when the market takes its share.
Feeding you, giving you the opportunity to make money out of thin air,
the market definitely has a right to claim its dividends from you.
⭐️Change your mindset, learn to lose and the magic thing will happen.
Let me know, traders, what do you want to learn in the next educational post?

MACD Indicator | How Does It Work? | Definition & Examples
MACD is a technical indicator designed to help investors identify price trends, measure trend momentum, and identify acceleration points to fine-tune market entry timing (whether you’re buying or selling).
How does MACD work?
The MACD indicator has many moving parts and functions, but it’s made up of three general components: the MACD line, which is the difference between two moving averages; a signal line, which is a moving average of the MACD line; and a histogram.
MACD takes the moving average concept a step further. It’s one thing to compare a fast and a slow moving average, but for MACD, that’s only the beginning.
First, the MACD line is calculated by subtracting the 26-day exponential moving average (EMA) from the 12-day EMA (i.e., fast minus slow). Why? The calculation is designed to show the relationship between the two averages, and it does so in a way that places emphasis on more recent price data.
The signal line is a 9-day (or 9-period) EMA of the MACD line. In other words, it’s a moving average of the difference between two moving averages, or a “slower” version of the difference between a fast and a slow moving average.
Why use a moving average of two other moving averages? The signal line calculation “smooths out” the MACD line, creating an even slower moving average that serves as the faster MACD line’s counterpart.
How do you read the MACD?
Pay attention to the moving averages—the MACD and the signal line—and their relation to the histogram.
Note that when the MACD line (the faster moving average) is above the signal line, the bars in the histogram are above the zero line, which is a bullish signal. When the MACD line is below the signal line, the histogram bars are below the zero line, which is generally bearish.
What do you want to learn in the next post?

Learn The Most Accurate Price Action Pattern
Hey traders, We must admit that it is phenomenally difficult to become a consistently profitable trader.
This journey requires years of practicing and training, constant losses, and nervous breakdowns.
If you are a struggling trader, if you are still looking for your way to succeed in this game, here is the formula that will help you to chase consistent profits.
💰Consistent profits = 📝Trading Strategy + 🤬Emotions + 📈Market Sentiment
Let's discuss each element separately.
📝Trading Strategy:
To be in profit in a long run requires an understanding of what do you actually trade.
You must have strict and objective entry conditions.
You must rely on the objective & verifiable rules for the execution of market analysis.
You must have a plan to follow.
A plan that is backtested and proved its efficiency.
🤬Emotions:
Even the best trading plan, the most accurate trading strategy can be easily beaten by emotions.
Emotional decisions such as revenge trading and early position close
can easily blow the account of any size in a blink of an eye.
The most disappointing thing to note right here is the fact that you can be taught how to execute technical analysis but you can not be taught to control your emotions.
Your main enemy here is yourself and being in a constant battle with your greed and fear it is very easy to go broke.
Only by being humble, disciplined and patient, you can successfully apply a trading strategy.
📈Market Sentiment:
Mastering your emotions and having studied a trading strategy, it looks like it is finally the time to make money.
However, occasionally the market tends to be irrational.
Being chaotic and unpredictable, sometimes the market neglects every technical and fundamental rule.
Crisis, euphoria: the reasons can be different.
The fact is that such things happen.
And it is your duty to learn to deal with unfavorable market conditions.
💰To become a consistently profitable trader, you must become the master of these three elements.
Only then the doors to freedom and independence will be opened to you.
Let me know, traders, what do you want to learn in the next educational post?

Price action vs Indicators =, Another lie in trading ? I did not go into the details of "lagging" as it relates to indicators. Which is a true statement but its a misunderstood statement in the trading industry because most people don't truly understand what that means and also there are a lot of indicators that are leading. However in this video when I say "lagging" I am referring to the general idea in fx that indicators are useless because they are using past data.

How To Trade the Triangle Consolidation Pattern!Hey Traders today I wanted to take a step back and show new traders the proper way of entering the market when it's consolidating in a triangle. Triangles are very common in trading and know how to identify them on your charts is a great tool to add to your trading arnsenal. Triangles can lead to explosive moves in financial markets so lets dive in and break it down to a science of how to trade it.
Enjoy
Trade Well,
Clifford

Learn The Most Accurate Price Action Pattern
Hey traders,
If you are learning price action trading, you definitely must know a double bottom pattern.
Double bottom is a reversal pattern.
It is applied to spot early market reversal clues and catch the initiation of a new bullish trend .
Preconditions for a double bottom:
1️⃣ The market must trade in a bearish trend .
2️⃣ After a formation of the last lower high, the price must set equal low.
3️⃣ The price must return back to the last lower high level.
✅Once these conditions are met the pattern is considered to be completed.
The formation of the pattern is considered to be a ⚠️WARNING sign.
Even though many traders buy the pattern once it is completed,
for me it is not enough.
❗️Remember that the price can easily start to consolidate and form a horizontal channel for example.
The trigger that we will look for is the breakout (candle close above) the last lower high level (based on a wick and its highest candle close) - the neckline.
Being broken to the upside, the market sets a new higher high.
It signifies a violation of a current bearish trend .
⬆️Attempting to catch an initiation of a bullish trend , we will buy the market with a buy limit order on a retest of a broken neckline.
❌Safest stop will lie below the lows of the pattern.
💰Your reward must be at least 1.5 of your risk.
Following these simple rules, you will be impressed by how accurate this pattern is!
Let me know, traders, what do you want to learn in the next educational post?

Mark Minervini's Trading MethodologyIntroduction
Mark Minervini is a successful stock trader, author and 2x US investment champion He was born in New York in 1966 and grew up in a family of traders. Minervini began his career as a stockbroker in the 1980s but soon realized that he could achieve better results by becoming a full-time trader.
Minervini is known for his impressive track record in the markets. He has achieved an average annual return of over 30% for more than five years and was featured in Jack Schwager's book "Stock Market Wizards: Interviews with America's Top Stock Traders." In the book, Minervini shares his trading philosophy and approach to the markets.
Minervini is also the author of the book "Trade Like a Stock Market Wizard," which was published in 2013. The book outlines his trading strategy and provides detailed guidance on how to identify and trade high-growth stocks. It has been praised by traders and investors for its clear and concise explanations and practical advice.
In addition to his trading and writing, Minervini is also a popular speaker and educator. He has given presentations and workshops on trading and investing around the world and has been featured in numerous financial publications and media outlets.
In this article, we will take a closer look at Mark Minervini's trading strategy and explore the key principles that underpin his approach.
Minervini's Trading Philosophy and Approach
Minervini's trading philosophy is centered on the idea that the stock market is an information market, where prices reflect the consensus view of all market participants. His approach is based on identifying and trading high-growth stocks that have strong fundamentals and are likely to outperform the market.
He looks for companies with accelerating sales growth, strong earnings growth, and relative strength. He believes that these companies are likely to continue to perform well and are therefore good candidates for investment.
To identify these stocks, Minervini uses a variety of techniques, including fundamental analysis, technical analysis, and market psychology. He combines these techniques to create a comprehensive trading approach that allows him to identify profitable trades and minimize risk.
The Stock Market Wizards Methodology
Minervini's approach is inspired by the trading methodology of the Stock Market Wizards, a group of successful traders who were featured in Jack Schwager's book "Market Wizards." The Stock Market Wizards approach involves identifying and trading high-growth stocks, using technical analysis to identify trends and opportunities.
Minervini has modified this approach to suit his own needs, adding his own techniques and insights to create a more comprehensive trading approach. He looks for stocks that are showing strong price action and have a high degree of relative strength. He believes that these stocks are likely to continue to perform well and are therefore good candidates for investment.
The Importance of Technical Analysis
Minervini believes that technical analysis is an essential tool for traders looking to identify profitable trades. He uses a variety of technical indicators and chart patterns to analyze the market and identify trends. Some of the key technical indicators that he uses include moving averages, momentum indicators, and breakouts.
Moving averages are used to identify the direction of the trend, while momentum indicators are used to confirm the strength of the trend. Breakouts are used to identify potential entry and exit points, allowing traders to enter a trade when the stock is showing strong price action.
Minervini also pays close attention to chart patterns, such as cup and handle patterns, double bottoms, and head and shoulders patterns. He believes that these patterns can provide valuable insights into market trends and can help traders to make informed decisions.
Risk Management Strategies
Managing risk is an essential part of Minervini's trading strategy. He uses a variety of risk management techniques to minimize losses and maximize returns. Some of the key risk management techniques that he uses include stop losses, position sizing, and diversification.
Stop losses are used to limit losses on individual trades. When a stock reaches a certain price level, the stop loss is triggered, and the trade is automatically closed out. This helps to limit losses and protect the trader's capital.
Position sizing is used to manage the amount of risk that the trader is exposed to. Minervini recommends that traders limit their exposure to any one stock to no more than 2% of their trading capital. This helps to limit losses in the event that a single stock performs poorly.
Diversification is used to spread risk across a portfolio of stocks. By investing in a variety of stocks, traders can reduce their exposure to any one stock or sector and limit the impact of market downturns on their portfolio.
Trading Psychology and Discipline
Trading psychology and discipline are critical elements of Minervini's approach. He believes that maintaining a positive mindset and avoiding emotional trading decisions are essential for success in the markets. He also emphasizes the importance of sticking to a trading plan and avoiding impulsive decisions.
To maintain a positive mindset, Minervini recommends focusing on the process of trading rather than the outcome. Traders should focus on following their strategy and making informed decisions based on their analysis of the market. They should avoid becoming emotionally attached to individual stocks and should not let fear or greed guide their decisions.
Sticking to a trading plan is also essential for success in the markets. Minervini recommends creating a detailed trading plan that outlines the trader's strategy, risk management techniques, and entry and exit points for each trade. Traders should stick to their plan and avoid making impulsive decisions based on short-term market movements.
Case Studies
To illustrate his trading strategy in action, Minervini provides real-world examples of trades that he has made using his approach. One example is his investment in pharmaceutical company Jazz Pharmaceuticals. Minervini identified Jazz as a high-growth stock with strong fundamentals, including accelerating earnings growth and strong relative strength. He entered the trade at a breakout point and used a tight stop loss to manage risk. The trade performed well, and Minervini was able to realize a significant profit.
Another example is Minervini's investment in medical device company Intuitive Surgical. Minervini identified Intuitive Surgical as a high-growth stock with strong fundamentals and strong relative strength. He entered the trade at a breakout point and used a tight stop loss to manage risk. The trade performed well, and Minervini was able to realize a significant profit.
Conclusion
Mark Minervini's trading strategy is a comprehensive approach that combines fundamental analysis, technical analysis, and risk management techniques to identify profitable trades and minimize risk. His approach is based on the idea that the stock market is an information market and that prices reflect the consensus view of all market participants.
Minervini's approach is inspired by the trading methodology of the Stock Market Wizards and incorporates a variety of technical indicators and chart patterns. He also emphasizes the importance of risk management techniques such as stop losses, position sizing, and diversification.
Maintaining a positive mindset and avoiding emotional trading decisions is also essential to Minervini's approach. He recommends sticking to a trading plan and avoiding impulsive decisions based on short-term market movements.
By following these principles, traders can apply Mark Minervini's approach to their own trading strategies and improve their chances of success in the markets.

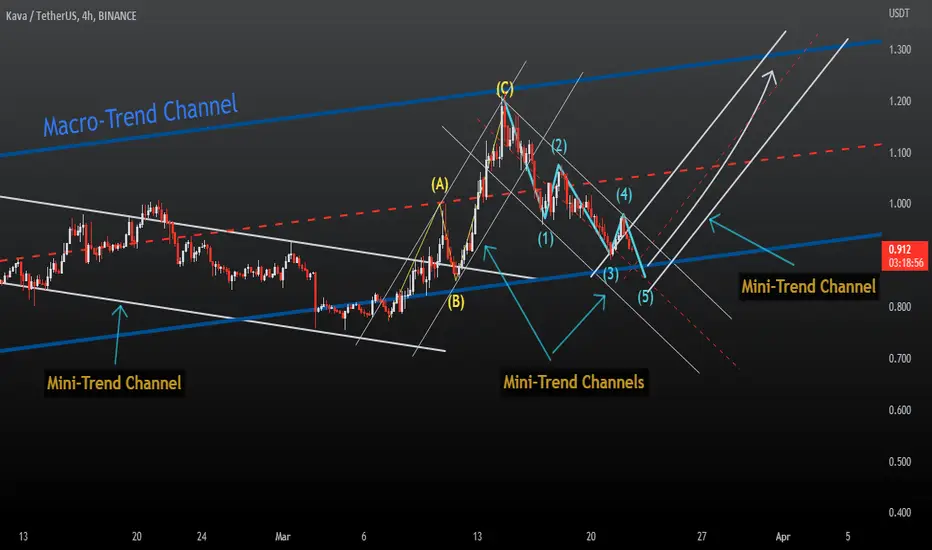
Trend Channels, One of the best trading strategy 🤓The channel is a powerful chart pattern for trading. Channels combines several forms of technical analysis to provide traders with entry and exiting points as well as risk control.
In this training, I will explain one of the simplest trading strategies called " Trend channel trading strategy ".
Please note, this post is a summary of this strategy and I only mention its main points.
😏
Types of channels and best for this strategy
A channel consists of at least four contact points because we need at least two low points to connect to each other and two high points to connect to each other. In general, there are three types:
Channels that are angled up are called ascending channels.
Channels that are angled down are descending channels.
Channels in which the trendlines are horizontal are called horizontal channels, range channels, trading ranges, rectangle channels.
The channels are also divided into three categories according to the time periods who make the price range :
Macro channels , which are made with 12-Hour time frame, daily time frame and above.
Mini channels , which are made with a time frame from 1-Hour to a maximum of 12-Hour.
Micro channels , which are made with time frames of less than 1-Hour.
**Tips:
1- Macro channels are made of Mini channels, and Mini channels are made of Micro channels, However, it is only an estimate and may not always be accurate, and they are Not the main rules and condition for Identifying channels or drawing them.
2- There is no special formula or law for naming the channels according to their time frames with these names (Macro, Mini and Micro) and you can use any time period for any type of channel.
Trade Reliability
Conformations represent the number of times the price has hits the channels trend lines and rebounded from the top or bottom of the channel. These are the important confirmation levels to remember:
1-2: Weak channel (not tradeable)
3-4: Adequate channel (tradeable)
5-6: Strong channel (reliable)
6+: Very strong channel (more reliable)
**these numbers are just for each one of trend line (up line or down line of channel).
I will write the continuation of this tutorial in the comments of this post. 😎
Scalper, Day Trader & Swing Trader | Choose Your Path
There are thousands of different ways to trade the market.
During the last 100 years, various trading strategies and techniques were invented.
One of the ways to categorize them is to split them by types of traders.
Such a category type will lean on 2 main elements:
trading frequency and time frame selection.
1️⃣ - Scalper
I guess 99% of newbie traders start from scalping.
Trying to catch quick market moves and become rich quick,
newbies are practicing different scalping strategies.
What is funny about scalping is the fact that such a trading style is considered to be the easiest by the majority while remaining one of the hardest in the view of pros.
The main obstacle with scalping is a constant focus and rapid decision-making.
Scalpers usually open dozens of trading positions during the trading session, most of the time being in front of the screen constantly.
Paying huge commissions to the broker and dealing with complete chaos on lower time frames, the majority simply can't survive the pressure and drop, leaving the pie to true gurus.
2️⃣ - Day Trader
Day trading or intraday trading is the most appealing to me.
Staying relatively active, the market gives some time for the trader for reflection & thinking.
Opening and managing on average 1-2 trades per trading session, the intraday trader is granted a certain degree of freedom.
However, with declining volatility , quite ofter intraday traders get a relatively low risk/reward ratio for their trades,
3️⃣ - Swing Trader
Swing trading is the best choice for traders having a full-time job.
Primarily being focused on daily/weekly time frames, swing trading is not demanding for a daily routine and aims at catching mid-term/long-term market moves.
With an average holding period being around 2 weeks and opening 1-2 trading positions per week, swing trading is considered to be the least emotional and involves low risk.
The main problem with swing trading is patience.
Correctly identifying the market trend and opening a trading position,
the majority tends to close their positions preliminary not being patient enough to let the price reach their target.
Which trading type do you prefer?
Let me know, traders, what do you want to learn in the next educational post?

THE MOST USEFUL TRADING SITES ...and how to utilize themIn this post, I will share the some of the most useful trading sites that are available to you and how you are able to utilize them to your advantage whether it's for fundamentals, charting, analysis, performance tracking, news events or just to follow your favorite professionals and their ideas & education that they share publicly.
First and foremost, if you haven't made this your PRIMARY trading platform, I want to encourage you to use and SUBSCRIBE to TRADINGVIEW
As we all evolve as traders, I'm sure we can all relate to one thing in common which is hard work and dedication. Trading is one of the hardest professions out there and without hard work, practice and dedication, we know that 90% of traders fail to make it in this industry. TRADINGVIEW gives you all the resources you need to be able to become one of the 10% as it enables you to become a content creator, it gives you a community to research ideas, you're able to watch livestreams, catch news flows, back test & analyze your own strategies and most importantly of all, you have direct support team to help guide you by sharing their own personal trading experiences, publicly as well as privately. Whether your choice of market is Forex, Stocks, Crypto, Bonds, Futures, Commodities or Yields, TRADINGVIEW has all the tools to be able get you well on your journey to become a professional trader.
See Figure 1: Subscriptions
WWW.MYFXBOOK.COM
MYFXBOOK has a variety of different tools to use ranging anywhere from position size calculators, COT data (Commitment of traders), Broker spreads/quotes/volumes, news flows, correlations and most importantly, account linked performance analysis. You may be a full time trader or a part time trader with a 9-5 job, either way analyzing your entries, exits, RR ratio, drawdowns etc. are necessary to find what works and what doesn't. Trading is about probabilities and if you're not making money in 25 trades, you need to reanalyze and change your approach. Myfxbook.com allows you to link your trading platform to breakdown your performance, ultimately being your own coach to find the approach that suits you the best.
See Figure 2: Performance Stats
WWW.TRADINGECONOMICS.COM
As many different crises happen throughout the world (especially the most recent ones within the last few years), understanding how the Federal Reserve operates to manage monetary policy is key to get an edge in your positions in the forex market. TRADINGECONOMICS gives you all the accurate information needed to be able to forecast and research throughout 196 countries like, economic indicators, exchange rates, stock market indexes, government bond yields and commodity prices. Micro and Macro economics are a big part of how this world operates and having access to all the most important information that drives the Feds decisions due to the economy being split between these two realms are valuable as they could be bridged together for more accurate forecasting.
See Figure 3: Inflation Rates/GDP Growth (By Country)
WWW.FOREXLIVE.COM
FOREXLIVE has many different helpful resources to keep you up to date in the market no matter what time zone or trading session you take part in. As our lives are busy with family, day jobs, business endeavors or simply being in different time zones, you may not be able to watch all sessions play out and in fact, taking a break from the screen is healthy for your mind and emotions. The great thing about FOREXLIVE is that you are able to read Session Wraps to keep you up to date with a summary after each session (Asian, European, U.S) completes. Psychology is a big part of why a trader either succeeds or fails which balancing your time on and off the markets are important to detach your emotions from your positions. Set a plan for how many times you will scan the charts a day and fill that in between time with activities like exercising, reading, chores, spending time with your family, going for a walk and much more.
See Figure 4: Session Wraps
WWW.INVESTOPEDIA.COM
INVESTOPEDIA was founded in 1999 headquartered in the heart of New York city U.S. This website provides comparisons of financial products, reviews, ratings, comparisons of different financial products and most importantly, it is a financial dictionary. With the broad range of information provided, it gives readers the confidence to manage every aspect of their financial life. Whether you're learning about money and investing for the first time or are looking to improve your knowledge and skills, anyone from an experienced investor, a business owner, a professional, an advisor, INVESTOPEDIA has all the information to build your skills.
See Figure 5: 4 Basic Things to Know About Bonds/Key Takeaways
WWW.INVESTING.COM
INVESTING.COM is a well known site that offers real-time market quotes, information about stocks, futures, options, analysis, commodities and most importantly an economic calendar. Keeping an eye out for the high impact news events will help you adapt and control the volatility during those peak hours. Another helpful aspect of this site is knowing what will drive the market mood for each upcoming week. The top 5 most important fundamental areas to watch for are explained and broken down to help your forecast and analysis so you can prepare your trade setups accordingly. Applying fundamental analysis along with technical analysis will help you become a better trader as when the high impact news events hit, markets get volatile which could cause a running profit turn into an absolute loss. Knowing when to be in or out of the market is valuable so you don't go into a draw down phase.
See Figure 6: Economic Calendar
As I only have mentioned a small number of sites that you are able to access, we all know there are so many other ones available out there, paid and free.
Researching and spending the time to read to broaden your knowledge in the financial world will only help you grow as a trader and essentially improve your trading results.
Check out some more free sites:
www.fxstreet.com
www.dailyfx.com
www.forexfactory.com
www.babypips.com
Please share the site that most helps you in by leaving it in the comment section. I would love to see the variety of ones available.
** If you felt this was helpful in anyway, please support by hitting the LIKE button and FOLLOW me for more educational and analysis ideas **
I appreciate all the feedback!
Thanks
Trade Safe

Learning Plan: 13 Essential Topics to Study in Trading
Hey traders,
I receive dozens of questions each and every day concerning the topics to study to become an expert in technical analysis .
Here I have collected the main subjects that, in my view, are essential for successful trading.
*the order of the topics is spontaneous and there is no logical sequence
1️⃣ - Candlestick patterns
To me, candlesticks are very important for understanding market behavior. A single wick quite often can tell you a story.
Mastering different candle stick patterns, you will be impressed by how much data and information you may derive from analyzing them.
2️⃣ - Price action patterns
At first glance price chart is complete chaos.
The market looks irrational and it feels like there is no way to read it.
Price action patterns are the language of the market.
With them, the price fluctuations start to make sense.
3️⃣ - Support & resistance
All my predictions, all my trades & signals are always based on support & resistance levels.
These are the levels that make the market change its direction, they influence the market so much, therefore you should learn to identify them and constantly hold them on focus.
4️⃣ - Supply & demand zones
The only difference between support & resistance and supply & demand zones is the fact that the first ones are represented as levels while the second ones are represented as the zones.
The identification of these zones is very important for proper market analysis.
5️⃣ - Key levels
Key levels are the strongest supports and resistances.
Of course, spotting various supports and resistances on the chart,
we can not say that they all are equal in their significance.
There is a strong (however subjective) hierarchy of them.
The most significant are called key levels and from them, the most significant moves are always expected.
6️⃣ - Trend analysis
When I teach my students how to analyze the price chart,
I always start with a trend analysis topic.
Knowing where exactly the market is going,
having specific and objective rules for the trend identification
are necessary for successful trading.
7️⃣ - Top-Down analysis
Multi-time frame analysis is my passion.
I am constantly combining the signals & observations from different time frames to make my trading decision and predict future market moves.
It proved to be a very efficient method of trading various markets.
8️⃣ - Financial instruments
Though to many it may sound obvious, in practice I know that a lot of people are struggling with a simple question "What to trade?".
You must learn to properly build your watchlist and you should have strong reasoning behind the selection of each unite that is inside.
9️⃣ - Trend following trading
As we know, the trend is our friend. And even though the phrase itself is very simple and straightforward, it takes so much effort and time to learn to follow the trend properly.
1️⃣0️⃣ - Counter trend trading
Occasionally the market reverses. Properly identifying early reversal signs and then catching a sharp counter-trend move, huge profits can be made.
Even though such a style of trading is considered to be extremely risky, being applied properly will generate a lot of cash.
1️⃣1️⃣ - Risk management
Losses are inevitable.
They are part of the game and we can do nothing about that.
The only thing that we can do, however, is to control the losses.
Calculating the risk for every single transaction is essential to avoid a margin call.
1️⃣2️⃣ - Leverage trading
Leverage selection, margin are the things that are tightly connected with risk management topic.
These are the terms that you must know how to operate with.
1️⃣3️⃣ - Trading psychology
Playing with real money, occasionally losing significant portions of your trading account can be a tough game.
It takes time to build a strong psyche to deal with the irrationality of the market.
Which topic to start with?
Pick any, learn it, study it.
They all are equally important so at the end of the day you need to cover them all in order to become successful.
Let me know, traders, what do you want to learn in the next educational post?

How to Trade the Markets - Step 1 - Creating a LifelineHello,
In this video series i will be walking you through my new approach on how i am currently trading the markets.
Step 1 - Creating a Lifeline
We need to create a lifeline that factors no more than 2% on a stop loss playing the current daily candle. I will show you how to enter and factor in a stop loss for security in your capital.

How Leverage Really Works | Margin Trading Explained
Leveraged trading allows even small retail traders to make money trading different financial markets.
With a borrowed capital from your broker, you can empower your trading positions.
The broker gives you a multiplier x10, x50, x100 (or other) referring to the number of times your trading positions are enhanced.
Brokers offer leverage at a cost based on the amount of borrowed funds you’re using and they charge you per each day that you maintain a leveraged position open.
For example, let's take EURUSD pair.
Let's buy Euro against the Dollar with the hope that the exchange rate will rise.
Buying that on spot with 1.195 ask price and selling that on 1.23 price we can make a profit by selling the same amount of EURUSD back to the broker.
With x50 leverage, our return will be 50 times scaled.
With the leverage, we can benefit even on small price fluctuations not having a huge margin.
❗️Remember that leverage will also multiply the potential downside risk in case if the trade does not play out.
In case of a bearish continuation on EURUSD , the leveraged loss will be paid from our margin to the broker.
For that reason, it is so important to set a stop loss and calculate the risks before the trading position is opened.
Let me know, traders, what do you want to learn in the next educational post?

Classic Reversal Pattern You Must Know
☑️WHAT IS THE RISING WEDGE PATTERN?
The rising (ascending) wedge pattern is a bearish chart pattern that signals a highly probable breakout to the downside. It’s the opposite of the falling (descending) wedge pattern (bullish). A rising wedge can be both a continuation and reversal pattern, although the former is more common and more efficient as it follows the direction of an overall trend.
The rising wedge consists of two converging trend lines that connect the most recent higher lows and higher highs. In a rising wedge, the lows are catching up with the highs at a higher pace, which means that the lower (supporting) trend line is steeper.
☑️KEY FEATURES
• The price action temporarily trades in an uptrend (the higher highs and higher lows)
• Two trend lines (support and resistance) that are converging
• The decrease in volume as the wedge progresses towards the breakout
The third point is seen more as a boost to the validity and effectiveness of the pattern, rather than a mandatory element. And it is applicable either for stocks trading mostly.
☑️SPOTTING THE RISING WEDGE
Identifying a rising wedge is not so difficult. As a first step, you should eliminate all types of wedges that are present in the sideways-trading environment. The ascending wedge occurs either in a downtrend as the price action temporarily corrects higher, or in an uptrend.
☑️TRADING THE RISING WEDGE
Trading the rising wedge pattern is pretty easy. After we correctly identified the pattern all we need to do is wait patiently for the breakout of the wedge to the downside. After the breakout is confirmed(usually at least a 4H candle needs to close below the broken level) we can place a limit order to short the pair on a pullback giving us a better risk to reward ratio. The correct Stop Loss should be placed above the last higher high established by the wedge before the breakout. What concerns the Take Profit level, it must be based on the technical levels below( If there are any). If not, then we might use Trailing Stop or just choose a minimal acceptable RR of 1:1,5
❤️Please, support our work with like & comment!❤️
What do you want to learn in the next post?

How to Trade With Relative Strength Index (RSI) Indicator
Hey traders,
Relative strength index is a classic technical indicator.
It is frequently applied to spot a market reversal.
RSI divergence is considered to be a quite reliable signal of a coming trend violation and change.
Though newbie traders think that the application of the divergence is quite complicated, in practice, you can easily identify it with the following tips:
💠First of all, let's start with the settings.
For the input, we will take 7/close.
For the levels, we will take 80/20.
Then about the preconditions:
1️⃣ Firstly, the market must trade in a trend ( bullish or bearish )
with a sequence of lower lows / lower highs ( bearish trend ) or higher highs / higher lows ( bullish trend ).
2️⃣ Secondly, RSI must reach the overbought/oversold condition (80/20 levels) with one of the higher highs/higher lows.
3️⃣ Thirdly, with a consequent market higher high / lower low, RSI must show the lower high / higher low instead.
➡️ Once all these conditions are met, you spotted RSI Divergence.
A strong counter-trend movement will be expected.
Also, I should say something about a time frame selection.
Personally, I prefer to apply it on a daily time frame, however, I know that scalpers apply divergence on intraday time frames as well.
❗️Remember, that it is preferable to trade the divergence in a combination with some price action pattern or some other reversal signal.
Let me know, traders, what do you want to learn in the next educational post?

Learn How Support Becomes Resistance
Support and resistance levels are important points in time where the forces of supply and demand meet. These support and resistance levels are seen by technical analysts as crucial when determining market psychology and supply and demand.
Support is the level at which demand is strong enough to stop the asset from falling any further.
Resistance is the level at which supply is strong enough to stop the asset from moving higher.
The psychology behind support and resistance.
First let’s assume there are buyers who’ve been buying a stock close to a support area. Let’s say that support level is $50. They buy some stock at $50 and now it moves up and away from that level to $55. The buyers want to buy more stock at $50, but not $55. They decide if the price moves back down to $50, they will buy more. They’re creating demand at the $50 level.
Let’s take another group of investors. They were thinking about buying the stock at $50 but never did before. Now the stock is at $55 and they regret not buying it. If it gets to $50 again, they will not make the same mistake and they will buy the stock. This creates potential demand.
The third group bought the stock below $50; let’s say they bought it at $40. When the stock got to $50, they sold their stock, only to watch it go to $55. Now they want to buy it back at the same price they sold it, $50. They’ve changed their sentiment from sellers to buyers. This creates more demand.
A key concept of technical analysis is that when a resistance or support level is broken, its role is reversed. If the price falls below a support level, that level will become resistance. If the price rises above a resistance level, it will often become support. As the price moves past a level of support or resistance, it is thought that supply and demand has shifted, causing the breached level to reverse its role.
Thanks for reading bro, you are the best☺️
Like, comment and subscribe to boost your trading!
Dear followers, let me know, what topic interests you for new educational posts?

Market Reversal & Candlestick Pattern | Spot & Trade It Like Pro
Candlestick patterns are frequently applied for the identification of early trend reversal signs.
Here are the three most common reversal formations that you may encounter trading different markets:
1️⃣ - Equal inside bar formation
Once the price reaches some important pivot point quite often it tends to form a weak candle with a long rejection wick (long in comparison to the buddy of the candle).
In case if the consequent candle's body has the same range, we call that the equal inside bar.
It can be treated as the reversal formation ONLY with additional confirmation.
Without an additional trigger, chances will be high that the market will start a sideways movement instead.
2️⃣ - Engulfing candle
Once the price reaches some important pivot point quite often it tends to form a weak candle with a long rejection wick (long in comparison to the buddy of the candle).
In case if the consequent candle's body engulfs (has a bigger range) the previous candle, we call that the engulfing candle.
By itself, it is a quite strong reversal signal and can be applied as a trigger for opening a trading position.
3️⃣ - Engulfing candle (2X)
Sometimes, the engulfing candle engulfs not only the previous candle but also one more preceding one.
We also can call such a candle a high momentum candle.
It is considered to be the strongest reversal formation (among these 3) and can be applied as a signal for a trade entry.
❗️Remember that candlestick patterns work only on strong pivots /structure levels. Being formed on random levels, the performance of these formations is relatively low.
Let me know, traders, what do you want to learn in the next educational post?

How to Use the Exponential Moving Average (EMA)The Exponential Moving Average (EMA) is a popular technical indicator used by traders to identify trends and make informed trading decisions. In this TradingView idea, we will discuss how to use the EMA in your technical analysis.
Step 1: Understanding the EMA
The EMA is a type of moving average that gives greater weight to more recent prices, making it more responsive to changes in the market. The EMA is calculated by taking the average of a set number of price data points over a specified time period, with more weight given to recent data points.
Example:
Let's say you are using 20-day and 50-day EMAs to identify trends and potential buy/sell signals. You notice that the 20-day EMA is above the 50-day EMA, indicating that the stock is in an uptrend. You then wait for the price of the stock to pull back to the 20-day EMA before buying in, as this could provide a good entry point. Conversely, if the price falls below the 20-day EMA, this could be a potential sell signal.
Step 2: Identifying Trends with the EMA
One of the primary uses of the EMA is to identify trends in the market. When the price of an asset is above the EMA, it is considered to be in an uptrend, while when the price is below the EMA, it is considered to be in a downtrend. Traders can use the EMA to identify potential buy and sell signals based on the direction of the trend.
Example:
Let's say you are using the 50-day EMA as a dynamic support or resistance level. You notice that the price of the pair has been consistently bouncing off the 50-day EMA, indicating that it is acting as a support level. You then decide to go long on the pair when the price approaches the 50-day EMA, with a stop loss below the EMA in case the price breaks through.
Step 3: Using Multiple EMAs for Confirmation
Traders can also use multiple EMAs to confirm trends and potential buy and sell signals. For example, using a shorter-term EMA, such as a 20-day EMA, in conjunction with a longer-term EMA, such as a 50-day EMA, can provide a more comprehensive view of the trend and potential trading opportunities.
Example:
Let's say you are using the 10-day, 20-day, and 50-day EMAs to confirm trends and potential buy/sell signals. You notice that the 10-day EMA is above the 20-day EMA, which is also above the 50-day EMA, indicating that the trend is up. You then wait for the price of gold to pull back to the 10-day or 20-day EMA before buying in, as this could provide a good entry point. Conversely, if the price falls below the 50-day EMA, this could be a potential sell signal.
Step 4: Using the EMA as a Dynamic Support or Resistance Level
In addition to identifying trends, the EMA can also be used as a dynamic support or resistance level. When the price of an asset is approaching the EMA, traders can use the EMA as a potential support or resistance level, depending on the direction of the trend.
In conclusion, the EMA is a versatile and powerful technical indicator that can be used for a variety of trading strategies. You don't need a complex setup to be successful in trading, just using simple indicator such as EMA can make trading highly profitable.
Vector -->

How to find strong Support and Resistance levels using MA.Hey Traders!
Above is a brief video in which i explain a simple way to find strong support and resistance zones using the moving average indicator starting from bigger timeframes to smaller ones.
i hope this video is useful for you!
let us know your questions in the comment section!
Joe.

👊 Support And Resistance Levels Explained 👊The fundamental concepts of technical analysis are support and resistance levels. Technical analysis strategies are based on psychological and mathematical patterns from previous periods. One such pattern is resistance and support levels, which determine the most likely price direction change or confirmation of trend continuation.
They can be used by both new and experienced traders.
In this article, we will learn what support and resistance lines are, how to draw them correctly, and how to apply this knowledge to real-world trading.
Fundamental Concepts
You must first understand what support and resistance levels are before you can begin adding them to the chart. They are critical indicators of a collision between upwardly and downwardly oriented players, known as bulls and bears. Traders pushing prices up or down will eventually reach a point where the opposing group is equally opposed.
Support is the price level that "defends," or prevents, the price from falling lower. Resistance is the line that prevents the price from rising and thus resists its rise.
A resistance line can become a support line as a result of price fluctuations, and vice versa.
Support is defined as two or more lows, and resistance is defined as two or more highs.
Once the price reaches a point of extremum on the chart, you can begin outlining the line, and the second extremum allows you to completely draw the support or resistance line. Because extremes are rarely repeated, the line is roughly drawn in the middle of them if the difference between them is insignificant. If the price spread between the marked extrema is large, the price range between these points is marked for the line, and traders are guided by it when drawing lines.
In a sideways trend, determining resistance and support levels is easier. With large price changes, the possibility of defining support and resistance lines incorrectly is very high.
There can be both strong and weak opposition and support. The time frame and number of price touches on the line define the line's strength. The higher the time frame, the more touches there are, as well as the strength of the resistance or support line. The length of the time frame is more important than the number of touches.
In general, the support and resistance lines indicate areas where the probability of a price correction increases.
The Notion Of A Trend
One of the indicators used to calculate support and resistance levels is trend strength. A trend is a price movement up or down over a long time period. The price of an asset can fluctuate, but if its minimums are consistently going up, the trend is upward, if the maximums are going lower, the trend is downward. On the stock market, a visually identifiable trend is used to assess long-term investments and the likelihood of success of short-term speculation.
How to trade using trend? The following algorithm is used for this purpose.
The trend line is determined by the price of the asset.
The Ultimate Beginner’s Guide To Trend Trading
How the trend line behaves when it contacts the support and resistance lines is examined. If the uptrend line breaks out a strong resistance line at the second or third try, then there is a considerable probability of further price growth. Conversely, the price of an asset is more likely to move down if it breaks out a strong support level.
What Factors Affect Support and Resistance Levels
You should consider psychological and fundamental factors when drawing support and resistance lines. In general, the price cannot constantly rise or fall. After breaking out at significant levels of support and resistance, the likelihood of a psychological phenomenon known as "traders' remorse" increases as many players reconsider the future trend of asset price development. This happens as a result of the following factors:
Fundamental: market or security indicators do not provide a basis for further price movement;
Psychological: as prices rise and fall, people begin to doubt the validity of future moves.
Profit fixing: achieving certain price points gives players a reason to fix their profits by monitoring the situation's evolution.
If a large enough number of traders "repent" and close their positions, the price will return to the support or resistance level, and the trend will reverse.
Correct Levels of Support and Resistance
Surprisingly, there is no widely held consensus on how support and resistance lines should be named, nor are there any clear, specific descriptions of the relationship between extremums and lines. Nonetheless, the majority of traders believe that resistance and support levels are horizontal lines drawn at the highest and lowest price levels.
Resistance lines are drawn on the maximums of impulse movements during an uptrend, and supports are formed on the minimums of corrective movements. The next low overlaps the next maximum, converting the resistance level to a support level. On the downside, the previous high coincides with the previous low, and the support level becomes a resistance level.
Some traders believe that oblique support and resistance lines drawn through highs and lows are trend lines.
Support and resistance lines can also be drawn through supply-price pivot points, also known as TD-points, which are upper extrema surrounded by lower extrema. The maximum point is the one above which prices have not moved in a specific time period, and the minimum point is the one below which prices have not moved in a specific time period.
Over time, each trader determines for themselves the best way to draw support and resistance lines for their specific purposes. Some traders are limited to identifying lines that are close to circular values, that is, lines that end in zero.
Based on previously formed reversal levels, it is also used to determine resistance and support levels.It is expected that if the price has previously bounced from a certain level, it will do so again. In this case, the trader must carefully analyze price dynamics and draw the lines by hand.
Each method can correctly determine support and resistance levels or it can lead to errors; it all depends on the trader's skills.
How to Draw Levels of Support and Resistance:
Consider the fundamental principles of drawing support and resistance lines.
Finding at least two minimum (maximum) points for the support (resistance) line These points are frequently close to the significant round number of the traded asset. Such closeness can be explained by the work of trading algorithm authors and traders, who prefer to be guided by visual values.
The drawing of lines from these points into the future They can be horizontal, with a positive or negative slope, or both. There may be several such lines on a single chart.
an examination of the significance of the obtained lines of support and opposition.
The third step is the most important. It considers the received charts from the following positions:
The hourly line is more important than the minutely line, but it has less value when compared to the weekly line.
Length: the longer the resistance and support lines on the chart, the more important they are as a signal of a trend reversal or trend development for the trader.
A few finishing touches As the number of lows and highs on which the support and resistance lines are based grows, so does their credibility.
Trading volume: If asset price areas of contact with support or resistance lines are accompanied by increased trading activity, it indicates that the lines are viewed as indicators by many traders.
Only after analyzing the lines' significance in relation to the aforementioned points can you begin using them in trading strategies.
How to Use Resistance and Support Levels in Live Trading
There are numerous approaches to working with support and resistance lines. Even though there is a wealth of educational material available on the Internet, learning how to use support and resistance lines requires practice.
To begin with, it is trading on a pullback and a breakout. This method assumes that if the price encounters significant support or resistance, it will most likely reverse. If the trend is strong, the price can cross any level and continue to rise. This strategy entails only placing orders in the direction of the current trend.
Trading on support and resistance levels is possible in a horizontal price channel. In this case, trades are opened when the price approaches the upper boundary of the channel, with the expectation of a resistance line crossing or a price rebound and fall. Price support and resistance lines, rather than price points, are taken into account to a greater extent. Which trend will prevail must be determined by auxiliary tools on the chart, such as bar and candlestick behavior.
Not all levels of opposition and support are equally strong. A level's "strength" refers to the accuracy of its signal: a breakout indicates the continuation of a strong trend, whereas a reversal indicates the start of a new movement in the opposite direction. In the market, false breakouts are common. Use the recommendations below to avoid them.
Step 1: Keep an eye on the time frames.
Look for extremes on a daily and weekly basis. They can be considered strong if they at least partially coincide with extrema in lower time frames. Market makers are frequently active in the M5-M15 time frame. The approximate accumulation zone for stop orders can be determined using the depth of the market and the logic of private traders. With large volumes and trigger stops, market makers pull the price to the required zone, obtaining an asset at the best price.
Step 2: Count the number of touches.
The finer the level touches, the better. Note that the line must be drawn on exact touches without "pulling wishful thinking."
Support And Resistance Levels In Forex Trading
In the forex market, strategies based on support and resistance lines may be considered basic. In particular, trading within the price corridor is applied in case of price bounces - buying on a bounce from the upper boundary and buying on the approach to the lower one. In this case, stop orders are set either above or below the boundaries.
Trading along the lines is useful in distinctly determined trends. For instance, if you are in a downtrend, you should monitor the upward correction to the previous support level and the new resistance level. If we talk about uptrend, the correction to the previous resistance and the new support should be monitored.
Still, breakout trading is one of the most popular strategies in the forex market. It requires defining support and resistance levels as precisely as possible. In this strategy pending orders are placed just above or just below resistance levels.
Summary
Support and resistance levels are essential when analyzing any chart, either currency pair or cryptocurrencies. The major problem in doing so is knowing how to identify levels and place lines correctly. This is a practical skill, as there is no unambiguous definition of how to determine the support and resistance lines accurately. The task of defining them can become easier due to the fact that there are numerous auxiliary tools on trading platforms to determine them. Many trading strategies are based on support and resistance lines, and their effectiveness, by the way, also depends on the trader's practical skills.
By understanding the principles of levels application, you can not only improve your trading system but also learn to understand the market better and assess its prospects.
