On Balance Volume Test #2 - TeslaI have been back testing the On Balance Volume indicator (OBV). So far, so good. I did not publish my first test (Facebook), but will publish from here on.
OBV is basically an accumulation/distribution indicator. When there is divergence, it shows weakening/strengthening markets. If you are unfamiliar with OBV, look it up.
Here is what I found with Tesla:
OBV test 2: TSLA
Tesla started becoming volatile in 2014.
Tesla set a new all-time at #1. Leading up to the 2nd all-time high (#2), notice the OBV flattened out. It was weak on the move up. They soon corrected.
On the 3rd attempt (#3) to reach their all time high (#2), the OBV was trending down.
On the 4th try, the share price could not reach their all time high, but the OBV was showing signs of strengthening. It soon corrected again.
But, on the 5th try to set a new high, the OBV had rebounded quite well from its low and was trending up nicely. The OBV also climbed higher than the OBV from #4 high.
Tesla soon broke out of their long channel and went up substantially from there.
It is my opinion that OBV gave warning signs that Tesla was not ready to break out. The conviction was not there until after the #4 high. Also, notice the OBV up moves were stronger than the OBV down moves... with the exception of the OBV from #1 to #2. But, the move from #1 to #2 was telling you the opposite - it was telling you the down moves were stronger than the up moves, therefore the sustainability of the new all-time high (#2) was not that great.
Lol, I hope you can understand my cluster of lines and numbers on my chart
As I always say... this should NOT be taken as advice. Always do your own research before making any investment decision.
Technical Analysis

PREDICION FRIDAY - EURUSD wedge breakoutTraders,
First REMEMBER: These predictions are just for the fun. And are not actually trade's i look to take. It is for building my discretion into the markets and note things to keep improving my trading. ENJOY! :)
Daily:
The daily price is very bearish and putting in some desceleration candle's. This usually means the bulls are getting out of their positions which means selling pressure. The price is near the descending trendline which is pretty respected during the previous outside returns. This is also a nice indication. The price also touched the 50% retracement. The 50% retracement is not a fibonacci number but it is very respected in the markets.
The 20 EMA Is also touched with an Doji signal.
240:
The price is creating a nice wedge pattern. The 50% retracement is hit with a rejection candle with a big wick on the upside of the candle which means sellers where active after the bulls where pushing the price up!
The 100 EMA seems is also respected.
Potential entry:
It could be an entry after the wedge pattern is broken to the downside.
Potential targets:
Targets i would've looked to set into the next previous support. (The red line, scroll to the left to see the support)
Potential stoploss:
Stoploss i would've look to set 1 ATR (240 chart) above the high of this potential retracement. This because than i put my SL above all these levels i used for my intial analysis.

EURAUD Full Analysis & Short-term & Long-term Prediction !#1, We want to see short-term downside until we find nice buy opportunity. We are still in bullish trend !
#2, For now, We look for sell from the above resistance area.
Relate this idea with your setup and see if its connecting something similar.
This publishing is for educational purpose only.

EURJPY Full Analysis & Short-term & Long-term Prediction !By seeing the current price action all the way from the higher timeframes, we can predict more downside after short-term upside gains !
Relate the above chart analysis with your skill.
This publishing is just for educational purpose only.

EURGBP Full Analysis & Short-Term & Long-Term Look !Simple ! Relate the chart by your own skill.
This publishing is just for educational purpose only.

How I use rectangles for analysisHere is a video of how I use rectangles as my support and resistance zone


NSC, Norfolk Southern Corp. - Trend Analysis & PatternsNYSE:NSC
Why do I choose technical analysis for trading?
Because the psychological state of traders / investors is always a representation on a scale between greed and fear, which creates in all markets patterns that repeat themselves for more than a hundred years, and if you are aware of their % profitability, and the difference between the amount of profit compared to the amount of loss, you would know statistically how your account would behave.
And if you would know how to manage your capital in terms of recapitalization and allocation, then I see no reason not to operate in this way.
This is also confirmed by my results with respect to the theory. The % of annual profits, maximum drawdowns and periods of underwater that are extremely aligned with the results of my backtest made right on this type of trading.

Where BTC goes next? Market doesn't know yet...
hey traders,
very interesting market sentiment on BTC.
currently the market is approaching a key level of support,
and reaction on this level will most-likely determine Bitcoin's future direction.
for now, be focused on the narrow support area between 9000 and 9500.
if bears break and close below it, I will expect bearish continuation to lower structure levels
with initial target 7500
if bulls break and close below the falling vertical resistance,
I will expect bullish impulse to 11000
good luck!

USDCHF Trading Plan: Decision Zone
USDCHF is currently trading in a wide trading range between two significant structure levels.
The breakout will determine the market future direction.
Our plan is to wait for a candle close above/below the structure level,
then we can take action accordingly.
Target levels:
Resistance - 0.99
Support - 0.96


EG short?EG SHORT 01/July/19
My analysis is based 90% on Technicals (TA) and 10% fundamentals.
it's adamant to understand that both parties are in the losing position in regards to the geopolitical turmoil happening inside the EU council and UK parliament, both are losing out. Fundamentally concluding that this pair can swing both ways impulsively, as history dictates.
TA
#EURGBP - daily chart: the price is currently at a descending channels resistance level at 0.89740 (the channel formed since the highest price in August 2017 @0.92470)
RSI showing weakening momentum and also showing signs of divergence (signifies reversal may be due)
Since the impulsive drop from Dec 2018 to the current support level, at the lowest yearly price 0.83521, EURO has been regaining its strength. It looks like it’s due for correction following the rise, AND it’s already made its bearish move with a DAILY ENGULFING candlestick.
BUT, on weekly it’s not clear that the bears have started taking control, we are seeing a bearish evening star, however, weekly bearish price action is needed to confirm. Based on Daily we can speculate a devaluation of EUR in favour of GBP. EURGBP DOWN
SCENARIO:
Short at current price 0.89310
SL 0.9000 just below yearly resistance (retested 4 times) to let room for the trade to ‘breathe’
TP1 (mirror level) 0.88440
TP2 (support/resistance FLIP ZONE) 0.87010
OR
Wait for price to break below hourly resistance 0.89290, with either ENGULFING or other price action, and get in on the retest
OR
Sometimes we can only plan so much, the market moves where it wants to move, so an alternate scenario would be LONG EG if bullish engulfing candle breaks the current daily resistance (doubtful). Get in on the retest
TARGET: min 150 pips up to 500 pips
ESTIMATED TIME: 7-30days
Do you agree? Let's discuss :D
Goodluck
IDEA IS SOLEY FOR EDUCATION AND RECORD KEEPING (USE AT OWN DISCRETION)

USD/CAD BEARISH MARKET STRUCTURE*-CONSECUTIVE LOWER HIGHS AND LOWER LOWS
*-REJECTED WITH A PIN BAR OF 1.30684 SUPPORT ZONE
*-WE MIGHT SEE A CORRECTIVE PRICE BEHAVIOUR
*-POSSIBLE CORRECTIVE STRUCTURE UP TO 1.33 FIB/RES/TRENDLINE
*-I AM SEEING A POSSIBLE NICE DOWNTREND HERE AFTER WE HAVE BROKEN A MASSIVE&HUGE IMPORTANT UPTRENDLINE
*-PRICE MIGHT ALSO CORRELATE WITH 50 EMA
*-WAITING TO SEE SOME PRICE ACTION/CANDLESTICK PATTERNS ON MY POCKET BEFORE ENTERING A LONG TRADE
*-BE CAREFULL OF NFP THIS FRIDAY
*-ITS BETTER TO CLOSE ALL OPEN TRADES BEFORE NFP
#tradesafe #education #bestsetup #learn #freecontent

BTC in the most important RES areaas you can see in the picture, these days the BTC is facing with its most important resistance area in weekly time frame.
during this weeks if the price can breaks that, we will have a new long term buy signal! and if can't, we will encounter with the unbreakable support area at the blue zone.

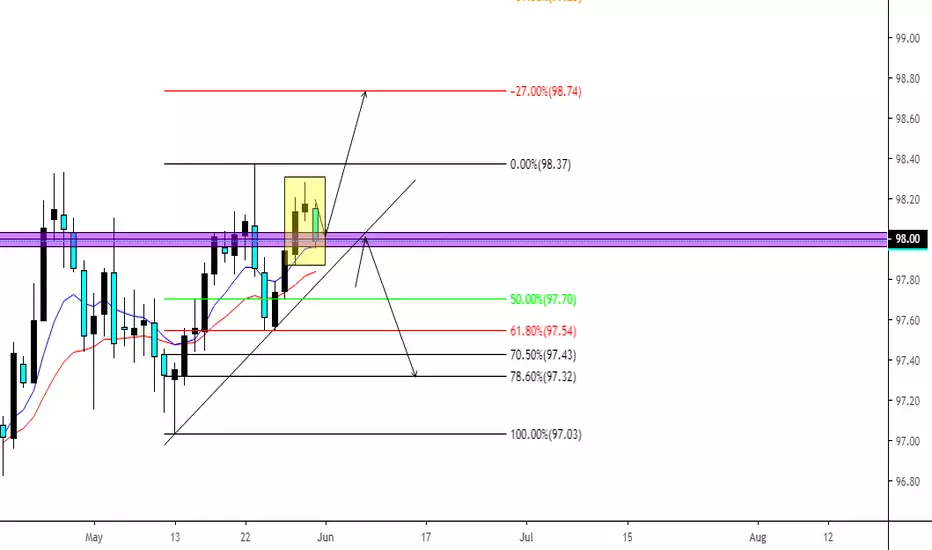
DXY (US DOLLAR INDEX) LONG BIASIf Dollar Index Weakens XXX/USD goes up. If Dollar Index Strengthens XXX/USD does down.
Looking at DXY I can see a Reversal Pattern form inside the box with a Pin Bar, Doji and what looks to be a Bearish Engulfing Candle. However, the market is uptrending & this could easily be a retest on 98.00 for a continuation upwards to fulfill the -0.27% extension.
Plan A:
We have got a fair bit of USD news coming out in 5 hours following this week will be NFP and Client Sentiments show that the vast majority of Retail-Traders are Shorting the USD and Longing XXX/USD, So I choose to observe the masses and do the opposite which is have a long Bias on USD...Also I dislike going against the trend of the market;)
Plan B:
I will not be looking to Short the USD unless there is a clear break of the Counter-Trend line.
Targets at -0.27%
Talking About Breakouts
The discussion is based on my recent trading plan for EURUSD.
How to identify false breaks and avoid traps.

POWER of the WEDGEOne of my favourite tools is wedge patterns.
Last year the AUDUSD was a dream to trade using the wedge pattern.
An 'ascending wedge' pattern approaching a level of resistance indicates a sell opportunity is coming up (reversal).
To trade the pattern you will wait for a break below the wedge line before selling, with stop losses above the highest level in the wedge.
A 'descending wedge' pattern approaching a level of support indicates a buy opportunity is coming up (reversal).
To trade the pattern you will wait for a break above the wedge line to enter a buy position with a stop loss below the lowest low in the wedge.
Give it a go!

SHORT OPTION FOR EJ POSSIBLE HERE TO TP 3 AS A TARGET This is what I see. I see it as pretty self-explanatory. Some of my other charts are experiments with tools i am using, reason that i post as an educational piece as i am still learning myself.

NZDUSD BUY Technical Analysis:
-Micro downtrend broken and is now being retested on the backside
-Longer term uptrend has a 3rd touch and aggressive bullish candle from the two trend lines
-Support & Resistance in the purple zone
-Correlation with bullish AUD
*Did not look at trading plan before executing this trade*
*Similar to the AUDJPY call but this was a little later and now price was closer to both the trend lines and we were actually here for the bullish respect*

forexTrdr Sunday Setups: EURUSD ALL EYES ON THE PRIZE.. 100DMAHi all and welcome to our Sunday Setups a new technical analysis piece where we are looking to showcase our work and highlight our 20 years of professional trading experience at the worlds best Investment Banks.
Our aim is to keep analysis simple so that anyone can follow and learn from our work and hopefully our past performance highlights why we are different.
Interested in finding out more? Head over to our profile page and please give us a follow
Please comment and leave feedback- we will be bringing our analysis via video soon
First on the agenda is EURUSD- as per chart we have a descending trendline dating back to September, what we are looking for here is a potential retest of the 100 day moving average (1.1367) before a pull back to year to date lows and a move to 1.1130 area over the next few weeks. Risk is we have a break out to the upside and escape out of the descending trendline towards 1.142 area. Countering that however, from tech perspective, the pair is at the top of the overbought range on RSI (bottom chart).
From fundamental side European growth continues to come in at the lower end of recent performance and the ECB has announced further stimulus through the extension of TLTRO- a form of cheap funding to the banking sector. US continues to storm ahead on growth and looks to have bottomed out in January- last weeks NFP looks nothing more than a fluke number which occurs from time to time. This week we have Fed meeting on Wednesday where we expect to hear comments around growth having bottomed out at start of year and a pickup in economic activity in line with what we are seeing in other forward looking indicators and Chinese stimulus.
Week Ahead
Tuesday 19th March:
German ZEW Survey - very low impact
US Factory Orders & Durable goods - low impact
Wednesday 20th March:
Fed Meeting - potential for high impact
Thursday 21st March:
European consumer confidence - low impact
Trend :
Descending trendline since the high on 24th September
Series of lower highs and lower lows since start of 2019
Tech levels:
Major keys to upside:
1.1367 the 100 day moving average and around the top of the descending trendline from September
1.1418 February high
Major keys to downside:
1.1290 January low
1.1235 February low
1.1187, 61.8% retracement of 2017 low to 2018 high
1.1177, YTD low

Flat bottom triangle on the GBPUSD M15With a flat bottom Triangle or any triangle as a matter of fact, we have opportunity to go in either direction, top or bottom.

AUDUSD SELL #ForecastTechnical Analysis:
-4h has reversed twice off of the Monthly resistance we have
-4h candle has also closed below our trend line
-On the 1h you can see how nicely price broke through the trend line, it technically already retested it and dropped so we may not see it happen again.
-Purple zone is in confluence with fib levels and where we had price drop on the hourly before
-We have a market shift in momentum to the downside on the 1h
-Wait for price to get into the purple zone and print a reversal or exhaustion pattern before selling
** I would be careful with this since EURAUD looks to be dropping as well and selling both would be a little contradictory. But, it can 100% happen. **
