INDENTIFYING TRENDS LONG/SHORT TERM!!Just wanted to share a little insight into identifying trends and positioning yourself in the market for minimising risk and maximising profit! Its import to identify trends both short and long term to understand which direction price is heading and possibly reversal points. Top down analysis mixed with key levels and trend patterns is how I look at the market without getting to technical, and candle formations from these areas is where I look at entering positions.. everyone has there own trading style and this is just what works for me, I don't like to over complicate it with a million indicators, trendlines etc. I recommend finding a strategy that works for you and sticking to it, there are a heap of different ways to trade...
Technical Analysis

WHAT IS LEVERAGE IN FOREX?
“Leverage” means using a small amount of your own money in order to control a much larger amount of money. Typically, you borrow the remaining amount through your broker.
For example, say you want to control a $50,000 position. Your broker might put aside $500 of your own money and borrow the remainder. You now have control over the $50,000 with just $500 from your own account, so your leverage ratio is 100:1.
Now, let’s say the $50,000 investment rises by $500, so the full position is now worth $50,500. If you were liable for the full $50,000 (representing a 1:1 ratio), this is only a 1% return on your investment. However, since you only put in $500 of your own capital, the $500 increase represents a 100% return on your investment – that’s way more exciting!
Now, it’s important to understand that this cuts both ways. If you lost $500 instead of gaining $500, you would see a -100% return on your investment. Yikes! If you had a 1:1 ratio and put in the full $50,000 you would only see a -1% return.
How Much Can You Leverage in Forex?
Before you open an account with a broker, you’ll want to check the maximum leverage ratio that you’ll be able to use. The higher the ratio, the bigger your potential gains or losses. Brokers will usually offer 50:1, 100:1, 200:1, or 400:1 ratios.
A typical ratio on a standard lot account is 100:1, and a mini lot account will often offer a 200:1 ratio. If you start trading at 400:1, be wary of using small deposits to control large capital, as these can disappear quickly with the volatility of large sums. Lower leverage keeps you safer from mistakes, while higher leverage could bring in higher rewards.
How Leverage Affects Your Trading ✅
As we’ve seen, leverage is a powerful tool that can help you win big in the forex market. You can use less capital to control greater positions, giving you flexibility and amplifying your profits. However, it can just as easily amplify your losses.
At very high levels, leverage starts to damage your odds of success. Transaction costs represent a higher percentage of your margin the greater your position is. This means that transaction costs already put you at a disadvantage with excessively high leverage.

Candlestick Rejection Strategy!
What it is?
Candlestick rejection strategy is a pure price action swing trading strategy. It makes use of the concept of price rejection or candlestick rejection patterns to invalidate counter-trend momentum for a trade continuation.
By applying such candlestick rejection strategy onto swing trading, it allows trades to capture spots at which market prices are at rest during retracements before rejoining back the existing dominant trend.
How to use?
Some trade recommendation for such candlestick rejection strategy is to use it as a candlestick rejection pattern on counter-trend moves. This means that we pick candlestick rejection pattern only for the sake of searching for breakout continuation with the dominant trend at counter trend waves.Entry can be made after the breakout occurs at the high or low of The Mother Bar and stop loss order can be placed at the opposing breakout side's high or low.
Further trade help can also be incorporated to help increase the trade's probability of success. For instance, it can be used together with other technical tools such as dynamic moving averages and Fibonacci retracement tool. Some may even want to consolidate other trading strategies to further increase trade’s probability of success.
Thank you for reading, we hope you enjoyed our educational effort!

The Truth About LeverageIntro
Trading with leverage simply means borrowing money to put on a trade. Leverage is one of the many tools available for traders who seek to generate higher gains on their capital. Brokers have strict rules that govern the use of leverage, but this article is not aimed at teaching you the complexities of borrowing from your broker. Instead, the aim herein is to teach aspiring traders when using leverage is appropriate.
The Dangers of Leverage
For traders who do not have excellent risk management, leverage is a highly dangerous tool that can lead to outsized losses. While brokers will only allow you to draw down a certain amount before you receive a margin call—a demand from the broker to add more capital or liquidate positions to increase free capital—such losses can still devastate most traders. Furthermore, many online influencers present unrealistic results by using extremely high amounts of leverage and then showcasing these results as easily obtainable for the average person, often without presenting the potential dangers of trying to mirror their exploits.
The Complexities of Leverage
The benefits of using leverage seem obvious. If you can borrow money for a trade you can potentially earn much higher percentages on your capital. If you have a $25,000 account and can borrow an additional $25,000 for a trade, you can conceivably earn twice as much profit on each trade.
But let’s pump the brakes for a second.
If a broker allows you to double (or more) your capital for a trade, does that mean it’s a good idea? After all, if you can double your gains, you can certainly double your losses. If a trader is using twice as much capital without thinking about how much they are risking the situation can get out of hand quickly.
If a trader seeks to risk $500 on a particular trade, but they don’t properly calculate their position size based on the total leveraged capital, the trader can lose $1,000 instead of $500 with the same stop loss location. To make matters worse, the $1,000 loss is a much bigger blow to their $25,000 trading account than to a $50,000 account. The trader’s account is now $24,000, meaning they will only have access to $48,000 for their next trade. If this same process occurs a few times in a row it becomes much harder to gain back the lost capital.
When To Use Leverage
Trading with huge amounts of leverage, say 50x or more, and attempting to hit home run trades will almost always result in a devastating loss for new and struggling traders. For the average technical retail trader, leverage should only be used in a particular circumstance, and when done correctly, it can certainly help the trader rapidly increase their capital.
When you have proper risk management and use a predefined risk on each trade, such as risking 2% of your account, leverage can play an important role. For instance, if your trading methodology places a stop loss in close proximity to your entry it’s very possible that your account capital cannot purchase enough shares to risk the desired amount.
To illustrate this concept, let’s look at a basic example:
Say you have a $25,000 trading account
You risk 2% of your account on each trade for a dollar risk of $500
You take a trade where the stop loss is $2 below your entry (Risk per share) and the stock is $195 per share
To risk the desired $500 you need to purchase 250 shares (Dollar risk / Risk per share)
BUT...
250 shares would cost you $48,750, an amount that clearly exceeds your account size!
This means you cannot afford to risk $500 on the trade. Without leverage you could only purchase a grand total of 128 shares. This is the only time it is appropriate to go all in on a trade—when you are able to go all in and still maintain a controlled risk parameter.
Unfortunately, when you can’t afford to risk your desired amount, your entire profit taking routine is thrown out of whack.
Let’s assume your profit taking regime states that you sell when you’ve gained twice your risk. Normally, you would sell the position when you are up $4 per share (twice the risk per share). Yet, because you could only afford to purchase 128 shares (not the required 250), a $4 gain per share will only produce a profit of $512—an amount that only gives you a 1:1 risk to reward ratio on this trade. In order to achieve your 2:1 risk to reward ratio you would have to gain $7.80 per share—nearly double the profit target. It’s by no means a guarantee that the trade will hit your increased profit target, and if you sell before this point you are altering your usual risk to reward scheme. Changing your profit taking regime or your risk to reward plan has a negative effect on your bottom line when looked at over a large sample size of trades.
Leverage solves this problem.
If you were able to use 2x leverage, you could suddenly afford the required 250 shares, and you could keep your usual profit taking routine intact. In short, leverage is a tool that allows you to maintain a consistent risk per trade even when your stop loss is so close to your entry that you cannot afford the required amount of shares.
Special Considerations
Keep in mind, leverage can still cause you to lose more than you are comfortable with when trading stocks. If you’re using twice the value of your account and you get caught in a gap down where price skips your stop loss location you can take an extra large loss. This is an important thing to consider, and is one reason some people only use leverage when they trade large ETFs such as QQQ, or when they trade a market that trades 23 hours per day, such as futures. These ETFs do not experience extra large gap downs because they are less volatile, and futures hardly have any gaps.
Gaps on big diversified ETFs are almost always easier to recover from than a huge gap down on some other stock. For example, say you’re in a 2x leveraged position attempting to risk 2% of your account, but you get caught in a gap down on QQQ when price opens 1% below your stop loss level. In this case, you would lose 4% of your account. While this is certainly not ideal, it is completely possible to recover from this larger than expected loss. If you get caught in a 20% gap down on NFLX or a 10% gap down on TSLA while using 2x leverage your account will be devastated. For this reason, we only consider using leverage on large diversified ETFs or futures, even when we are using the methods covered in this article.
In the data section below this post you can observe what a small amount of leverage (2x) can achieve. Without this small boost in capital, the gains are 69%, and while nothing to scoff at, the 2x leverage makes all the difference. These additional gains use the exact same risk parameter and we did not expose ourselves to any additional or undue risk.

Learn How to Trade | Why to Analyse Multiple Time Frames 📚
Hey traders,
In this educational video, we will discuss why Top-Down Analysis
is so important and how to apply it in practice.
The video includes important theory and real market examples.
❤️Please, support this video with like and comment!❤️

Trading Basics | How to Identify The Market Trend 📈📉
Hey traders,
In this article, we will discuss a proven price action based way to identify the market trend.
❗️And let me note, before we start, that no matter what strategy do you use in your trading, you should always know where the market is going and what is the current trend. Your judgement should be based on strict and objective rules that proved its accuracy.
There are a lot of ways to identify the market trend. One of the simplest and efficient ones is price action based method. This method relies on impulse legs.
The market never goes just straight up or down, the price action always has a zigzag shape with a set of impulses and retracements.
The impulse leg is a strong directional movement, while the retracement is the correctional movement within the boundaries of the impulse.
📈The market is trading in a bullish trend if 3 conditions are met:
1️⃣the price forms an initial bullish impulse,
2️⃣retraces, setting a higher low,
3️⃣then starts growing again and sets a new high with the second bullish impulse.
Once these 3 conditions are met, we consider the market to be bullish, and we expect a bullish continuation in such a manner.
📉The market is trading in a bearish trend if 3 following conditions are met:
1️⃣the price forms an initial bearish impulse,
2️⃣retraces, setting a lower high,
3️⃣then drops lower and sets a new low with the second bearish impulse.
Once these 3 conditions are met, we consider the market to be bearish, and we expect a bearish trend continuation.
➖The third state of the market is called consolidation. The market is trading in a consolidation if the conditions for bullish or bearish trend are not met. The price chaotically forms bullish and bearish impulses, usually trading within the range.
Knowing the current trend, one always knows whether a current trading position is trend-following or counter trend, or it is a sideways consolidation trade.
Learn these simple rules and try to identify the market trend with them.
❤️If you have any questions, please, ask me in the comment section.
Please, support my work with like, thank you!❤️

Trading Is A Game of NumbersIntro
Most retail traders fall into the category of technical traders—we use technical analysis to identify market patterns and hope to profit from the outcome. As a technical trader, most individuals over emphasize the importance of patterns, and this often results in an endless search for a strategy that has the highest possible win rate. While this seems like a common sense approach, there is no such thing as a trading methodology that always wins. Attempts to seek the “perfect” strategy causes most traders to overlook the true source of success.
The Game
The Cambridge English Dictionary defines a “numbers game” as:
“A situation in which the most important factor is how many of a particular thing there are”
In trading, the game is:
How many trades you win and lose
How much you gain when you win, and how much you sacrifice when you lose
Despite the elegant simplicity, new and struggling traders are not able to think this way.
Why do so many traders struggle with the concept of a numbers game? I believe it’s because traders view the market as a predictable and stable environment that should respond to various forms of analysis in a consistent way. Therefore, anytime the market does not behave the way a trader anticipates it should, the trader is forced to conclude they are doing something wrong. If the trader happens to put on three or four losers in a row, they will likely abandon their entire approach and start from scratch. Such behavior seems logical. After all, if a trader loses four times in a row there must be something wrong with their approach, right?
For those who are trading randomly with no real game plan, consecutive losses can certainly indicate a poor methodology. However, if the trader is using a full fledged out strategy that has produced historical gains on the ticker in question, it’s just as likely that they’ve been caught in the randomness and volatility of the market.
If the trader is using a controlled risk parameter, like risking 1% of their account on each trade, 4 consecutive losses is only a drawdown of 4%. With proper risk and profit management, it should only take 2 consecutive winners to pull back those losses. In fact, I have personally experienced 4 losses in a row, followed by 4 winners in a row using identical trading variables. Had I changed a single variable to hypothetically avoid 3 of the 4 losses, I would have also missed 3 of the winners.
Let’s illustrate this example with real numbers. My risk was a maximum of 2% of my trading account, but my strategy defines moments when to exit early to minimize losses. My first target was 1.5 times my risk, and my second target was a trailer so I could ride out potential winners to the maximum extent.
4 consecutive losses produced a drawdown of about 7%
4 consecutive winners produced a gain of 26%
Total gain of about 19%
If you go to the data window below this post, and click on the List of Trades tab, you can see for yourself how this looks. In addition, the performance summary tab shows you that my average losing trade was about $400, and my average winning trade was $957. Furthermore, the largest winning trade was over $2400 because I used a trailing stop loss. Had I stopped trading this strategy, or began altering my variables, I would not have experienced the winning trades.
While most people focus on avoiding losses, they fail to realize that hindcasting (using hindsight to adjust your strategy) can result in missing many winning trades as well. It’s a delicate balance between winners and losers. Remember, trading is a numbers game, and to win a game of numbers, you must think over a large sample size.

DESCENDING CHANNEL - Range Trading StrategyHello my Fellow TraderZ,
Today this is not any Trade idea but a TUTORIAL on how to Trade the RANGE or the CHANNEL.
This is simple, safe, profitable and straight forward Price Action strategy.
Here we are taking the chart of US Govt. Bond 10Y-yield. This is the perfect setup of DECENDING CHANNEL on MONTHLY chart. No time bound you can trade at any TIMEFRAMES, but Higher Time Frames are more reliable.
You see, to draw any Trendline we need minimum 2/3 touch points.
Whenever the price touches the Trendline, never open any Trade in RUSH, wait, see the kind of candles forming at Touch Points (at LOWER TL = BULLISH PA, at UPPER TL = BEARISH PA). PA = Price Action. This should be coupled with the VOLUME.
Notice the S/R areas, where price gives multiple hits before bounce or rejection. This will give you extra boost as these horizontal S/R are more reliable than Dynamic S/R. Also these areas could be your Pivots to make ENTRY(incase price doesn't hit the channel Trendlines) or TP Targets.
Look at the Percentage(%) wise gains simply following the channel(BUY THE LOW, SELL THE HIGH). Well I've just mentioned the BUYS, you can add the short positions also.
Until the price is in channel you can take Multiple Trades both LONGing and SHORTing the market, unless the channel Breaks. This is the beauty of Range Trading. Similarly you can trade ASCENDING CHANNEL/WEDGES as well.
NOTE : PRICE ACTION is majorly important in the Game of Trading.
If you like this content, kindly give a FOLLOW & BOOST to me. Also COMMENT to bring more such #educational contents.
Sorry if its a bit Lengthy post.
Happy Trading . CHEERS!!!

How To Trade the Trend with best EntryHey Traders here is a quick video that explains the best entry point when trading the trend.
Sometimes the market will give you early signals that the trend will continue. Knowing when to find these signals or reversals can really benefit us in our trading.
Enjoy!
Trade Well
Clifford

what is the difference between trend lines ?? as u can see here in ethusdt there are four trend lines ( three of it are main ) first of all what is trend line categories :-
1- major trend."primary trend"
2- secondary trend ." intermediate trend"
3- minor trend ." near term trend "
_ ( major trend ) dow theory classifies the major trend as being in affect for longer than ayear and it differs from market to another
as example in the commodity markets major trend is anything over six monthes .
_( secondary trend) dow defined this trend as three weeks to as many monthes and its the same for the futures market.
_(minor trend) this defined as anything less than two or three weeks.
*i hope its short and informative.

BB SR Pro Energy Basis line strategyOne safe and easy trading strategy you can use with our BB SR Pro indicator is to buy (🧐) or sell (😉) when price reverses from its Energy Basis line. The Energy Basis line will be painted either red or blue depending on its relation to the price.

Learn How to Trade Top-Down Analysis | Full Guide 📚
Learn how to trade multiple time frame analysis.
Includes important theory and real market examples.
Entry/stop/targets explained.
❤️If you have any questions, please, ask me in the comment section.
Please, support my work with like, thank you!❤️

Confirm Fundamental Analysis With The Olympus CloudWe used the unfortunate global environment to pinpoint natural gas as a trading opportunity in early 2022. We then used the Olympus Cloud to define entries and exits.
When we are trading on a longer term time frame, such as the daily, and we are confident our fundamental analysis is on point, we will risk up to 4 times more (5-8%) than we do in our high frequency trading (2%).
In these trades, we required the Olympus Cloud to indicate a higher swing low than the previous low combined with a confirmed bull cloud transition -- it's as simple as that. Our stop loss was under the cloud, and our targets were 2R, and 5R respectively.
As you can see in the data section below this post, our commodity account has grown by over 35% YTD, with 12% in additional gains currently open. The trade accuracy was 80% with an astonishing profit factor of over 9 -- meaning we gained 9 times our risk. Of course, if we had gone all in, these trades could have earned up to 80%, but had the trades not worked out we would have taken huge uncontrolled losses. When you are trading with proper risk management, you will not earn as much, but you will keep your profit margins in check and won't suffer massive losses that are hard to recover from if the trade does not go in your favor.

How We Made Over 35% YTD Using The Olympus CloudIn a year when the S&P 500 dropped as much as 25% and fear gripped the market, we have gained over 35% on our entire account by trading the NASDAQ.
We used the QQQ ETF, which tracks the NASDAQ, and the Olympus Cloud indicator on multiple time frames. Signals were derived from QQQ, and trades were taken on SQQQ. We used the daily time frame to determine when the longer term momentum turned bearish, and then used the 30m time frame to locate entries. We risked 2% of the total account on each trade.
When using a leveraged ETF we always recommend you do your analysis and charting on the underlying index. In this case the leveraged ETF and trading instrument was SQQQ, and the underlying index QQQ .
As you can see in the data section below this post, the Olympus Cloud shows 25% net profit, 68% trade accuracy, and a profit factor of 2.8. By using SQQQ as the trading instrument the real profit increased to over 35%.

Visual Signals Versus Data Driven ResultsMany traders fall into the habit of judging a trading system or methodology by observing visual signals. A visual signal can range from a bot or algorithm signals, moving average interactions, a stochastic cross, or a plethora of other common patterns.
Observation is the first step to finding a successful trading system but relying solely on visual cues will leave you open to selection bias. In other words, people tend to focus on the signals that worked and ignore the ones that didn’t. In addition to selection bias, if you make adjustments to an indicator or strategy based on visual cues without knowing the results in terms of accuracy and profit, you may suffer from what we call cascading changes, also known as unforeseen side effects.
Tuning For Results
The opposite of relying on visual cues is basing your decisions on the past results of a trading system. While past results do not guarantee future results, a pattern that has produced historical net profit is likely to work to some degree in the future.
Indicators and systems that are packaged with backtesting logic allow you to make adjustments to the system and then view how your changes affect real outcomes like net profit, trade accuracy, and profit factor. Making indicator changes based on results means you are using data in your favor.
Avoiding Selection Bias
The fix for selection bias is simple. If a pattern looks good to your eyes, backtest it and ensure you locate every last instance of the pattern, especially failed outcomes. It’s also important that you backtest over a long time period and do so on multiple different tickers. Some systems work well over a specific date range on a certain ticker but are much less successful on other securities or date ranges. Those who are unable to write automated backtesting scripts will have to rely on manual backtesting or find others who provide backtesting suites.
We highly recommend you avoid indicators and systems that do not include the ability to backtest and view past performance. It’s also best to remain skeptical when taking the word of many online influencers. Looking at a few signals that produced winning trades does not mean the system is capable of producing net profit over large sample sizes. In addition, only testing a system in a rampant bull market can be misleading. In other words, don’t fall victim to visual signals that don’t reveal results across time.
Avoiding Cascading Changes
When backtesting, sometimes tweaks you believe ought to improve your net profit do not produce the expected results. During extensive backtesting, many system changes we thought were improvements turned out to produce undesired outcomes. Not all changes improve your strategy even though the most recent visual signals appear better.
For example, by adjusting a strategy variable to avoid a few unwanted losses you may inadvertently miss a few trades that were big winners. The same variables that produced the unwanted losses were the same variables that produced the big winners. Some of the best trading systems follow the trend and a pattern similar to the Pareto principle, which means a small number of trades produce a large amount of the total gains. Missing the big winning trades has a significant negative impact on your net profit. You will never know in advance if the trade will become a big winner, and anyone who tells you they know is naive.
Trying to achieve perfect trade accuracy will cause you to miss many excellent opportunities. Adding more variables to a trading strategy means you are limiting the conditions that will activate a signal and increasing the likelihood your strategy will miss winning trades. A good strategy is strict, but simple, and does not attempt to achieve perfection.
Technical analysis does not predict the future, it simply provides us with an indication that one outcome is more likely. Changing trading variables without knowing the full extent of your changes over time is akin to fighting with a blindfold on.
Below you can observe the excellent gains produced by our Olympus Cloud backtest logic with only a 54% win rate.

The Truth About Trade AccuracyA critical component relating to trading success is the relationship between your win percentage and your bottom line. Many new traders hold some extremely inaccurate views when it comes to what kind of win percentage is required to generate net profit, including the notion they need a 70% or higher win percentage to achieve success. This notion is wrong and misleading. The relationship between your win percentage, your risk management, and the profit you generate from each trade are intricately related.
The beauty of this post is that the backtest logic in our Olympus Cloud indicator showcases the concepts covered with real trades, which is shown under this post in the data section.
The Positive Win Percentage
A win percentage over 50% is regarded as a probable edge or edge. Yet, even with a 60% win rate, you can generate a net loss. How? If your average loss is $100, but you are in the habit of falling prey to your emotions and prematurely selling your winners so you only generate an average of $50 when you win, you will lose money regardless of your 60% win rate.
No trader goes into a trade thinking, “Hey, I’ll lose $100 if I’m wrong and I’ll make $50 if I’m correct.” Nevertheless, random wins of $75, $25, $60, $40, $90, and $10 will average out to $50 per win. No one purposely tries to win half of what they lose, but random trading combined with random emotions produces random results.
We all desire winning and making good profits when we take a trade, but as emotions come into play, things quickly change. You may take a trade that reaches $75 in profit and then decide the move looks gassed out, so you sell. On another trade, you might get scared by some volatility, or notice a resistance you neglected to spot initially and sell for $25 of profit. It is all too common to fall prey to your emotions and behave in a way you didn’t plan to. The irony is, that you will regard the $25 trade as a winner, and it will raise your trade accuracy.
Let’s look at a simple example:
Example: 100 total trades with 60% trade accuracy
60 winning trades at an average of $50 per win = $3,000
40 losing trades at an average of $100 per loss = $4,000
Net loss of $1,000
In the example above, your break-even point is a 67% win percentage for a whopping $50 in profit. With this type of random risk and profit management, any meaningful net profit requires a win percentage upwards of 75-80%.
The psychological damage of having a higher average loss than an average win is hard to quantify, but it’s easy to feel frustration when one loss wipes out two wins. While this sounds like common sense, many, many new traders fall into the habit of random profit management and find themselves in this undesirable situation. The same theory holds true even if you let your winners play out, but you also let your losses escalate and take a few big hits to your account. In either scenario, your 60% win rate means nothing.
The Negative Win Percentage
In the case of a negative win percentage, you can produce a net profit even if you are correct less than 50% of the time. In this scenario, your advantage over the market is getting into trades that consistently provide large gains when you win, and by letting those winners play out fully. Furthermore, you can’t hesitate to cut your losses and keep your drawdown controlled. With this kind of win rate, you must not sell early or your entire business model falls apart. You must understand that the big winners will make up for any profit you leave on the table.
Let’s look at what happens if you are correct 40% of the time, but your average win is $100 and your average loss is $50:
Example: 100 total trades with 40% trade accuracy
40 winning trades at an average of $100 per win = $4,000
60 losing trades at an average of $50 per loss = $3,000
Net gain of $1,000
It is now clear that win percentage is not everything. You can make money even if you are correct on 40% of your trades as long as your average win is double your average loss. The smaller your average win compared to your average loss, the higher your accuracy must be to make a net profit.
Of course, if you can maintain a win percentage over 50% while also having proper risk and profit management you will end up far ahead.
Putting It Together
Clearly, the best approach is to combine a reasonable win percentage of over 50% with proper risk and profit management. You must consistently let your winners play out regardless of the emotions you feel in the moment and ensure you don’t take losses beyond a certain threshold. Furthermore, scaling out of trades – selling portions of your position as the market moves in your favor – will increase your accuracy and ease your mind. By dividing your position into two or three tranches you can lock in a certain amount of profit at predefined targets and then let the final portion ride out the trend with a trailing stop-loss.
Revisiting our example, let’s put these concepts together with a reasonable win percentage:
Example: 100 total trades with 55% trade accuracy
55 winning trades at an average of $100 per win = $5,500
45 losing trades at an average of $50 per loss = $2,250
Net gain of $3,250
Now, that’s what you want to see!
It’s more important you behave in a consistent manner and follow a predefined game plan than it is to have 80% trade accuracy. It is wise to strive for reasonable trade accuracy – 50% to 65% – and remain consistent in order to fulfill your trading potential.
After you have mastered your emotions with a consistent strategy, perhaps you can raise your win percentage to mythical values like 80%. As we have covered, though, such accuracy is not required for great trading results.

Trading Insights #3: Mastering Your Mind Debriefing
In the opening two parts of our Trading Insights Series we evaluated the importance of probability and random distribution, and then covered some key misconceptions relating to technical analysis and price movement. We recommend you start at part one and work your way up, but this entry can stand alone.
Intro
Your mind is the most powerful piece of the puzzle when it comes to your trading success. Without developing the mentality of a pro trader, you will never achieve the results you desire. When it comes to mastering your mind, we can think of no one better to draw influence from than Buddha. In this entry to the series, we intend to turn back the clock to see if we can glean some valuable insight and apply it to our trading endeavors.
Trading Pitfalls
There are several pitfalls most aspiring traders fall prey to when operating in the market. In our analysis, there are two categories of trading errors. We define these as conceptual errors and execution errors. While it’s tempting to focus on execution errors, we’ve found that addressing conceptual errors simultaneously fixes execution errors.
Conceptual errors stem from inappropriate ideas about trading. These errors are:
1. Not believing you need a defined strategy
2. Blaming the market for your failures rather than taking responsibility
3. Trying to get rich quick by trading in an aggressive and reckless fashion
4. Not viewing your trading exploits over a set of trades and over-emphasizing individual trades
Not believing you need a defined strategy
This is one of the most common and difficult to break trading habits. The market is a limitless environment where you can do whatever you want, whenever you want. Many traders enjoy this type of freedom and struggle to develop or follow trading rules. Some traders say they recognize the importance of a defined game plan, but when it comes down to it they don’t embody or act out a belief that rules are necessary.
By not having a gameplan, or not following your game plan, you will never allow yourself to find out what methods work best for you. When you factor in random variables based on your momentary perception you prevent yourself from learning what variables give you a real edge on the market over a set of trades. Many traders develop a plan, but when the moment comes they fail to execute their plan. This cycle tends to repeat itself over and over.
“An idea that is developed and put into action is more important than an idea that exists only as an idea.” —Buddha
It’s time to embrace action, not ideas. Create a plan and follow it for 20 to 30 trades. If the results are not what you hoped for, come up with a new plan, and try again. When you find something that works, stick with it until it doesn’t. In this way, you will learn, with a degree of certainty, what method produces the desired results.
Blaming the market for your failures rather than taking responsibility for your actions
Many traders fall into the habit of believing the market is responsible for their success or failure. The market is a dynamic sequence of events that has no feelings or emotions. It goes up, and it goes down. The market does not exist to make you a winner, just as it does not exist to make you a loser. If you depend on the market to make you a winner, the market can take your success away. If you trade like a gambler and the market gives you a series of winning trades, the market will eventually take the money back.
Once you realize it’s up to you to get what you want from the market you will embrace the appropriate amount of responsibility.
“It is better to conquer yourself than to win a thousand battles. Then the victory is yours. It cannot be taken from you, not by angels or by demons, heaven or hell.” —Buddha
When you take a huge loss, it’s not the market's fault — it’s yours. The contradictory component here is that if you find yourself in a huge winning trade it’s not necessarily because you’re a great trader. Anyone with any degree of skill can stumble into a big winning trade, even a complete amateur. Therefore, big losses beyond what you define as acceptable are your fault, but big winners beyond what you can imagine are not a product of your ability. Why? Because you could have prevented the loss by using a risk management plan, but for the winner, you just happened to enter at the right moment and there is no guarantee it will happen again.
Professionals don’t allow themselves to believe they are responsible for big winners — they understand it was just an occurrence of the behavior pattern that gives them an edge on the market and the next trade could very well be a controlled loss.
If you believe that a single huge winning trade is more important than a consistent mindset you are missing the big picture. When you master the appropriate mental techniques the market cannot take your success away. You will keep the gains you make and you’ll have the ability to keep winning in a consistent fashion. It’s time to take responsibility and conquer your mind.
Trying to get rich quick by trading in an aggressive and reckless fashion
Many people get into trading because it seems like the easiest way to make money. In addition, they think it’s their ticket to quick riches, almost like winning the lottery. Indeed, a select few individuals have been extremely lucky and have gotten rich on pure gambles in the market. Yet, if these people kept trading in the same reckless fashion they were not rich for long. There are many high-risk ways to trade the market and inexperienced people are drawn to these methods by the lure of some fast life-changing cash.
“Patience is key. Remember: A jug fills drop by drop.” —Buddha
There are 252 trading days in a year. If a day trader can consistently earn just 0.5% on their account per day, they can gain 125% in a year. Alternatively, if a swing trader can earn 1-2% per week, they can gain 50 to 100% on their capital in the same period. Any money manager would be ecstatic to produce such results.
If you cannot consistently earn 0.5% per day or 2% per week, what makes you think you can earn 100% in a month, and keep it? If getting rich trading the market was easy every retail trader who attempts to trade would be rich.
Not viewing your trading exploits over a set of trades and overemphasizing individual trades
Nearly every trader has the tendency to view each trade in a vacuum. In other words, each trade either proves or disproves the trader’s methodology or ability, and determines their emotional state. Any trade that does not meet the trader’s expectations causes frustration and mental distress. The problem is, that no trading system tells you what will happen on any given trade. A trading strategy only gives you an approximation of what you can expect over many trades. There is no other way a strategy can work. You must view each trade as a part of a set — this is what it truly means to think in probabilities.
“Nothing ever exists entirely alone; everything is in relation to everything else.” —Buddha
When you have a methodology that gives you a positive expectancy, you must learn that you will never know in advance which trade will work. Each trade has its own unique outcome but also exists as a part of many trades. When you have a system that tips the odds in your favor, you must view the big picture and not let losing trades affect your positive mindset.

Trading Insights #2: The Truth About Technical AnalysisDebriefing
In the first part of our Trading Insights Series, we went over the essential nature of probability and random distribution as it relates to trading. If you have not yet read part one, you should start there (Probability & Random Distribution.)
Intro
If you’re an aspiring trader, then you’re probably familiar enough with technical analysis to muster up a definition of some kind. Despite the widespread familiarity with the concept, technical analysis is often misrepresented.
This entry to the series does not focus on developing trading variables or strategies, rather, it emphasizes certain concepts relating to technical analysis. We believe the concepts herein are imperative to understand before you can successfully create or execute a trading system.
What Technical Analysis Is & Isn’t
Traders use technical analysis to gain an edge on the market or achieve a positive expectancy. In other words, technical analysis aids your ability to tip the odds in your favor. Yet, technical analysis does not tell you what the market is going to do next. Anyone who puts forward this idea is grossly misrepresenting an otherwise excellent analytical tool.
To know what the market is going to do next would require you to read the minds of the people who have the financial capability to significantly move prices. The people who can move the market in significant ways do not think like you or me and have their own goals and agendas that guide their actions. These individuals are often called “whales”, or “dynamic players”, and have substantial financial and mental capabilities that retail traders do not possess. Many of the reasons these individuals make trades would not even cross your mind, and they do things you would never consider as possibilities.
In addition to the direct actions of “whales”, the modern market is heavily influenced by automated bots and trading algorithms. These bots are able to act quicker than humans and are programmed to react to information that big players deem important. Despite the fact bots contribute heavily to price action, these bots are created and used by "whales" and "dynamic players". The code within these bots is complex and continually updated. The cascading effect of all the "whales" who trade, and the bots they create, is the real force that moves the market in meaningful ways.
Retail traders are extremely limited in their ability to move prices, and this ability decreases as the market cap of the company increases. For retail traders to have any large effect on prices requires an enormous flood of market orders that can take out all of the orders at higher or lower prices. Even when retail traders are able to affect prices, the impact is generally minimal.
It is estimated that retail traders in the USA account for approximately 10% of all trading volume on the Russell 3000 index, for a total of about 38 billion dollars per day. That’s no small amount, but still only accounts for 10% of all trading volume.
On a fairly normal day, to move TSLA from $944 to $998 required 22 million shares to trade hands. That’s a total of about 21 billion dollars. It would require over half of all retail traders that participate in the Russell 3000 put their entire buying power on TSLA, while also having the willingness to buy at the asking price, to achieve this feat. I think everyone can agree this situation is entirely unlikely.
When we consider the sheer amount of stocks available to trade and then divide that 38 billion dollars among all popular tickers, we quickly realize how limited retail traders are in their ability to significantly move prices. Every long trade you make is dependent on "whales" willing to buy at a higher price and move the market up. Obviously, in a short trade, it’s the reverse.
The Truth About Technical Analysis
The intent of technical analysis is to identify behavior patterns in the collective consciousness of the market. In other words, the interaction of all market participants produces patterns you can use in your favor. A pattern is simply a clue that one outcome is slightly more likely than another outcome. Conversely, as many will find surprising, a pattern can indicate that the preferred outcome is equal to or slightly less likely than the undesired outcome, but the positive results of the pattern outweigh the negative results by a fair margin. In other words, the dollar amount from the winning instances is significantly higher than the amount lost on losing trades.
Each instance of a pattern or technical signal is a unique occurrence, and the result of any pattern is unrelated to the previous instance of that pattern. The market does not move because of patterns, or due to signals from technical indicators. Patterns and indicators are, for the most part, not self-fulfilling prophecies. Patterns form because the people with the capability to significantly move prices (not you) leave traces of their behavior. A certain number of "whales" may use technical patterns in their bots and analysis, yet the way they use patterns and the reasons behind their actions are almost never transparent and certainly differ from the reasons you take a trade.
When you end up in a winning trade it is not because your strategy told you what was going to happen next, and it is most certainly not because a few lines crossed on a visual chart. These technical signals will draw in retail traders who try to make money without moving prices, but in order for the market to move substantially, far greater forces are required. Nearly every profitable trade you make is because "whales" entered the market with the conviction and resources to move prices in the direction of your trade.
In real terms, each behavior pattern has an unknown outcome and can result in an undesired result because the traders present at each instance of a pattern vary and may not be willing to act in the same way as they previously did.
Random Distribution & Technical Analysis
As we explored in part one, the outcome of flipping a coin is subject to numerous factors beyond our control, making each flip unrelated to the previous flip, even if we can rig the coin to favor a certain outcome. Market patterns work in the exact same way, with the caveat that behavior patterns are subject to even more forces beyond what we can control.
As already stated, "whales" and "dynamic players" have the ability to significantly move prices and have their own agendas and intentions. Even amongst these large traders, there are vastly different perspectives and goals. This creates a substantial number of unknown forces acting on each trade you make. If trading was as simple as analyzing economic information and putting on a trade, all economists would be incredibly wealthy, yet they are not. Trading is not black and white. You may make correct predictions from time to time, but it does not mean the reasons behind your predictions were correct.
While market patterns help tip the odds of earning money in your favor, they do not tell you what the market is going to do next. All of this adds up to the fact that, with any behavior pattern, the winning occurrences are randomly distributed through a set of occurrences.

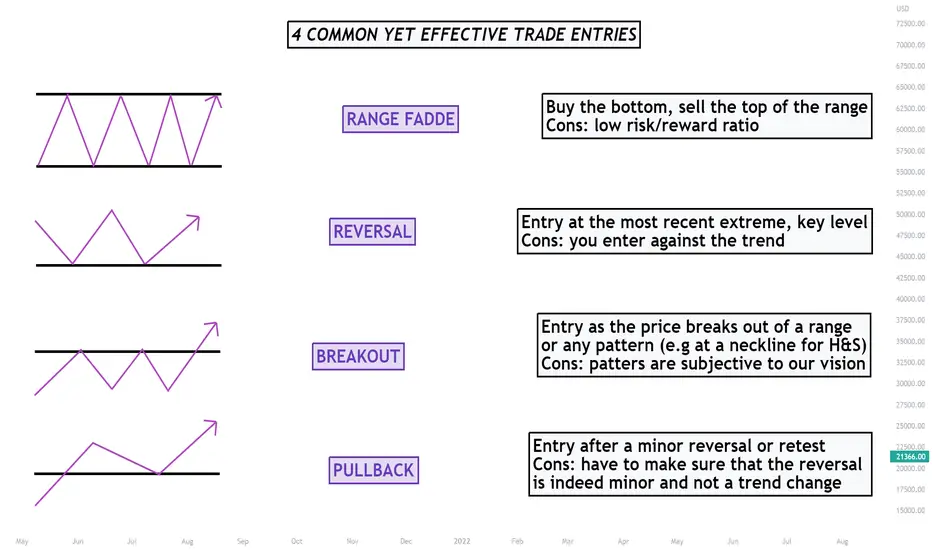
4 COMMON YET EFFECTIVE TRADE ENTRIESHappy Chewsday, traders! Some of you reached out and asked for more educational articles and we’re here to deliver. Relatively simple but important topic of entries is going to be lightly covered today. The image above should be pretty self-explanatory, but to cover it in more details: There are 4 main entry types.
- Range fadde is when we buy the bottoms and sell the tops of the range. Usually the box/rectangle isn’t large, so the risk-reward ratio is just not there for many traders. However, you can definitely put the stop loss a few pips out of the range and maximize the ratio.
- Reversal is an entry at the most recent extreme, key level. Quite popular approach, but personally, it usually goes against our fight club rule #1: “never fight the trend, he’s your friend”. We do; however, look out for multi-day/week key levels in our ideas as well.
- Breakout is an entry as the price breaks out of a range or any pattern. Very reliable option for beginners that are obsessed with finding repetitive reoccurrences in the market. For example, you can sell at the neckline of head and shoulders pattern and successfully profit from that. It is important to keep in mind that, the more complicated patterns you “notice”, the less people use them, thus, devaluing the importance of it.
- Pullback is an entry after a minor reversal or retest. Statistically speaking, this is one of the most frequent entries utilized by us. It’s simple and you still follow the trend. Draw your key points, look for proper Fibonacci levels and make sure it’s not a complete trend reversal. Of course, you’ll miss out on a few pips this way, but this might change your long-term profit statement.
What’s your favorite entry type?
LEARN HARMONIC PATTERNS TRADING | ABCD PATTERN 🔰
Hey traders,
Harmonic ABCD pattern is a classic reversal pattern.
This pattern is composed of 3 main elements (based on wicks of the candles):
1️⃣ AB leg
2️⃣ BC leg
3️⃣ CD leg
The pattern is considered to be bullish if AB leg is bearish.
The pattern is considered to be bearish if AB leg is bullish.
AB leg must be a strong movement without corrections within.
A is its initial point and B is its completion point.
BC leg is a correctional movement from B point after a completion of AB leg. The price may fluctuate within that.
B is its initial point and C is its completion point.
CD leg must be a strong movement without corrections within.
C is its initial point and D is its completion point.
❗️ABCD movement is harmonic if the length and the time horizon of AB and CD legs are equal.
By the length, I mean a price change from A to B point and from C to D point.
By the time, I mean a time ranges of AB leg and CD leg.
If the time and length of AB and CD legs are equal, the pattern is considered to be harmonic, and a reversal will be expected from D point at least to B point.
🛑If the pattern is bullish, stop loss must be placed below D point.
🛑If the pattern is bearish, stop loss is placed above D point.
Initial target level is B point.
Usually, after reaching a B point the market returns to a global trend.
What pattern do you want to learn in the next post?
❤️If you have any questions, please, ask me in the comment section.
Please, support my work with like, thank you!❤️

The Inside Bar ConceptThe Inside Bar is a lovely pattern that shows consolidation in a valuable way. As you can see the candle parent candle creates the high and low that will low key to know the consolidation is over. Price staying inside this area tells you so many things !
1. The Market volume is low in terms of trades being executed on the instrument.
2. Where price is at fair value
3. When price action is ready to leave fair value.
Take a look at your chart and back test this. You will be amazed !

Monero : Every detail about latest hardfork + Technical AnalysisHi friends.
hope you are good.
today i want to tell you some details about August 14 Monero Hardfork.
after that we take a look at XMR chart and analyze that in price action.
Lets Do Them:
This fork happened at block 2,688,888, this Sunday (14 August).
It brought several fixes to the internal multi-signature mechanism to facilitate the exchange of information.
Such as key sets and data synchronization between wallets, as explained on their website:
“Multisig means that a transaction needs multiple signatures before it can be submitted to the Monero network and executed.
Instead of one Monero wallet creating, signing, and submitting transactions all on its own,
you will have a whole group of wallets and collaboration between them to transact.”
The network upgrade also included changes to its ‘Bulletproofs’ algorithm to boost transaction speeds
and reduce transaction sizes by an estimated 5-7%, as well as improvements to its multisig mechanism.
At the end lets see some after effects:
1-Monero’s block size increases.
2-XMR’s market capitalization rose
3-According to Lunarcrush.com , Both social mentions and engagement saw 121% and 180% hikes.
4-Whales began to showcase interest to XMR.
Hope you enjoy this article.
now lets see Technical analyze of XMR on marketcap:
please share me your opinion about this post in comments.
we will grow togheter...

Learn How to Spot & Trade Consolidation | Full Guide 📚
Learn how to identify consolidation.
Price action based rules.
Directional bias & trading strategy explained.
3 states of the market explained.
❤️Please, support this video with like and comment!❤️
