Bonds Test Higher LevelsZN is testing highs at 131'12. We have tested this level twice but are facing some resistance as confirmed by two red triangles on the KRI. The next level above is 131'20, and this will be the next target if we can break 131'12. The Kovach OBV is progressively getting stronger, but has currently leveled off. Bonds will likely range a bit until we see more momentum come through. We will have support from below from 131'02, then 130'26.
Treasury

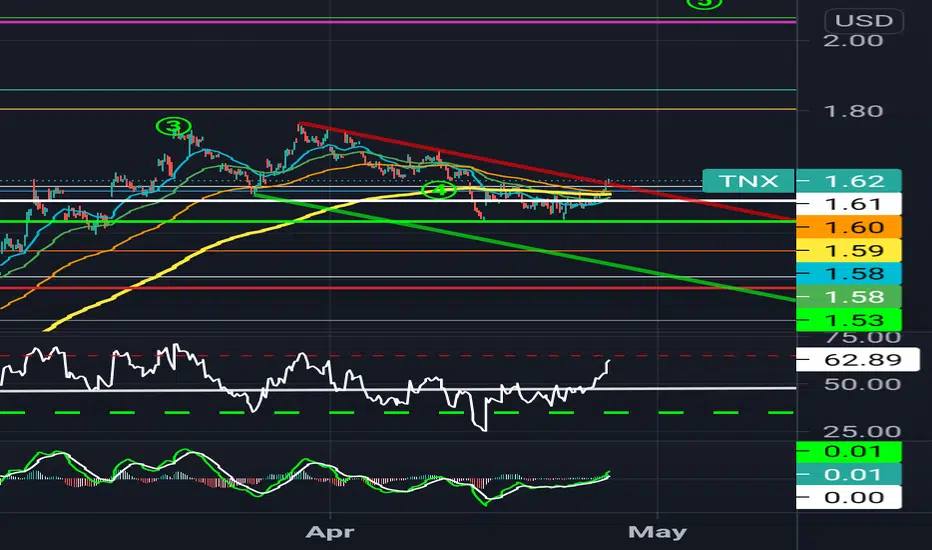
TYXLooks like we are at a resistance level. I want to see if price will retrace the previous low on the daily fib anywhere between 38% - 61% before any bullish run.

Change Your Mindset to Profit from the Upcoming Market DipAt this stage of the game, there are genuinely too many things to list that would back up the idea of an impending drop in the market.
Instead of eating, sleeping breathing FUD and living in the fear based, scarcity mindset and focusing on how “the market is going to crash” I encourage everyone to see the clearance buffet we are about to have in front of us.
We are about to have an opportunity for generational wealth transfer style profit making. Many missed the ultimate BTFD moment (COVID) but I believe we’re in for a mini round 2. The bigger the dip, the bigger the rip and I’m being a bit facetious here but I mean it.
If you’re gonna rob a bank, are you gonna plan how to do it ahead of time, or just walk in? You know the phrase get away with murder? Well, the people who get away with it are the people who plan it and not the ones who do it impulsively in the moment!
So get ready for the murder of the market that brings a traditional Christmas pump. If you're uncomfortable trading chop, spend this time:
1. Charting High Time Frame on Fundamentally Sound Tickers
2. Setting Alerts at Buy Zones
3. Waiting
Spend this time making all of the money you can OUTSIDE of the market so when opportunity presents itself (massive fear and a drop) to be bought you have the opportunity to do so.

Bonds are Ground Zero for Market's Battle with Fed and TreasuryThe bond market is the primary capital-raising marketplace. Market participants issue new debt or buy and sell debt securities in the secondary market. Bonds, notes, and bills are tools for public and private expenditures. Since the US is the world’s leading economy, the market for US government bonds is massive. The long-bond or 30-Year Treasury is a barometer for US interest rates.
The long bond has been trending lower since August 2020- The latest CPI data confirms the trend
Last August, the Fed made a subtle but significant shift
Monetary and fiscal policy remains accommodative
Conflicting signals for the bond market cause a bounce
Jackson hole could bring another shift
While the US central bank, the Federal Reserve, sets short-term interest rates via the Fed Funds rate, buyers and sellers establish rates further out along the yield curve. Following the 2008 global financial crisis and the 2020 worldwide pandemic, the Fed initiated a quantitative easing or QE program. QE is a tool to stimulate the economy via debt purchases that put a cap on rates further out along the yield curve.
Over the past year, the central bank has purchased $120 billion in government debt securities each month. The bond market has been dropping over the past year, despite the Fed purchases. Imagine where the long bond futures would be if the Fed were not buying each month. The bond market is taking on the Fed as it signals inflationary pressures are rising. The Fed may call inflation “transitory,” but this week, the latest consumer price index data from May was a warning sign that the bond market is correct, and the Fed is wrong.
The long bond has been trending lower since August 2020- The latest CPI data confirms the trend
The US 30-Year Treasury bond futures recently rolled from the June to the September contract.
The weekly chart of the long bond futures highlights the drop from 183-06 during the week of August 3, 2020, to the low of 153-29 in late March, early April 2021. While the nearby contract recovered over April, May, and early June, at the 161 level, it remains a lot closer to the low than last August’s peak level.
Bonds seem to have found a floor at just below the 154 level. Weekly price momentum and relative strength indicators have been trending higher since reaching oversold conditions in late March. Open interest, the total number of open long and short positions in the long-bond futures, moved from 1.106 million contracts when the bonds last August to the 1.207 level at the end of last week. Increasing open interest when the price declines is typically a technical validation of a bearish trend in a futures market. Weekly historical volatility at the 4.37% level as of June 11 was close to the lowest level in years.
While the long bond recovered from the lows, last week’s CPI data was bearish for the debt market. The 5% increase and 3.8% rise in core inflation was the highest level in nearly three decades. The Fed continues to call inflationary pressures “transitory” and has concentrated on its “fell employment mandate.” The trend in the bond market, raw material prices, the stock market, real estate, and most other asset classes points to rising inflation. Employment data could be the transitory outlier as low-wage earners continue to benefit from government stimulus and expanded benefits, which results in higher earnings from staying at home rather than returning to work. The latest CPI data confirms rising inflationary pressures.
Last August, the Fed made a subtle but significant shift
Last August, the US central bank told markets it adjusted its 2% inflation target to an average of 2%. The Fed has been encouraging inflation with low interest rates and quantitative easing. It is unclear what period the Fed is calculating the average rate, which makes a substantial difference. Inflation had been well below the target rate for years before it began to rise in recent months.
Economics is a social science. The models and formulas that the Fed watches and depends on are only as good as the variables, which are the inputs for the decision-making process. Individuals and companies are experiencing dramatic price increases and asset inflation. The Fed is taking a wait-and-see approach as it continues on the current course. The central bank was hoping inflation would rise last August. As the old saying goes, be careful what you wish for, lest it comes true.
Monetary and fiscal policy remains accommodative
The tidal wave of central bank liquidity created by low short-term interest rates is unprecedented. Quantitative easing to the tune of $120 billion per month in debt security purchases is an attempt to keep interest rates further out along the yield curve at low levels to stimulate borrowing and spending and inhibit saving. With the long-bond futures slipping from over 180 to the 161 level at the end of last week, QE may have only softened the inflationary blow over the past months. The Fed has a partner in crime, the US Treasury, and the Washington establishment.
If central bank liquidity is at an all-time high, fiscal stimulus is off the hook. Stimulus in the trillions has only exacerbated rising inflation. The price tag for the monetary and fiscal accommodation since the pandemic began is growing by leaps and bounds as it eats away at money’s purchasing power, the classic definition of inflation.
COVID-19 may be fading into the rearview mirror, but its legacy will remain an inflationary danger for many years to come.
Conflicting signals for the bond market cause a bounce
The Fed will meet this week for its June FOMC meeting. So far, the only thing the central bank has said is that it is “not thinking about thinking about” tapering the QE program or increasing the Fed Funds rate to address rising inflationary pressures.
The unemployment rate at 5.8% and core inflation at the highest level in decades are conflicting data for the central bank. Meanwhile, the administration and Congress keep spending with some politicians demanding even more stimulus and programs.
The bond market found a bottom in late March and has been recovering.
The pattern in the September long-bond futures contract illustrates a series of higher lows and higher highs since it traded at 152-16 on March 18, 2021. The latest high came last week at 159-29.
The bond market did not sell off after the latest CPI data, but it did rally on the weak employment numbers.
The bond market may have gotten ahead of itself in March when it fell to the lows. Speculative shorts pushing the long bond futures lower appear to have run out of patience and covered risk positions. However, if the Fed remains on its same accommodative path with help from the government’s tsunami of fiscal stimulus, the rally in bonds is likely to run out of steam sooner rather than later.
Jackson hole could bring another shift
The Fed Governors, economists, and others gather in Jackson Hole, Wyoming, each August. Over the past years, policy shifts have often created fanfare during the event. We could see the Fed begin to guide that QE tapering is on the horizon later this year or early 2022. Economic conditions and rising asset inflation make a shift towards tightening monetary policy logical as vaccines have created herd immunity to the virus, and conditions have not only improved but are robust.
However, if the central bank decides that it needs to keep the accommodative policy in place because of the unemployment rate, it will only pour more fuel on an already burning inflationary fire.
Expect lots of volatility in the bond market over the coming weeks and months. Increased price variance creates a nightmare for passive investors, but it is a paradise for nimble traders with their fingers on the pulse of moving markets. The bond market could be the Garden of Eden for traders over the second half of 2021 and beyond. The bond market is ground zero for the free market’s battle with the Fed and Treasury. Since August 2020, the bond market has been fighting the Fed and winning.
Sign up for the free Monday Night Strategy Call using the link below!
Trading advice given in this communication, if any, is based on information taken from trades and statistical services and other sources that we believe are reliable. The author does not guarantee that such information is accurate or complete and it should not be relied upon as such. Trading advice reflects the author’s good faith judgment at a specific time and is subject to change without notice. There is no guarantee that the advice the author provides will result in profitable trades. There is risk of loss in all futures and options trading. Any investment involves substantial risks, including, but not limited to, pricing volatility, inadequate liquidity, and the potential complete loss of principal. This article does not in any way constitute an offer or solicitation of an offer to buy or sell any investment, security, or commodity discussed herein, or any security in any jurisdiction in which such an offer would be unlawful under the securities laws of such jurisdiction.

The Dollar INFLATION Is HERE? Let's Find Out!
Hello,Traders!
The fears of inflation are now the reality, with the official FED number showing that inflation went from 1.6% in 2020 to 4.2% in April 2021, which means that the situation "on the ground" is even worse. Even just by looking at the charts of lumber, copper, and other commodities, while finding out that all the cars in your local dealership are sold out a year ahead, and the car prices are up, with the FED and the Treasury competing for the number of zeros on their official operating papers, the thoughts of «shortages» and «inflation» are naturally creeping into your head,followed by the question of "how it all came to it?" And while the Covid-19 and the lockdowns are the obvious culprits, the details are interesting. So let's dive into the mess of the Covid-19 consequences to find out.
Generally, Inflation can be caused by any of the two components: excess money supply, directed towards consumption, as opposed to investments, or goods supply shortage, with the unchanged money supply.
In 2021 we seem to have both, but the details are quite peculiar.
Let's deal with the excess money supply bit first, as it is kinda obvious: In march of 2020, the FED added 2.3 Trillion dollars to the direct asset purchases program, while expanding indirect liquidity by relaxing bank reserves standards, and relieving other regulations of the money markets to facilitate lending and prevent broad money contraction. Most of that money, however, went into the financial assets, inflating the asset prices, which can be seen by looking at the prices of Gold, Bitcoin, S&P500, and other key benchmarks.
U.S. Fiscal Policy bit, however,was more directly relevant to the consumer goods inflation.
Throughout March and April 2020, the U.S. government passed three main relief packages and one supplemental package, totaling nearly $2.8 trillion. After the passage of the supplementary package in April, nicknamed "stimulus phase 3.5," there was no substantial action on COVID-19 stimulus or relief from Congress for several months as each party proposed their own stimulus package.
Then, after the election of President Biden in November, a $900 billion stimulus bill was passed in December 2020. Another $1.9 trillion American Rescue Plan, was signed into law by President Biden on March 11, 2021.
3 Trillion Dollars was actually spent so far, the remainder being available to congress for allocation.
Most of that money was spent, not invested, and came from borrowing, not taxes, which, would have added to inflation even without the supply shock.
The supply side of the equation, however, looks much more complicated, but we will dive into that in the next article, tomorrow!
If you want to read the most interesting piece, please like comment, and subscribe!

Hyper INFLATION (scarcity) & Bubbles - Bear Attack - Nasdaq 100 The printing clown show continues. On lookout for Hyper Inflation in scarcity plays (profit generators today not 10 years from now sillies). Those overvalued hyped names of the past decade will come down hard (no profits in sight for next decade). #investingainteasy #epiceconomics

US10Y and Bitcoin - correlated assetsWatch the key treasury yield events on Wednesday and Thursday, might cause macro movements for Bitcoin price.

Interest Rates Topping?/TLT Finally Making a Bottom?/Looks like the craze over high interest rates is coming to a congestion zone. If you go back to 2019, there were hella buyers at $135. I think we are getting to the point where such high interest rates, while the stock market is still skyrocketing, and yet the global economy has not recovered; or said better, investors are in denial.
When interest rates are low, and the stock market is high - that's inflationary. When interest rates are high, and the stock market is high (making ATHs), and yet we are in the eye of a deleveraging, currency crisis - I can't help but anticipate a top on both rates and the stock market. At some point, the Fed will have to get people to buy bonds, or they'll do it themselves, to push down the long-end, and I think the stock market will get cold feet, and start selling off.
That being said, there could be something more nefarious happening that we just aren't taking into account, which is the Fed just continuing the "we need to push inflation up" narrative until they are blue in the face (idk how they aren't already), and people continue to take on debt and play the euphoric stock market game until financials finally bite people in the ass. The fed knows interest rates going higher, in a crisis like this, is a ticking time bomb, and at some point, will have to give in, but that's the point - they're going to let the system panic and then they'll come in, once again, and lend a hand.
What worries me, though, is why would anyone give a shit what they have to say at that point? No one can get loans when banks don't want to lend - e.g. people are in forebearance, people's businesses are closing or on the brink, people are malignantly unemployed in higher and higher numbers - fred.stlouisfed.org We're getting to the point where the risky money has to go somewhere, and it's either bonds, savings accounts, consumer debt, or stocks, and the fed will make damn sure that it's stocks or consumer debt. But what happens when people are exhausted and don't want to take on debt - or quite frankly just can't? Or when the stock market isn't going any higher and the support zones for every major index is thousands of points down? The money goes into savings, banks go insolvent due to lesser and lesser risk-on sentiment, and they dive into treasurys to find a safe haven for liquidity, and boom - you've got negative interest rates.
I'm fairly certain this will be the case this year, and the Fed will, again, be forced to ramp up the emergency SPVs like we've never seen before, and virtually breaking every rule in the book so that banks stay solvent, and people continue to take on loans.

Is this it for DXY bull run?There are several fundamental views towards our 3 week DXY surge and its future. Here are my personal views that I deem logical regardless of the play out.
I have mentioned recently that these economic relief packages are a form of inflation hence why we see the likes of gold and cryptos surging during times of stimulus relief. While Gold is set for another week of gains we can look to for further DXY retreat. Although trillions of dollars are being sent out , on a grand level this money will be put right back into the economy through the likes of spending for leisure, bill pay, debt pay, investing, etc. As debt is paid off what do most people do? They either end right back in debt or establish positive capitol that naturally has a positive effect on the economy. Furthermore, the relief will have positive effect on other countries which historically lowers the dollar for sentiment purposes. We are seeing this all in play currently.
Its important to be able to correlate DXY fundamentals with chart patters. DXY is know to have major gaps. This current gap was in my opinion a final retest of the key resistance that bulls needed to breach for continuation fueled by Treasury yield manipulation. The trend exhausted well before 92.200. That being said to avoid a takeout 92.00 support must be breach with a close out to add sentiment to a sell off. Our MACD/SIGNAL lines are finding true indicator support as presented on chart while a MACD?SIGNAL line cross is in play. When this occurs the lines must cross the 0 line for indicator sentiment sell off.
Let me know what everyone thinks about DXY and compare your sentiment towards mine. There truly is little to go off from the web as there is clearly to much uncertainty from misleading articles. Let the community talk. Thank you!


ZB1! / TLT : US Treasury Bond Futures : HTF Bias (Option 1)US Treasury Bonds (ZB1! or TLT) are nearing some very sensitive + bullish zones on the weekly chart.
Here's one way this can play out in next few weeks!

LDLC bad net treasury, bid > ask, COVID, no money for ChristmasLDLC got a bad net treasury last year, they have more selling orders than buying orders, 2nd lockdown is rudely affecting France and people will have no money for Christmas to buy on LDLC.

What could go wrong with the yield curve ?New Fed policy will allow inflation to run above its 2% target. To achieve higher inflation the Fed is is expected to hold short-term rates very low for a long time.
A sudden steepening of the yield curve after an inversion almost always coincides with recession.
Aggressive expansion of the money supply through fiscal and Fed policy has led to concerns of rising inflation. The US government needs to fund relief packages and pump money into a weak economy. Excess supply of longer-dated Treasury supply hitting the market may put additional pressure on prices and keep long dated yields moving higher. Institutions may aim to unload expensive long-term Treasuries onto the market which could depress prices and increase yields.
Investors may soon demand higher yields on longer-term debt. But are we ready for higher back-end rates & a steeper curve?
The inflation break-even rate between 10 year Treasury Inflation Protected Securities (TIPS) and regular 10 year Treasuries hit 1.8% last month, the highest since February.

ZN1 10Y T NOTE FUTURES (30MIN)We have a good probability: the market will keep going up and to buy,
Stop loss : 139'10'5
Take profit: 139'16'5
If i find the time i will make another analysis just after achieving my Target

ZN1! 10Y T Note Futures ( 30Min)Probability: 65%
The market may keep going down.
im not familiar with indicators in this plateform, so follow the instructions below.
Yellow Line: ! You can use it = Take profit
if the candle cut the line with force then u can sell and wait until the next orange line and take profit.
if the candle cut the orange line, u can choose ur new TP.

10Y T NOTE FUTURES (3OMIN) BUY SIGNALProbability: 65%
the market will keep going up next hours
Green line: Take profit
If the candle cut the green line with force, u can consider the blue line as a TP => if not just take profit.
sorry im not familiar with indicators&symbol here( im new here)

10Year T-Note Update of previous Analysis $We booked some nice profit from the Buy Position and went out at Breakeven.
When price reversed, the Sell position is activated, and as you see we are in very deep profit right now.
Congratulations to everyone.

30 year Treasury Bond Yield trend change?This will be interesting to keep an eye on over the coming years.
If the ending triangle is a wave C diagonal, then it would signal the end of the down-trend in yields over the past 23+ years. Zero fundamental analysis was conducted, but it would seem there is upward pressure on yields at a time that 10 year T bonds is in a corrective phase - down 12+% from 2012 highs.
Each wave C of the first two ABC corrections extended ~1:1 but not less. The current ABC has extended slightly more than 0.786 and is displaying a tightening range.
If the triangle is a a wave 1 diagonal then this would strongly imply moderate to strong upward pressure on government bonds and a conservative estimate of 44+ is possible.
The most plausible bearish scenario would be a downward breakout to around the 1:1 extension of wave A down to the sub 17 range. That would place the triangle in the wave 4 position in wave C down.
The next couple of years will illuminate all. Another possibility is a meandering sideways correction instead of a definitive breakout. Yes I am covering my bases; it could go up, down, or sideways :) But I expect a trend change with some strength behind it.
I am not an investor in this market. But am sharing this for my own technical analysis education.

YIELD CURVE IS NOT WELL UNDERSTOOD!BOND MARKETS SAVANTS CLAIM THAT THE DEEPER THE YIELD-CURVE INVERSION, THE DEEPER THE RECESSION!
HOWEVER, VISIBLE INVERSIONS HAVE BEEN INCREASINGLY SHALLOW WHILE FOLLOWING RECESSIONS HAVE BEEN INCREASINGLY SEVERE, CULMINATING IN THE 2008 GLOBAL FINANCIAL CRISIS!
BY THIS LOGIC, WILL THIS RECESSION BE MORE SEVERE THAN 2008?

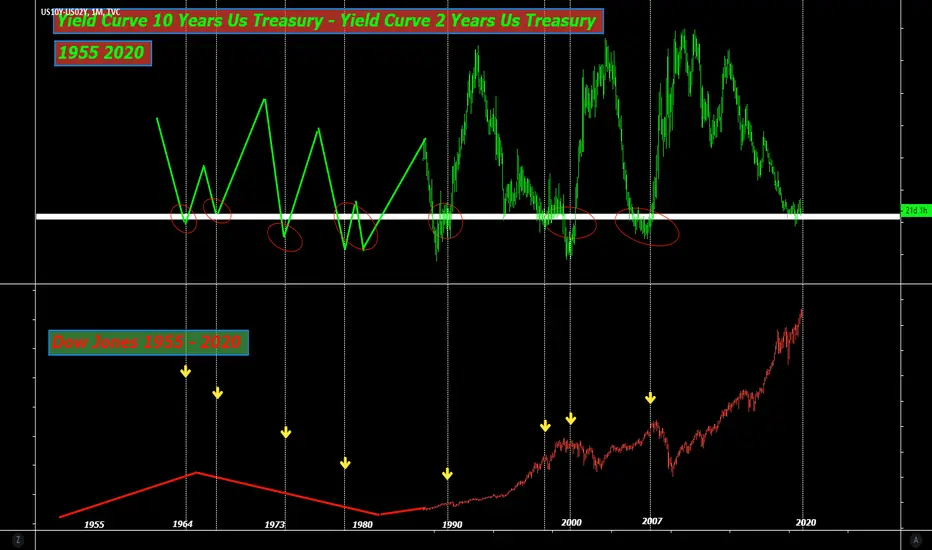
Leading Indicator for change trend Dynamic Yield Curve Dynamic Yield curve of interest rates Us treasury 10 Years - Yield curve of Us Treasury 2 Years , that's it a leading indicator for recession , anticipates change trend of Index Stocks Market
Ratio Rame - Oro & Tassi sui Treasuries Usa a 10 anni Il rapporto rame oro dimostra di avere delle proprieta' anticipatrici rispetto ai tassi sui titoli di stato Usa a 10 anni .

Analisi intermerket tra il ratio rame oro e oro Il ratio rame oro e' usato in vari ambiti sia per cogliere i massimi del gold sia per prevedere i tassi dei Treasury Usa a 10 anni
