Bullish RatesWatch Out if the the 10Y closes above 4.30.
I would start getting very bearish on equities if this happens.
Price action on yields here indicated higher long term rates.
It is currently setting up as if the tax protest will happen.
The wave count here is just a suggestion for this outcome. Long-term rates could spike one final time before the Fed panics. This also lines up with the 10Y minus 2Y yield curve uninverting. The uninversion has started, but typically it will shoot up before downturns and that would happen if this continues.
Yields

US 30-year yields hit post FOMC highUh-oh. This is not what you would have expected to see if the Fed was perceived to be more dovish than expected. Also 10y yields show similar price action. Suggests rates will remain high for longer. Possibly a bearish factor for tech stocks. Keep an eye on 30y yields to see if they will break the trend line. Could trigger a bit of vol into year end if it does.
By Fawad Razaqzada, market analyst with FOREX.com

US10Y This break-out can be the next Buy Signal.The U.S. Government Bonds 10YR Yield (US10Y) has been trading within a long-term Triangle pattern and more recently since May 22 2025 it has found itself declining inside a Channel Down.
This Bearish Leg (Channel Down) almost hit the bottom of the Triangle and has been rebounding in the past 10 days. As long as the 1W MA200 (orange trend-line) holds (right now almost at the bottom of the Triangle), the probabilities of a rebound and new Bullish Leg remain strong.
The confirmation for such Bullish Leg will come after the price closes a 1D candle above the 1D MA50 (blue trend-line). If it does, we an expect the price to rise to at least the 0.786 Fibonacci retracement level (Target 4.475%), which has happened all times (3) inside this Triangle after a Bearish Leg bottomed.
-------------------------------------------------------------------------------
** Please LIKE 👍, FOLLOW ✅, SHARE 🙌 and COMMENT ✍ if you enjoy this idea! Also share your ideas and charts in the comments section below! This is best way to keep it relevant, support us, keep the content here free and allow the idea to reach as many people as possible. **
-------------------------------------------------------------------------------
💸💸💸💸💸💸
👇 👇 👇 👇 👇 👇

Why Did The Market Bounce Today? Today the market bounced for 2 reasons....
1. Broadcom NASDAQ:AVGO received news of another OPENAI partnership. This multi year billion dollar deal caused the stock to bounce double digits. When this name rallies it causes liquidity to flow into the $SOXX. Semiconductors are still the heartbeat of this market and have propped everything up today.
The OPENAI headline seems to be running out of steam as the last 3 partnership announcements caused 3 stock to make new highs but AVGO did not take out its highs. This will be on watch.
2. The bond market was closed today allowing investors to not have to worry about catalysts or yields. There's an old saying on "when the cats away, the mice will play" .
The bond market is the much larger investment market aka the "cat" and this liquidity has clearly spilled over into smaller cap higher beta stocks.
Tomorrow we will see if the markets can take out the 20 day Moving average or if this pop gets sold into.

Oil/Bonds Just Flipped 5-year Support into ResistanceOil-to-bonds SR-flipped this 5-year support
US10Y not as neat and tidy, but close to the same and correlated

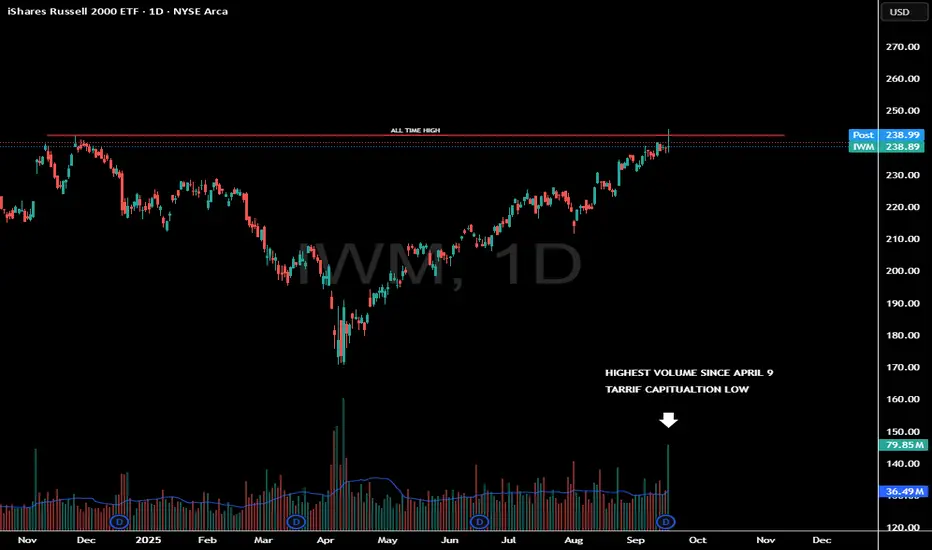
Highest Volume Candle Since Tarriff LowIWM saw a nasty reversal off the all time highs today.
A potential weekly topping tail is building.
What important about this reaction is the amount of volume that was traded.
This was the highest candle since April 9th.
High Volume reversals need to be monitored closely as it does show large money distributed into this strength.
A high volume candle marked the tariff bottom.
Will a high volume candle signal a near term top?
Blood in the streets...Is a Bear Market Starting? We discuss the technical obseravtion in the SPX / SPY.
Why was IWM so weak today?
What is happening with inflation & why are yields rallying?
Are tensions with Russia escalating?
Today we closed IWM 241 puts for 150% gain.
We took profits on many other short ideas & entered several new trades today.
Caution needs to be warranted since the Dollar and oil are rallying.

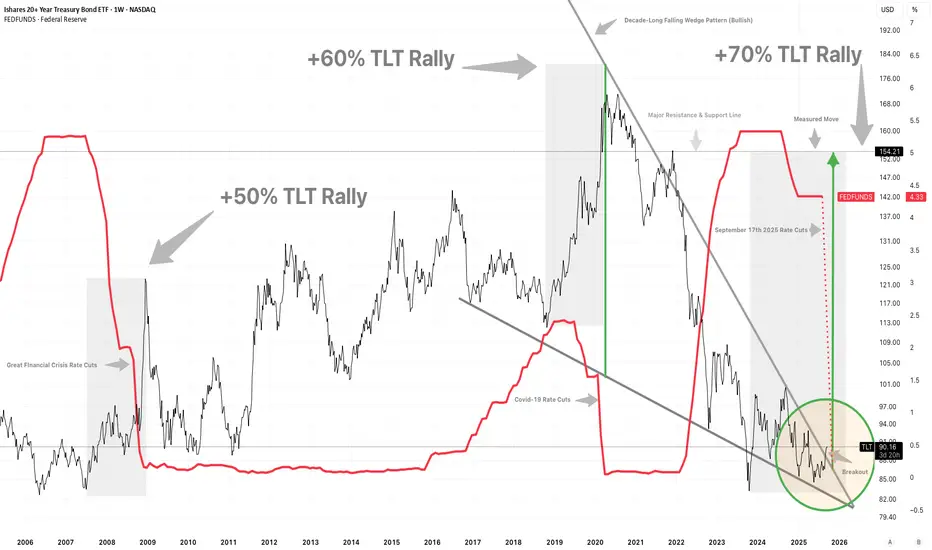
TLT TimeRate cuts start this Wednesday, September17th, 2025.
Polymarket odds are now strongly in favor of 3 rate cuts in 2025. CME Fedwatch probability is now at 70% for 3 cuts by December 10th.
Economic data, especially employment, has strongly confirmed the start of a full rate-cutting cycle beginning in 1.5 days.
Historically this set of circumstance has coincided with large or even historic bond rallies.
Will this time be different?
Is there a chance of a 50 basis point cut? SPX traded to new all time highs today.
Many stocks had blow off move or breakout candles.
Market makers cleared out lots of short interest today.
The employment data is starting to get worse.
A new 2 year high in initial jobless claims.
Markets rallied on dollar and yields weakness.
At some point the markets will price in a recession. Growth stocks need to be monitored closely.
We took profits on Tesla & Baidu today.

Economic Tipping Point...GFC 2.0? In this video we discuss;
Bond Market Signal using the 2 year yield.
Is the 2 year yield giving us a 2007 / 2008 signal?
We look at the correlation of the 2 year yield vs SPX
We analyze the forward expectation of interest rate projections.
Observe and dissect last weeks economic employment data.
There will be plenty of opportunities in this next phase of the market cycle.
I will be looking very forward to the plethora of trade alerts I will be issuing.

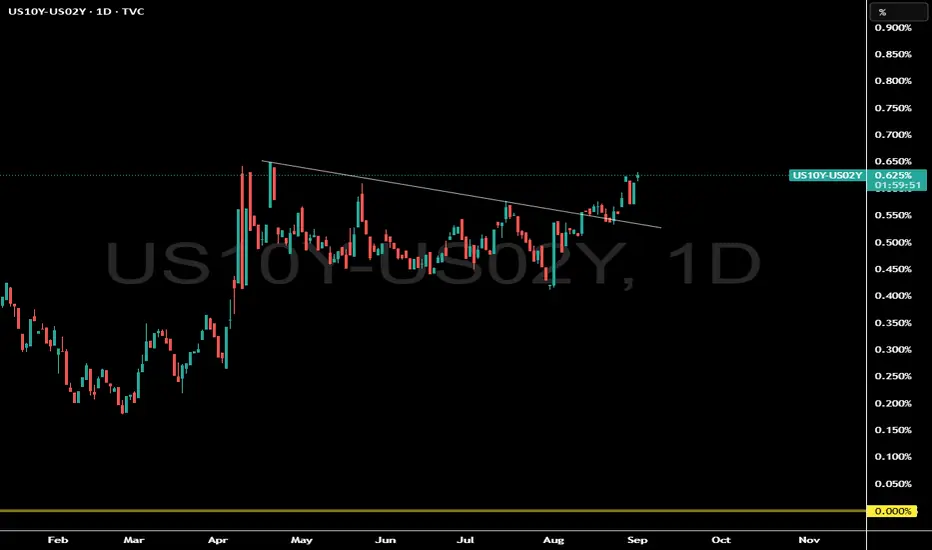
The Most Bullish Chart in the stock marketWhat does this 10 year yield and 2 year yield chart represent?
Is the bond market signaling a big economic event?
This bond market signal has a 100% success rate...but timing is the hard part since its a monthly long term signal.
Wait until we make a new pivot high in this chart...we should see some fireworks.
If you need to know what this means subscribe to our Youtube channel Where we often discuss macro economics and equites.
Gold Deep Dive: Cycles, Correlations, Divergences, SymmetryGold has been in a raging bull market and almost up over 100% since its monthly bullish engulfing candle.
Gold sniffing out week monetary policy and rallying on the back of easing global monetary policy.
Historically from a trading standpoint, Gold is extremely overbought and could be 4-8 weeks away from a considerable pullback of 15-30% .
Many Signals such as symmetrical moves, Monthly overbought RSI, Copper / Gold Divergence, GDX resistance is telling us to use caution and trim long profits.
It does seem like gold wants $3500 before it has a reversal back down. We are looking for a liquidity sweep of the ATH as a possible short zone. (Not FA advice)
Once gold resets some indicators and allows longer term moving average to catch up it will likely keep pushing but we only for see that in mid to late 2026.
If we make a new high....we don't see much upside for the next 3-6 months.

IWM Appears Due for a Minimum 40-60% Downside CorrectionOn the lower timeframes IWM has been treating $223 as short term support with much sold put leverage building at $220 and recently IWM has begun to retrace back down into those levels putting those sold puts at risk of expanding the volatility and of squeezing through these short puts as a result.
The short term the loss of this zone could likely squeeze down to $200.
However in the longer term we have been trading within this much larger parallel channel since the peak and bottom of 2008-2009 GFC and have started to form a potential peak paired with a Bearish Shark. I think that if we were to start to see some serious downside the IWM could trade back down to not just the bottom of the channel but down to one of the 3 major horizontal supports I have plotted on the cart down at $121, $85.74, or even $41.11 if things get real bad.
Personally I will be targeting one of the 2 upper horizontal supports in the longer dated positioning while targeting the $210-$200 levels in the short term.
I'd suspect this decline to come especially as Fed Rate cut expectations are completely priced out of the market, it is worth mentioning that fed funds futures around the start of the month dropped their expectations of rate cuts for the September meeting down to 0 and we may now be on the path to pricing in rate hikes as seen in the chart below.
Alternatively the expectations for rates going into the end of December has been on a fast trajectory of pricing out rate cuts as well, starting at 90BPS of rate cuts at the start of the year, now pricing in only 37.5BPS in rate cuts:
This ongoing shift in these fed futures spreads from positive to negative signifies the amount that Fed Funds Futures are expecting the Fed to hike rates with both the instance of rate hikes and rate cuts likely to cause a collapse in credit spreads as the bond market yield shift higher leaving the interest rate sensitive IWM to be one of the most negatively affected.

SPX trending....PPI comes in hot!PPI comes in super hot.
3.7% vs 2.9% exp YOY
0.9% vs 0.2% MOM exp
The SPX does gave higher upside targets but we are getting very stretched in the near term.
Liquidity has been flowing into crypto at full force and often moves of 125% in 2 months see profit taking.

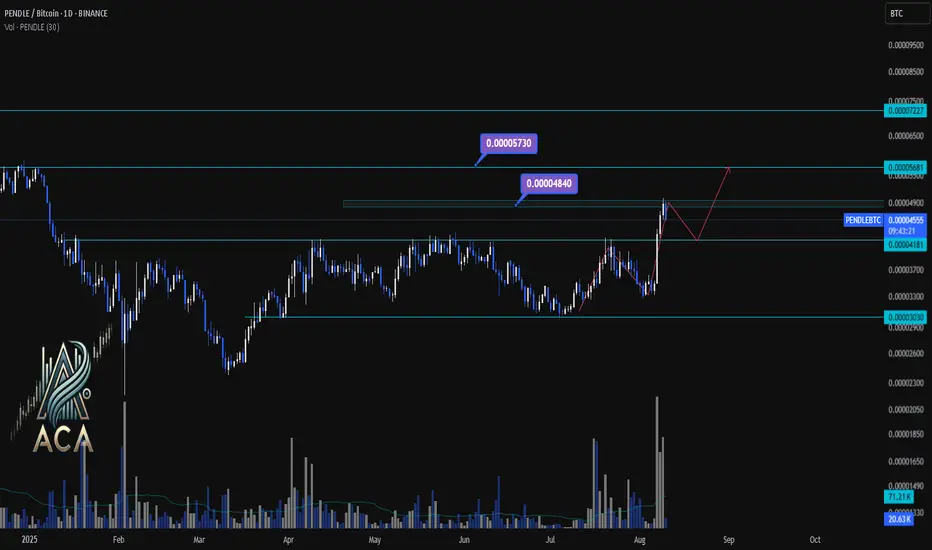
PENDLE/BTC Daily Chart Analysis | Momentum Building for the NextPENDLE/BTC Daily Chart Analysis | Momentum Building for the Next Move
🔍 Let’s dive into PENDLE/BTC and highlight the current technical landscape with key areas to watch for traders.
⏳ Daily Chart Overview
PENDLE/BTC recently broke above a multi-month resistance near 0.00004500, confirming strong bullish momentum on the daily timeframe. Volume surges are supporting this upward move, indicating increased market participation and renewed interest from buyers.
🔺 Bullish Scenario:
If the uptrend continues, look for a push toward the first target:
- 0.00004840 (major supply/target zone)
- On further strength, 0.00005730 is in sight as the next resistance.
Expect short-term consolidation or minor pullbacks before any strong breakout.
🔻 Bearish/Consolidation Scenario:
If sellers step in or the rally loses steam, support is found at:
- 0.00004181 (immediate level)
- If this breaks, look for deeper retracement toward 0.00003300 (structural support).
📊 Key Highlights:
- Daily breakout from a consolidation range signals bullish continuation potential.
- Volume spikes confirm genuine buyer interest at current levels.
- Major upside targets: 0.00004840 and 0.00005730.
- Critical downside supports: 0.00004181 and 0.00003300.
- Price action may oscillate (range/consolidate) between the support and resistance before a major move.
🚨 Conclusion:
Momentum favors bulls as long as price holds above 0.00004181. Watch for a confirmed breakout above 0.00004840 for additional upside. Stay nimble—volatility will likely provide both breakout and pullback opportunities.
Keep an eye on PENDLE/BTC and PENDLE/USDT📈📊
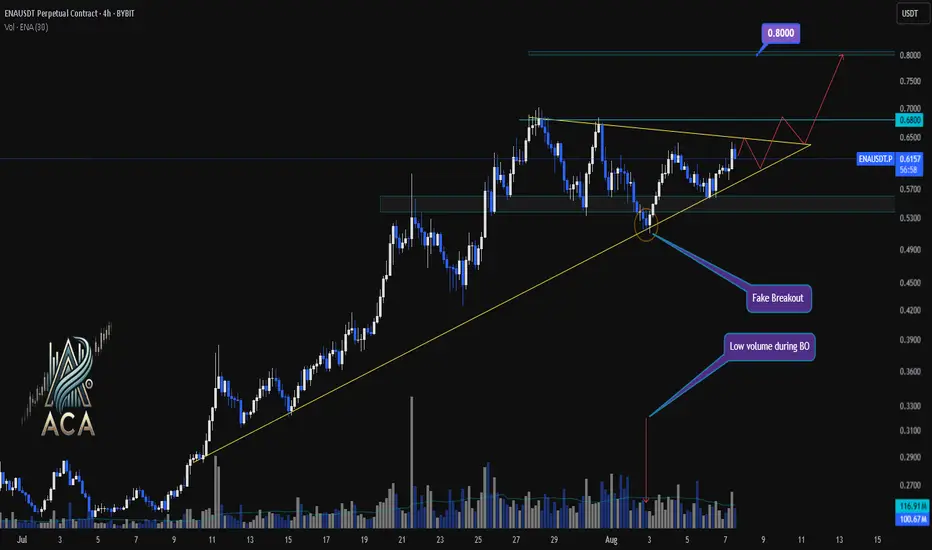
ENAUSDT 4H Chart Analysis | Bullish Breakout Setup in FocusENAUSDT 4H Chart Analysis | Bullish Breakout Setup in Focus
🔍 Let’s dive into the ENAUSDT perpetual contract and analyze the recent price action, spotlighting key technical signals and a potential breakout scenario.
⏳ 4-Hour Overview
The 4-hour chart shows ENAUSDT consolidating above a critical ascending trendline, with price action tightening into a symmetrical triangle formation. Multiple attempts to break down have resulted in a fake breakout, as indicated by low volume during the breakdown — a classic sign of seller exhaustion.
🔺 Bullish Breakout Setup:
On the upside, a confirmed breakout above the $0.6800 resistance could pave the way for a bullish continuation towards the $0.8000 target zone. The structure suggests increasing buying pressure as long as price holds above the trendline and key support ($0.6050).
📊 Key Highlights:
- Price retested the ascending trendline; buyers defended it aggressively.
- A fake breakout with low volume suggests trap for bears and quick recovery by bulls.
- The next major resistance comes at $0.6800, with a projected target at $0.8000 upon breakout.
- Short-term support sits at $0.6050. Price action above this level remains constructive.
🚨 Conclusion:
Watch for a decisive move beyond triangle resistance. A high-volume breakout above $0.6800 could trigger a sharp move toward $0.8000. Bulls are building momentum — keep an eye on volume to confirm breakout strength.
Bitcoin, SPX, Ethereum, Tesla: Whats Next? BTC appears to be showing distribution signs.
I do believe BTC local top is in, but alt coins like Ethereum can still push a bit higher.
Ethereum short around 3900-4000 looks promising
Tesla fell sharply on the back of cash flow burn and expenditures.
Investors are also fearful of sales decline and loss of EV credits.
SPX hit major long term resistance today. Coupling this with a depressed Vix we are likely setting up for a pullback in the market.
Small caps saw distribution today on the back of rising yields. A failed breakout observed on IWM chart.

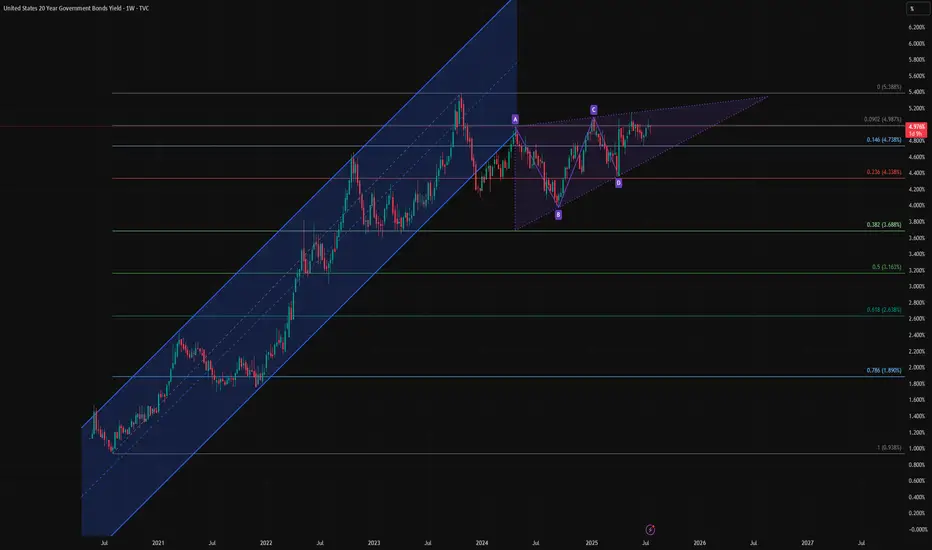
Bond Bulls Smell Blood: 20-Year Yields Likely to Fall🧩 Fundamental Bear Case for 20-Year Yields
1. Recession Risk and Slowing Growth
Leading economic indicators (e.g., ISM Manufacturing, Conference Board LEI) continue to suggest softening demand across key sectors.
A recession or significant slowdown would drive capital into long-duration Treasuries, causing yields to fall as bond prices rise.
Historically, 20-year yields fall 200–300bps from cycle peaks during recessions. With yields near 5%, there is ample downside room.
2. Federal Reserve Policy Pivot
The Fed’s hiking cycle appears to be at or near its terminal point. Rate cuts in 2025 are increasingly priced in, especially as inflation moderates.
If inflation continues to decelerate toward the Fed’s 2% target while growth slows, the Fed may be forced to ease sooner or more aggressively than expected.
Long-duration bonds, including the 20Y, are highly sensitive to forward rate expectations and would benefit from a dovish pivot.
3. Disinflationary Trends
Core inflation metrics (e.g., Core PCE, Core CPI) are in year-over-year decline.
Key disinflationary forces:
Wage pressures have eased as labor markets normalize.
Housing costs, which lag in CPI data, are projected to fall further.
Supply chain normalization continues post-COVID.
These factors reduce the need for elevated long-term yields, especially with inflation expectations anchored.
4. Supply-Demand Dynamics Favor Treasuries
Despite large Treasury issuance, global demand remains strong:
Foreign buyers (e.g., Japan, EU) seek higher yields as their home rates remain low or negative.
U.S. institutions (pensions, insurance funds) are rebalancing into risk-free long bonds amid equity volatility.
A risk-off rotation or broader de-leveraging cycle would only accelerate this demand.
🔍 Technical Summary
Rising wedge pattern is nearing a potential breakdown — a bearish structure signaling exhaustion.
Price is failing to reclaim the previous uptrend channel, now acting as resistance.
A completed harmonic AB=CD pattern near recent highs suggests a mean-reverting move could be imminent.
Closest technical targets include:
4.33% (23.6% Fib)
3.68% (38.2% Fib)
Possibly even 3.16% (50% retracement) over the next 6–12 months if macro weakness persists.
📌 Bottom Line
The combination of:
Cooling inflation
A Fed pivot on the horizon
Rising recession risk
And technical exhaustion signals
Supports a bearish outlook for 20-year yields, meaning bond prices (especially long-duration instruments like TMF or TLT) could appreciate meaningfully from here.
US10Y Big downside potentialThe U.S. Government Bonds 10YR Yield (US10Y) has been since last week on a 1D MA50 (blue trend-line) rebound, consistently rising since the April 04 Low (Support 1). The presence of the Lower Highs trend-line just above it, puts strong selling pressure long-term.
As a result, either now or upon a Lower Highs contact, we expect the US10Y to turn bearish and Target 3.860% (Support 1).
-------------------------------------------------------------------------------
** Please LIKE 👍, FOLLOW ✅, SHARE 🙌 and COMMENT ✍ if you enjoy this idea! Also share your ideas and charts in the comments section below! This is best way to keep it relevant, support us, keep the content here free and allow the idea to reach as many people as possible. **
-------------------------------------------------------------------------------
💸💸💸💸💸💸
👇 👇 👇 👇 👇 👇

SPY, SPX, IWM, Natural Gas, NVDA, XYZ, AI - Analysis- Markets sold off into the NVDA rally this morning.
- Small afternoon rally turned indices back green
- Major pre market high levels up ahead likely allow us to push higher in coming days.
- NVDA should retest its premarket high levels.
- Profits secured on AI calls!
- Structurally indices are still bullish and remain above key levels.
- Yields see nasty reversal lower and look to be going down.
- Natural Gas trying to lure investors with a bottoming tail - but i think its false hope.

The Ultra Idea : d-MR96nBa's Ultimate Market Journal🌌The Ultra Idea : d-MR96nBa's🌠Ultimate Market Journal🎨
Hello Fellow Travelers
It's been some time since I've posted a Fresh Idea, though I've remained actively trading.
What better way to mark my TradView return, than to start an Ultimate Market Journal.
Financial Markets have taken my deep interest again recently, especially as we seem to be at a time of accelerating change and shifting regimes.
I believe many opportunities abound to those with open, flexible and creative minds.
A bit more about myself.
I've been involved with financial markets in one form or fashion for 18 years now.
I started out like most of us, approaching the game with fundamental analysis, only to later incorporate and then fully graduate to T/A.
I'm a natural Contrarian.
My brand of technical analysis is as much about aesthetics, creative expression, discovering hidden truths and applying Universal Principles as it is running the numbers.
I'm starting this off with Ultra Bond Futures, as UB's are the trading instrument I've come to specialise in, having had the most ongoing consistent success trading.
This by no means is going to be a "I bought here and sold there" type of Journal, as that's not my style.
Nor am I going to focus on a single market instrument, observation or style of analysis.
I'd like this to become a repository of accumulated wisdom and unique market perceptives.
I've just begun contemplating what this may evolve into in time, and I invite you to join me in taking this Leap
d-MR96nBa🌌
Concept
Inversion📈📉
Seek out and analyse whatever moves exactly inverse to what you intend to trade.
If you're having trouble discerning trend or observing price patterns, check the inverse.
This can be an excellent technique for exposing Bias.
This can work particularly well for currency traders, though can be Universally applied.
For US Ultra Bonds, the inverse is the US 30 Year Yield
Ultra Bond Futures
US 30 Year Yield
Currency traders, say you're about to trade AUD/CHF
Check out the CHF/AUD chart first, if they both appear Bullish or Bearish, you've got a Bias.
AUD/CHF
CHF/AUD
GBP/JPY
JPY/GBP
EUR/USD
USD/EUR
Are there any examples of Inversion in Trading you'd like to share ?
What else is on my🧠
Well just casually, I believe we're currently witnessing Peak Bitcoin in it's entire Life-cycle.
Have we Bull Trapped & Breakaway Gapped on Berkshire Hathaway
BRK.B
It's in the Detail

Bond Yields moving soonSo, we redrew the trendlines a few days ago and this is where the 10Yr currently stands.
Bond Yields should give some sort of direction within the next handful of days. Be ready.
TVC:TNX
Interest Rates

HTZ short idea?NASDAQ:HTZ HTZ is underperformjng the market In a large way today.
With interest rates falling & the IWM rallying to the upside this is a bearish divergence occurring for this ticker.
If HTZ can't rally with the positive conditions it likely means this stock will continue to see some selling pressure.
Understand this is a high risk high flying stock that can have outsized moves.
