US 10‑Year Yield: Quiet… but waking up?The range may look dull, but there are signs of life. The 10‑year has broken above its short‑term downtrend from June, yet it’s still capped by the September high at 4.20% and the 200‑day MA around 4.23%.
Price has now pushed above the Ichimoku cloud, with the lagging line following — a subtle but meaningful shift ahead of NFP and rising geopolitical tensions.
On the weekly chart, strong support from the 2020 uptrend and the 200‑week MA at 3.96% keeps the structure intact. A break above 4.24% could open the path toward the long‑term channel top near 4.61%.
One to keep firmly on the radar.
Disclaimer:
The information posted on Trading View is for informative purposes and is not intended to constitute advice in any form, including but not limited to investment, accounting, tax, legal or regulatory advice. The information therefore has no regard to the specific investment objectives, financial situation or particular needs of any specific recipient. Opinions expressed are our current opinions as of the date appearing on Trading View only. All illustrations, forecasts or hypothetical data are for illustrative purposes only. The Society of Technical Analysts Ltd does not make representation that the information provided is appropriate for use in all jurisdictions or by all Investors or other potential Investors. Parties are therefore responsible for compliance with applicable local laws and regulations. The Society of Technical Analysts will not be held liable for any loss or damage resulting directly or indirectly from the use of any information on this site.
Government bonds

can the us10y double in 2026?gm,
this is a very contrarian idea.
---
imagine the weather app says calm skies.
yet outside, the trees are bending hard.
that’s what a us10y doubling from ~4% to ~8% during rate cuts would feel like.
---
if the us10y doubled from 4% to 8% while rates were being cut, it would mean the bond market has completely lost trust in the fed. policy says ease, markets say danger. when that gap opens, risk assets usually fall first.
---
lets talk structure for a moment, cause i don't really care about the reason why this happens.
---
structurally speaking, from the covid lows, the us10y put in a bullish nest, and ever since that bullish nest, it's been expanding upward. if my count here is correct, the us10y would be in a bullish 4th wave, a bull flag of sorts, preparing for 1 final leg up.
if that leg up does come, it won't be a grind, it'll be complete capitulation of a portion of the banking system. 8% is my target, but it could double that if shtf.
---
🎯 = 8%+

US 10Y TREASURY: Tests 4,20% ahead of jobs dataThe first trading session in 2026 reflected Fed policy uncertainty and thin volume on US Treasury markets. The 10Y Treasury yield held steady near 4,15% up to 4,20%as thin holiday trading left yields relatively flat. Investors are digesting fed policy expectations, including pricing in multiple potential rate cuts this year and watching upcoming economic data that could influence the path of interest rates. The market's focus remains on the Fed's outlook and labor data, with the 10Y yield lingering close to recent multi-week highs as traders balance inflation and growth signals.
For the moment the level of 4,20% remains the strong resistance level. In a week ahead US jobs data and Non-farm payrolls are scheduled to be posted, which might bring back some volatility. Whether the level of 4,20% will be finally broken to the upside, is to be seen, based on posted labor data and expectations of Fed's further rate cuts. In case that 4,20% withholds the pressure, a short term reversal might come, with the next support level around 4,10% and final at 4,0% within the higher time frame.

UNITED STATE 10 YEAR GOVERMENT BONDS YIELDContrary to common belief, the index shows strong potential for an upward move; therefore, under these conditions, all assets can be traded against the dollar.

Bullish RatesWatch Out if the the 10Y closes above 4.30.
I would start getting very bearish on equities if this happens.
Price action on yields here indicated higher long term rates.
It is currently setting up as if the tax protest will happen.
The wave count here is just a suggestion for this outcome. Long-term rates could spike one final time before the Fed panics. This also lines up with the 10Y minus 2Y yield curve uninverting. The uninversion has started, but typically it will shoot up before downturns and that would happen if this continues.

US 10 Y Treasury 2026 and Beyondmortgage rates for 2026 and beyond. just a prediction, could be wrong.


US10Y Expected rising yields can turn stocks bearish in 2026.The U.S. Government Bonds 10YR Yield (US10Y) has been consolidating since 2023 within a Triangle pattern, while the stock markets had one of their strongest Bull Cycles in recent history. Before than in 2022, the US10Y rose aggressively, while stocks took the opposite turn, having a Bear Cycle.
With the US10Y under a Higher Highs uptrend since 2017, while also turning its multi-decade Resistance of the 1M MA200 (orange trend-line) into Support, the long-term trend has long shifted to bullish. And as the market approaches the 1M MA50 (blue trend-line)for the first time since March 2022, it will be tested as the trend's Support.
As long as it holds, we expect the US10Y to start another yearly rally, potentially causing a new Bear Cycle on the stock markets.
---
** Please LIKE 👍, FOLLOW ✅, SHARE 🙌 and COMMENT ✍ if you enjoy this idea! Also share your ideas and charts in the comments section below! This is best way to keep it relevant, support us, keep the content here free and allow the idea to reach as many people as possible. **
---
💸💸💸💸💸💸
👇 👇 👇 👇 👇 👇

US10Y10Y Treasury Outlook – Structural Demand for Higher Yields (2026 Thesis)
This idea is based on a macro-structural view, not short-term noise.
My thesis is that 10-Year Treasury yields may trend higher into 2026, driven by sustained capital requirements tied to national-priority investments, not temporary inflation spikes.
The United States faces long-horizon funding needs in:
• Military modernization and defense technology
• AI infrastructure (chips, data centers, cyber systems)
• Electrical grid expansion, security, and redundancy
These are non-discretionary expenditures tied to national security and competitiveness. To fund them at scale, the US must continue attracting global capital, which historically requires competitive long-term yields.
From a market perspective:
• Higher 10Y yields reprice risk assets
• Favor capital-disciplined and cash-flow-strong sectors
• Pressure leverage-dependent and speculative assets
This setup suggests a structural bid for yields, even during periods of short-term rate cuts or economic softness.
⚠️ This is not a short-term trade call, but a positioning framework for medium- to long-term market structure.

US 10Y TREASURY: relaxing Holiday weekDespite the Christmas holiday and non-working day, US Treasury markets continued to trade in a mixed manner. During this period of time, currently important macro data are not posted, in which sense; the market is searching the catalyst for moves in one or another direction. During the previous week, the 10Y Treasury yields tested the 4,2% current resistance level, however, swiftly turned toward the downside where 4,1% support was tested. Yields are closing the week at 4,13%.
The week ahead brings the end of the 2025 trading year, and a New-year holiday as well as another non-working day. Usually this is the period of the year when market participants on the Western markets are taking some time-off the trading floor. In this sense, there should be expected one calm week, where yields will most probably oscillate around current levels.

Global Economic Indicators & Macro Data Trading1. Understanding Global Economic Indicators
Economic indicators are statistical measures that reflect the overall health and direction of an economy. They are broadly categorized into leading, coincident, and lagging indicators.
Leading indicators signal future economic activity. Examples include Purchasing Managers’ Index (PMI), consumer confidence, building permits, and yield curves.
Coincident indicators move in line with the economy, such as GDP growth, industrial production, and employment levels.
Lagging indicators confirm trends after they occur, including unemployment rate, corporate profits, and inflation persistence.
Macro traders prioritize leading and coincident indicators because markets are forward-looking and tend to price expectations rather than past data.
2. Key Global Macro Indicators
a) Gross Domestic Product (GDP)
GDP measures the total value of goods and services produced in an economy. Strong GDP growth generally supports equity markets, strengthens the domestic currency, and raises interest rate expectations. Weak or contracting GDP signals economic slowdown, often boosting bonds and safe-haven assets like gold.
Traders focus not only on headline GDP but also on its composition—consumption, investment, government spending, and net exports—to assess sustainability.
b) Inflation Indicators
Inflation data such as Consumer Price Index (CPI), Producer Price Index (PPI), and Core Inflation are among the most market-moving indicators globally. Inflation directly influences central bank policy.
Rising inflation tends to push interest rates higher, strengthening currencies and pressuring equities.
Falling inflation or deflation expectations support bonds and growth stocks.
Macro traders closely analyze month-on-month trends, base effects, and inflation expectations embedded in bond markets.
c) Employment Data
Employment indicators like Non-Farm Payrolls (NFP), unemployment rate, labor force participation, and wage growth reflect economic momentum and consumer strength.
Strong job growth supports equities but may trigger tighter monetary policy. Weak employment data raises recession fears, benefiting bonds and defensive sectors.
3. Central Bank and Monetary Policy Data
Central banks are the most powerful drivers of macro markets. Interest rate decisions, policy statements, meeting minutes, and forward guidance significantly impact asset prices.
Interest Rates: Higher rates strengthen currencies and hurt interest-sensitive sectors.
Quantitative Easing (QE) / Tightening (QT): Liquidity injections support risk assets, while liquidity withdrawal increases volatility.
Forward Guidance: Markets often move more on what central banks say about the future than on the actual rate decision.
Macro data trading heavily revolves around predicting central bank responses to inflation and growth indicators.
4. Bond Yields and Yield Curves
Government bond yields reflect growth and inflation expectations. The yield curve—difference between short-term and long-term yields—is a crucial macro signal.
Normal curve: Indicates healthy growth expectations.
Inverted curve: Often precedes recessions and equity market corrections.
Traders monitor U.S. Treasury yields, German Bunds, and Japanese Government Bonds as global benchmarks influencing capital allocation.
5. Currency and Balance of Payments Data
Currencies respond strongly to macro data. Key indicators include:
Trade balance and current account data
Capital flows and foreign investment
Interest rate differentials
A strong economic outlook and higher interest rates attract foreign capital, strengthening the currency. Macro traders use economic data to build currency pair strategies, especially in USD, EUR, JPY, GBP, and emerging market currencies.
6. Commodity and Global Demand Indicators
Commodities are highly sensitive to macro data. Industrial metals like copper reflect global growth, while oil responds to economic activity and geopolitical factors. Agricultural commodities react to weather, supply chains, and demand trends.
China’s GDP, PMI, and industrial data are especially important, as China is a major consumer of global commodities. Macro traders often use commodity prices as leading indicators of inflation and economic cycles.
7. Geopolitical and Global Risk Indicators
Macro trading is not limited to economic numbers alone. Geopolitical events, trade policies, sanctions, wars, and global health crises significantly influence markets.
Risk indicators such as:
Volatility indices (VIX)
Credit spreads
Emerging market bond spreads
help traders assess global risk sentiment. During risk-off periods, capital typically flows into safe havens like the U.S. dollar, government bonds, gold, and defensive equities.
8. Macro Data Trading Strategies
a) Event-Driven Trading
Traders position ahead of major data releases like CPI, GDP, or central bank meetings. High-frequency and institutional traders exploit short-term volatility around announcements.
b) Trend and Cycle Trading
Macro traders align positions with economic cycles—growth, slowdown, recession, and recovery—allocating capital accordingly across asset classes.
c) Relative Value and Spread Trades
Comparing macro data between countries allows traders to take relative positions, such as long one currency and short another, based on growth and rate differentials.
d) Asset Allocation Shifts
Long-term investors use macro indicators to rebalance portfolios between equities, bonds, commodities, and cash as economic conditions evolve.
9. Challenges in Macro Data Trading
Macro trading is complex and probabilistic. Key challenges include:
Data revisions that change economic narratives
Market expectations already priced in before data release
Conflicting indicators sending mixed signals
Central bank intervention distorting natural market responses
Successful macro traders focus on expectations vs. actual data, not just whether numbers are good or bad.
10. Importance of Context and Risk Management
Macro data does not operate in isolation. Inflation data during a recession has a different impact than inflation during an expansion. Similarly, strong GDP growth may be negative for markets if it leads to aggressive rate hikes.
Risk management is critical due to high volatility around macro events. Position sizing, diversification, and scenario analysis are essential tools for macro traders.
Conclusion
Global economic indicators and macro data trading form the foundation of modern financial markets. From GDP and inflation to employment, central bank policy, and geopolitical risk, macro data shapes investor behavior across asset classes. Markets are forward-looking and driven by expectations, making interpretation and context more important than raw numbers. Successful macro traders combine economic analysis, market psychology, and disciplined risk management to navigate cycles, volatility, and uncertainty. In a world where global events instantly transmit across markets, mastering macro indicators is no longer optional—it is essential for sustainable trading and investment success.
US 10Y TREASURY: Narrow trading ahead of HolidaysThe US job market, inflation data and University of Michigan inflation expectations were shaping investors sentiment on a Treasury bond market during the previous week. The jobs market remains relatively slow, with an increased unemployment rate to 4,6% in November. On the other hand, inflation in November stood at 2,7%, below market expectations. University of Michigan next year inflation expectations are further decreased. Investors were weightening whether this could be an indication of a potential further rate cut by the Fed in 2026?
The US 10Y Treasury benchmark reached the highest weekly level at 4,19%, but closed the week lower, at 4,15%. Still, the lowest weekly level was reached on Thursday, at 4,10%. The week ahead marks the start of the Holiday season in the Western markets. This is usually the period of the year where the volatility remains relatively low. In this sense, it could be expected that 10Y yields will continue to move in a relatively short range, probably between 4,18% and 4,12%. Note that US markets are closed on December 25th, so no trading on this day.

The 6M United States 30-Year Treasury Bond YieldThe 6M United States 30-Year Treasury Bond Yield, Is Near A Top Area Between 4.80% - 5.28%, Which Means It's The Near A Bottom Of The Bear Market & Once We Reach Around 1.90% Is When We Will Reach The Top Of The Bull Market. So We Should Have A Huge Swing To The Downside Coming On The United States 30-Year Treasury Bond Yield. Which Will Kick Off The Huge Bullrun For The Market. We Are Nowhere Near Down Yet Just. Letting Yall Know 😁 👌


In price discovery phaseBroken all time highs , let's see how far does it goes I think 2.2% is around the corner. Warren Buffet is genius he has already deployed capital in Japan

10 year Bond has entered into the next 40 year Rate Super Cycle10 year Bond has entered into the next 40 year Rate Super Cycle. The Federal Reserve has zero control over rates. The failure of Keynesian Economics is fully on display and Rates are going up regardless of what the Fed attempts to do.

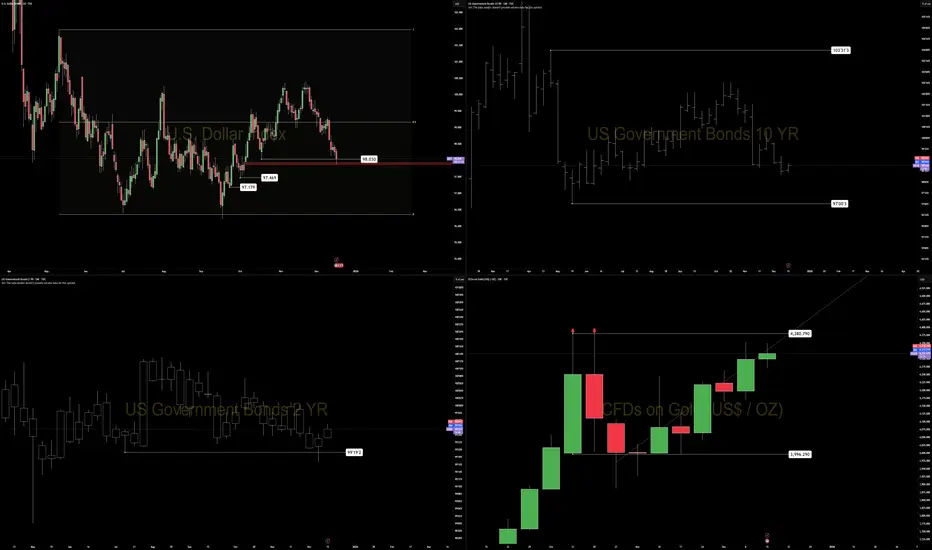
DXY — Daily Structure at a Decision PointThe dollar has completed a prior volume imbalance fill at 97.853 and is now trading against the lower boundary of the daily range.
Participation is low, consistent with late-December conditions. In this environment, daily closes matter more than intraday movement.
Key level: 98.030
This is the prior daily range low.
A daily close below 98.030 shifts the daily bias bearish
Without that close, downside pressure remains internal to the range
The move into imbalance without expansion suggests position resolution, not trend initiation. This is typical of year-end exposure reduction, rather than new macro positioning.
Cross-market context:
Gold is pressing into a double-high area without expansion.
Bonds are showing loss of momentum at the front end.
Risk assets remain supported but lack acceleration.
If structure breaks, the next natural downside references sit at 97.469 and 97.179.
Until a close confirms, this remains a confirmation environment, not a forecasting one.
The US 10-year yield has been stuck for 2 years… Markets on Edge: Is the US 10-Year Yield Breaking Out? 🚨
Investors are bracing for this week’s jobs & inflation data—the final major economic releases of the year. With the Federal Reserve divided over rate cuts and the Supreme Court weighing limits on Trump’s authority over the Fed, uncertainty is everywhere.
📉 U.S. Treasury yields dipped Monday, but the 10-year yield is showing signs of life:
- Resistance from May has eroded
- Testing September highs near 4.20%
- Eyeing the 200-day moving average at 4.25%
- Weekly charts reveal a 2-year contracting range—possibly forming a symmetrical triangle
- Break above 4.25% could target 4.66%
Disclaimer:
The information posted on Trading View is for informative purposes and is not intended to constitute advice in any form, including but not limited to investment, accounting, tax, legal or regulatory advice. The information therefore has no regard to the specific investment objectives, financial situation or particular needs of any specific recipient. Opinions expressed are our current opinions as of the date appearing on Trading View only. All illustrations, forecasts or hypothetical data are for illustrative purposes only. The Society of Technical Analysts Ltd does not make representation that the information provided is appropriate for use in all jurisdictions or by all Investors or other potential Investors. Parties are therefore responsible for compliance with applicable local laws and regulations. The Society of Technical Analysts will not be held liable for any loss or damage resulting directly or indirectly from the use of any information on this site.

10Y-3MO Yield Curve Un-InversionWhich came first, the chicken or the egg? Or in the economic sense, the instability in the financial system or the Black Swan event? Regardless, if history tends to rhyme, this is one out of many indicators to keep in the back of the mind. I don't want to ring any senseless alarm bells but keep am keeping my eyes peeled.
1.) The unemployment rate has bottomed and turned a corner -- it's rising and I anticipate an acceleration.
2.) Inversely, the Fed Funds Rate has topped for the cycle and I assume it will continue to fall next year.
Those two forces have been solid bell weathers ahead of recessions. With the $7 trillion spending bill that is bound to eventually pass sometime next year, I'm hoping for one final push to run asset prices hot before seriously considering a cooling or deflation. What do you guys think?

US 10Y TREASURY: Testing 4,2%The Fed decreased interest rates by 25 basis points as it was expected. The economic outlook remains modestly positive, with risks on both inflation and jobs. The Fed does not perceive that the inflation would return to targeted 2% during next year. That could be a short summary of the latest FOMC meeting, held last week. The 10Y Treasury benchmark yield traded higher, despite a short drop toward the 4,1%. Friday brought another shift back to 4,19%, after Chicago Federal reserve President Austan Goolsbee noted that the Fed should not lower interest rates further, after three cuts since September. This was not in alliance with market expectations, as investors are pricing at least two rate cuts during 2026.
The market is currently testing the 4,2% 10Y yields. It could be expected that this trend will continue also during the week ahead. On the other hand some modest relaxation in yields is also probable, but only till the level of 4,15%. At this moment, investors are trying to assess the course of monetary actions during next year, in which sense, some volatility might prevail.

10YR Heading HigherIt is very likely as long as this trend continues that the 10-year goes back up to test the 4.3% level. If the administration can get the long end under control like they would like to, then we could see a move lower from there. But for now prepare for higher rates for at least a few more months.

US 30-year yields hit post FOMC highUh-oh. This is not what you would have expected to see if the Fed was perceived to be more dovish than expected. Also 10y yields show similar price action. Suggests rates will remain high for longer. Possibly a bearish factor for tech stocks. Keep an eye on 30y yields to see if they will break the trend line. Could trigger a bit of vol into year end if it does.
By Fawad Razaqzada, market analyst with FOREX.com

Swap Trading Secrets1. What Is a Swap?
A swap is a contract between two parties to exchange cash flows or financial obligations for a specified period. These exchanges typically involve interest rates, currencies, commodities, or credit risks.
Think of a swap like this:
You have one type of cash flow.
I have another.
We exchange them because each of us prefers the other’s structure.
This exchange helps both parties balance risk, stabilize cash flows, or lock in profits.
Swaps are custom-designed, traded over the counter (OTC), and not listed on exchanges.
2. Major Types of Swaps
To understand swap trading secrets, you first need to know the main types used globally:
1. Interest Rate Swaps (IRS)
Most common type.
Party A pays a fixed rate.
Party B pays a floating rate.
Useful for:
Hedging interest costs.
Managing debt efficiently.
2. Currency Swaps
Exchange principal + interest in different currencies.
Useful for:
Reducing currency risk.
Accessing foreign loans at cheaper rates.
3. Commodity Swaps
Fixed vs floating commodity prices.
Useful for:
Hedging input costs (oil, metals, agri).
Locking profit margins.
4. Credit Default Swaps (CDS)
Insurance against bond default.
Useful for:
Hedging credit risk.
Speculating on company survival.
5. Equity Swaps
Exchange equity returns for interest or another equity index.
Useful for:
Gaining exposure without owning the asset directly.
3. Why Swaps Are Considered a “Secret Weapon”
Swaps provide powerful advantages that many traders do not see:
A. Hidden Leverage
Institutions gain exposure to markets:
WITHOUT owning assets,
WITHOUT large upfront capital.
This makes swaps an efficient way to amplify returns.
B. Off-Balance-Sheet Benefits
Swaps can shift risks without moving assets on books, making financial statements look cleaner.
C. Customization
Unlike futures, swaps are tailor-made:
Amount
Duration
Payment structure
Asset type
Currency
This gives institutions almost unlimited flexibility.
D. Access to Better Pricing
Banks and hedge funds use swaps to:
Access lower foreign interest rates
Reduce borrowing costs
Hedge exposures cheaply
This pricing advantage is one of the biggest swap trading secrets.
E. Tax Optimization
Some institutions use swaps to:
Receive returns without triggering capital gains
Change income types for tax benefits
4. How Institutions Actually Use Swap Trading
Now let’s explore the real-world secrets of how swaps are used.
Secret 1: Hedging Interest Rate Risk Like a Pro
When interest rates rise or fall, companies with loans face huge cost changes.
So they use Interest Rate Swaps:
If expecting rates to rise → pay fixed, receive floating.
If expecting rates to fall → receive fixed, pay floating.
This stabilizes their cash flows.
Example:
A company with a floating-rate loan fears rising rates.
They enter a swap to pay 5% fixed and receive floating.
If floating rates shoot to 8%, the swap saves them millions.
Secret 2: Currency Swaps for Cheaper Global Loans
Corporations often borrow in foreign currencies.
But banks offer different interest rates in different countries.
So companies use currency swaps to borrow where rates are cheaper, then swap back to their local currency.
Example:
An Indian company might borrow yen at 1% instead of rupees at 7%, then swap obligations with a Japanese firm.
This cuts financing cost dramatically.
Secret 3: Equity Exposure Without Buying Shares
Hedge funds love equity swaps because they:
Get full market returns
Avoid ownership reporting
Avoid voting rights
Avoid taxes on buying/selling stocks
Can build secret positions
This is how some funds take huge equity bets without showing them publicly.
Secret 4: Commodity Swaps to Lock Prices Years Ahead
Airlines, manufacturers, and refiners use commodity swaps to stabilize costs.
Example:
An airline may fix jet fuel prices for three years through swaps, eliminating volatility.
This ensures consistent profit margins regardless of market swings.
Secret 5: Credit Default Swaps for Hidden Speculation
CDS contracts let traders “bet” on whether a company will default.
Professionals use CDS to:
Hedge corporate bond exposure
Take leveraged positions on credit quality
Profit from market panic or recovery
Some hedge funds made billions during the 2008 crisis via CDS trades.
5. Secret Trading Strategies Using Swaps
Let’s break down advanced strategies used in swap trading.
A. Swap Spread Trading
Traders exploit differences between:
Swap rates
Government bond yields
If swap spreads widen or narrow unexpectedly, traders enter opposite positions to profit from mean reversion.
B. Curve Steepening / Flattening Strategies
Traders use interest rate swaps to bet on the shape of the yield curve.
Steepener: receive fixed (long end), pay fixed (short end)
Flattener: opposite
These are used when expecting macroeconomic shifts.
C. Currency Basis Arbitrage
Banks exploit differences between:
Currency forward rates
Interest rate differentials
Swap rates
This arbitrage generates low-risk profits.
D. Synthetic Asset Exposure
Traders use swaps to create:
Synthetic bonds
Synthetic equity positions
Synthetic commodities
This avoids capital requirements and tax implications.
E. Hedged Carry Trades
Funds borrow in low-rate currencies and swap into higher-rate currencies while hedging currency risk.
This generates predictable “carry” income.
6. Key Risks in Swap Trading
Swaps are powerful, but they carry risks:
1. Counterparty Risk
If your swap partner defaults, you lose.
(This is what happened with Lehman Brothers.)
2. Liquidity Risk
Swaps cannot be easily sold like stocks.
3. Interest Rate / Market Risk
If the market moves against your swap position, you face large losses.
4. Valuation Complexity
Swaps require mark-to-market calculations.
5. Legal & Operational Risk
Documentation errors can cause disputes.
7. Why Retail Traders Rarely Use Swaps
Swaps require:
Large contracts
Institutional relationships
Legal agreements
Creditworthiness
Sophisticated pricing models
However, retail traders indirectly benefit through:
Mutual funds
ETFs
Banks
Derivative products
These institutions use swaps behind the scenes to improve performance.
Conclusion
Swap trading is one of the financial world’s most powerful, secretive, and flexible tools. Institutions use swaps to hedge risk, create leverage, optimize taxes, reduce financing costs, and structure sophisticated trading strategies across interest rates, currencies, commodities, and credit.
Even though retail traders rarely trade swaps directly, understanding them gives you insights into how the world’s largest financial players operate. If you understand swap dynamics, you gain a deeper understanding of global money flows, risk management, and institutional market behavior.