The power of community
Get inspiration for your next trade. Don't reinvent the wheel.

Bitcoin - New all time high soon! (Follow this channel)Bitcoin is breaking out of the bear market structure and creating a new uptrend that will lead to an all-time high! This thesis is supported by the fact that after the halving event, Bitcoin always goes up (statistically, 100% probability). The halving event took place 1 month ago and cut the reward

Bitcoin BTC price + CPI US 15.05 will stir up the marketHere is a chart of #BTCUSDT on the 12-hour timeframe.
At first glance, it looks nothing special: a prolonged consolidation on falling trading volumes, everything is natural and natural.
But tomorrow, at 15.05 at lunchtime with the close of the 12hr candlestick, everything can change.
Tomorrow is

GameStop Stock Evokes Dreams of Rocket Ships and Diamond HandsShares of the video game store tested retail traders’ survival skills. But the meme stock madness also bamboozled the pros.
In the span of just a few regular trading sessions, with some stomach-churning pre-market action in between, GameStop once again made headlines. Roughly three years ago, Kei

Bitcoin: 64K Test For New Longs.Bitcoin has followed my anticipated scenario nicely over the recent two weeks (it doesn't always agree). As I have written in my previous two articles, the 64K and 68K resistance areas are potential take profit zones, NOT locations to put on more risk. Price action appears to be confirming that and

🚀📊 "Binance Coin Analysis: Poised for a New Uptrend?" 📈✨💹 Let's dive into the analysis of Binance Coin (BNB), one of the top-ranking and popular cryptocurrencies. We'll look for new entry and exit points to maximize our profits in this market.
📝 Background : As you might know, BNB is the native coin of Binance, the largest cryptocurrency exchange. Many

Intel - Stop the bleeding!Hello Traders and Investors, today I will take a look at Intel .
--------
Explanation of my video analysis:
In the beginning of 2023 Intel stock retested a multi year long horizontal structure at the $26 level. Here Intel created bullish confirmation and took off, creating a crazy rally of +10

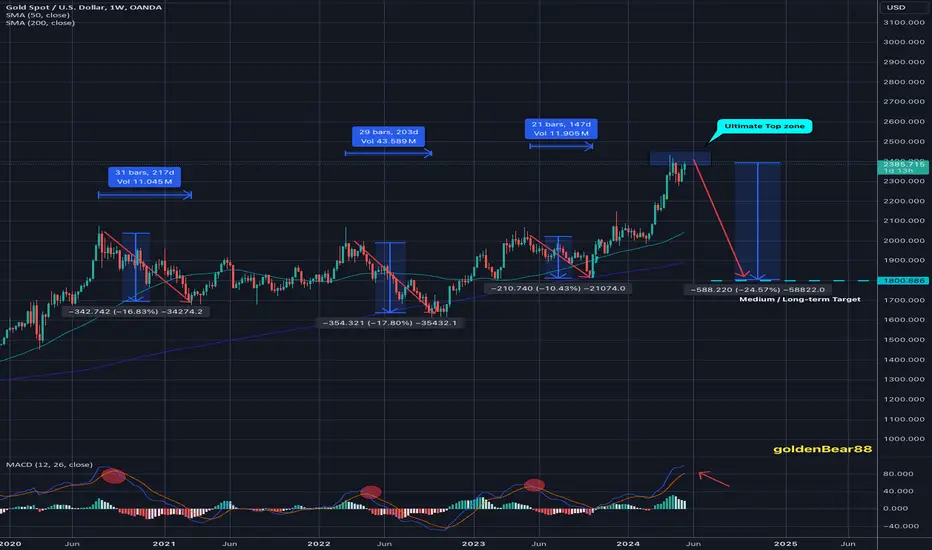
Multi-Month Bearish cycle ahead / #1,800.80 TargetGold's general commentary: As discussed, if Gold does not invalidate #2,452.80 - #2,500.80 psychological benchmarks in extension (Buying every Low's / less likely), I am expecting Gold to finish the Monthly fractal below #2,300.80 benchmark. Needless to mention, that would be Bearish for Gold’s Med

SILVER TO $750 IN THE NEXT DECADE ?This has to be the biggest Cup & Handle Formation in Human History. Holy Smokes.
Ok, let's dive into the Fundamentals:
1) Industrial Demand: Silver is essential in various high-growth industries such as electronics, solar energy, and medical devices. As technological advancements continue, the dem

See all editors' picks ideas
Learn the ins and outs of trading.
Trapped traders provides a great Short opportunity on DOW The plan for the session was to trade short off resistance on the DOW after an initial opening drive higher. The short side was the play and paid out nicely for patient sellers.
In the video I talk through the key Price Action for the move and prime trade areas on the DOW Index.
ANY QUESTIONS, JU

Want to spot a turning point in trend before it happens?Want to spot a turning point in trend before it happens? Use Elliott wave parallel channel
This chart shows the GBP/JPY currency pair using monthly candlesticks. The advance from Sep 2011 to June 2015 can be labeled as an impulse wave (A). From that high, the pair declined in three waves labeled a

Myth Busting: Market Style!I have been very lacking in producing educational content. I know a lot of you follow for my analysis, some others for my indicators and some others for my educational content. While I have been getting back in the groove of posting for the later 2, I have neglected those interested in educational c

5-Year SPX500 Expectations - Greatest Opportunity Of Your LifeWould you believe me if I told you the US & global markets (some) will rally more than 65% to 125% (or more) over the next 4 to 5+ years?
You would probably call me crazy for even suggesting that will happen in a reasonably short time frame.
But, what if I could show you how structurally (using El

Chronicle of a Foretold Pump/DumpPump/Dump schema:
Discrete Share accumulation.
Broadcasted Triggering Event (news, rumors, forums, etc).
Gather the mass of "Bagholders".
Dump all the load.
Pocket the quick profit.
I am not a fan of " meme stocks " because they're very much like penny stocks, prone to pump/dump scheme

Predicting Bitcoin's Cycle Using the Elliott Wave TheoryGreetings, fellow traders. In this article, we'll be reassessing our annual Elliott Wave counts and going deeper into interpreting Bitcoin's current decade cycle. I'll make sure to segment each part by drawing insights from the previous cycles, also employing the Elliott Wave Theory, and integrating


How to trade tax-free: spread bettingCFD trading has a close cousin you may not know about … spread betting.
Just like CFD trading, spread betting allows you to speculate on the future direction of a market's price without owning the underlying asset.
Key advantages include:
Tax efficiency : Profits from spread betting are free

New Volume Footprint option on TradingViewHi all,
This is the first (stream replacement) educational video with a very quick overview of volume. Tradingview just released the new Footprint Beta tool. It's something I asked them for a long time ago, so I am glad it's finally here!
In this video I cover the time-price-opportunity tool as

Three Factors Keeping Oil Prices in CheckAT A GLANCE:
Despite ongoing geopolitical conflict, oil prices and volatility are relatively low
A rise in U.S. crude production and weak demand in China are helping oil inventories maintain average levels
Considering many factors like the Russia-Ukraine war, OPEC+ cutting production by 3.6

See all editors' picks ideas
Trading explainers – why read when you can watch instead?
Trapped traders provides a great Short opportunity on DOW The plan for the session was to trade short off resistance on the DOW after an initial opening drive higher. The short side was the play and paid out nicely for patient sellers.
In the video I talk through the key Price Action for the move and prime trade areas on the DOW Index.
ANY QUESTIONS, JU
5-Year SPX500 Expectations - Greatest Opportunity Of Your LifeWould you believe me if I told you the US & global markets (some) will rally more than 65% to 125% (or more) over the next 4 to 5+ years?
You would probably call me crazy for even suggesting that will happen in a reasonably short time frame.
But, what if I could show you how structurally (using El
Intel - Stop the bleeding!Hello Traders and Investors, today I will take a look at Intel .
--------
Explanation of my video analysis:
In the beginning of 2023 Intel stock retested a multi year long horizontal structure at the $26 level. Here Intel created bullish confirmation and took off, creating a crazy rally of +10
New Volume Footprint option on TradingViewHi all,
This is the first (stream replacement) educational video with a very quick overview of volume. Tradingview just released the new Footprint Beta tool. It's something I asked them for a long time ago, so I am glad it's finally here!
In this video I cover the time-price-opportunity tool as
When Are You READY to Trade with REAL MONEY?Hello hello, R2F here with another discussion.
Today, I'd like to go over the question, 'when do you know you are ready to trade with real money?'
Too many traders rush into trading with real capital before they are ready, and end up losing more money than neccessary on learning journey. People a

The TradingView Show: Live With OKX & TradeTravelChillGreetings, TradingViewers worldwide! This interview was conducted live and is now available for playback and on-demand viewing on our TradingView account, accessible for free. This program delves into trader education, cryptocurrencies, and the flexibility of trading from anywhere with an Internet c

Why will Ethereum drop toward 2500 levelLiquidity is slowing off Etherum toward Bitcoin as show on the ETH/BTC pair
structure at lower timeframe is respecting the 50% fib level and also trending downward inside the channel , as it repeats is similar pattern!!
Thank you for watching
Follow me for more crypto analysis

See all editors' picks ideas
Trading indicators and strategies built by our community.
Ichimoku Theories [LuxAlgo]The Ichimoku Theories indicator is the most complete Ichimoku tool you will ever need. Four tools combined into one to harness all the power of Ichimoku Kinkō Hyō.
This tool features the following concepts based on the work of Goichi Hosoda:
Ichimoku Kinkō Hyō: Original Ichimoku indicator with

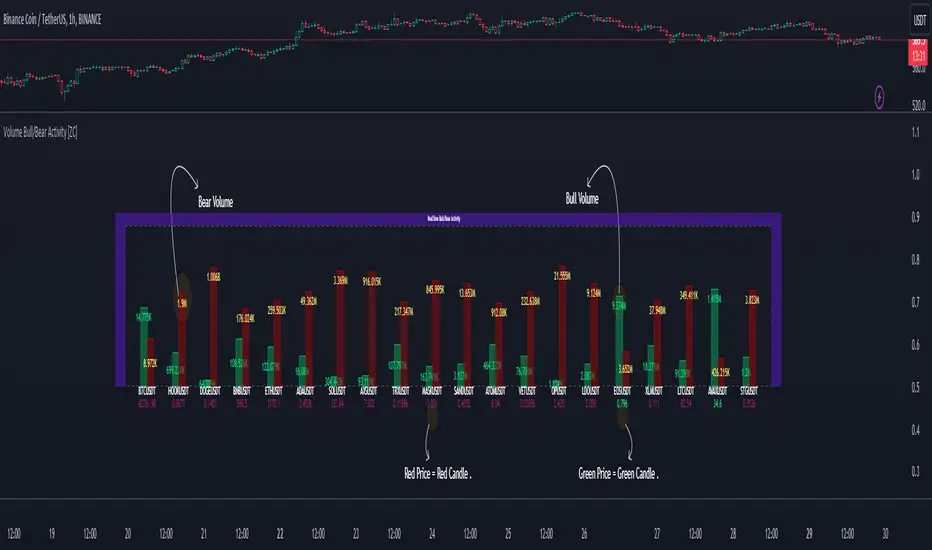
Volume Bull/Bear Activity [ZC]Volume Bull/Bear Activity Summary
This indicator generates a summary of bull/bear activity for 20 symbols.
For each symbol, two bars are displayed, colored green and red.
The green bar indicates bull volume, reflecting activity within the last candle of the symbol.
The red bar signifie
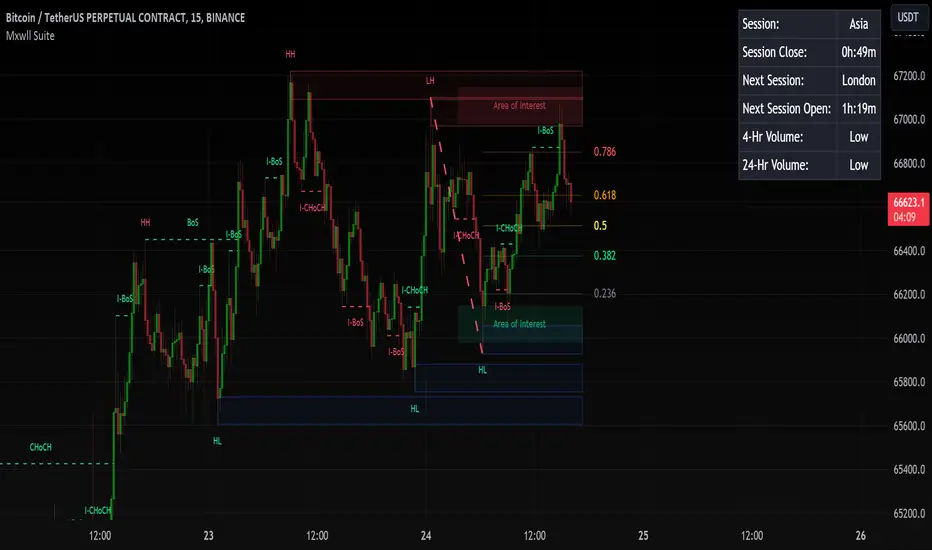
Mxwll Price Action Suite [Mxwll]Introducing the Mxwll Price Action Suite!
The Mxwll Price Action Suite is an all-in-one analysis indicator incorporating elements of SMC and also ideas extending beyond the trading methodology!
Features
Internal structures
External structures
Customizable Sensitivities
BoS/CHoCH
Order B
Percent Rank HistogramThis Pine script indicator is designed to create a visual representation of the percent rank for multiple financial instruments. Here's a breakdown of its key features:
Percent Rank Calculation:
The core functionality of this Pine script indicator revolves around the calculation of the percent r

Heat Map SeasonsHeat Map Seasons indicator
Indicator offers traders a unique perspective on market dynamics by visualizing seasonal trends and deviations from typical price behavior. By blending regression analysis with a color-coded heat map, this indicator highlights periods of heightened volatility and helps

Index Generator [By MUQWISHI]▋ INTRODUCTION :
The “Index Generator” simplifies the process of building a custom market index, allowing investors to enter a list of preferred holdings from global securities. It aims to serve as an approach for tracking performance, conducting research, and analyzing specific aspects of the glob

Higher-timeframe requests█ OVERVIEW
This publication focuses on enhancing awareness of the best practices for accessing higher-timeframe (HTF) data via the request.security() function. Some "traditional" approaches, such as what we explored in our previous `security()` revisited publication, have shown limitations

Trailing Management (Zeiierman)█ Overview
The Trailing Management (Zeiierman) indicator is designed for traders who seek an automated and dynamic approach to managing trailing stops. It helps traders make systematic decisions regarding when to enter and exit trades based on the calculated risk-reward ratio. By providing a cle

Periodic Activity Tracker [LuxAlgo]The Periodic Activity Tracker tool periodically tracks the cumulative buy and sell volume in a user-defined period and draws the corresponding matching bars and volume delta for each period.
Users can select a predefined aggregation period from the following options: Hourly, Daily, Weekly, and Mo

Gaps Profile [vnhilton]Note: If you get an error preventing indicator from executing due to a loop running longer than >500ms, please lower the amount of boxes shown and/or increase the minimum gap % threshold.
OVERVIEW
The Gaps Profile (GP) simply shows the remaining gaps on the chart that have yet to be closed. Gaps
See all editors' picks scripts