Tesla among top 10 losers. Next what?Tesla is the 7th worst performer YTD in the Nasdaq-100. It is the 11th worst performer in the S&P 500. The stock stands 28% lower.
Still, after reaching its lowest level on 22/April, the stock has rallied a remarkable 30%. On 24/April, the stock rallied 12% after the positive earnings call. On 29/
What's happening today with Tesla
- •U.S. prosecutors investigate Tesla for possible fraud in self-driving tech claims, examining Autopilot and Full Self-Driving features. Musk's comments lead to a 3.5% stock fall.
- •Tesla's stock dropped 3.8% due to a 30% sales dip from its Shanghai plant and an 18% annual decline, alongside concerns over 20 accidents linked to its driver-assistance features.
- •Tesla's Berlin gigafactory was shut down for a week due to protests and an arson attack by Vulkan Group, affecting its expansion.
Next report date
—
Report period
—
EPS estimate
—
Revenue estimate
—
4.29USD
15.00 BUSD
96.77 BUSD
2.77 B
About Tesla
Sector
Industry
CEO
Elon Reeve Musk
Website
Headquarters
Austin
Employees (FY)
140.47 K
Founded
2003
FIGI
BBG000N9MNX3
Tesla, Inc engages in the design, development, manufacture, and sale of fully electric vehicles, energy generation and storage systems. It also provides vehicle service centers, supercharger station, and self-driving capability. The company operates through the following segments: Automotive and Energy Generation and Storage. The Automotive segment includes the design, development, manufacture and sale of electric vehicles. The Energy Generation and Storage segment includes the design, manufacture, installation, sale, and lease of stationary energy storage products and solar energy systems, and sale of electricity generated by its solar energy systems to customers. It develops energy storage products for use in homes, commercial facilities and utility sites. The company was founded by Jeffrey B. Straubel, Elon Reeve Musk, Martin Eberhard, and Marc Tarpenning on July 1, 2003 and is headquartered in Palo Alto, CA.

Trading Diverging Chart PatternsContinuing our discussion on trading chart patterns, this is our next tutorial after Trading Converging Chart Patterns
This tutorial is based on our earlier articles on pattern identification and classification.
Algorithmic Identification of Chart Patterns
Flag and Pennant Chart Patterns

Tesla - Is it a fakeout?Hello Traders and Investors, today I will take a look at Tesla.
--------
Explanation of my video analysis:
Back in 2020 we had a decent break and retest on Tesla stock which was followed by a pump of +1.500% towards the upside. Then Tesla topped out in 2021 and we saw sideways movement ever sin

HERE ARE 10 COMMON TRADING INDICATORS MADE SIMPLE Chart has all 10.
Hope this helps.
Hope it's simple to understand if you still struggle with indicators.
Remember, no one indicator is good on its own.
Think of an indicator as a sign that you should pay attention to a possibility. For example, if I go to the ocean, maybe I have an indicator th

Tesla updateTesla has been in a range for almost a week now. That leaves the possibility open that this is a wave 4 of some degree. Accordinng to my count, this is either wave iv or wave 2. The move down from the high of $198.87 on 29 April looks as if it is wave a of some degree. Without more data it is hard t

TSLA Up Trend started ?This up move is different, It started with GREEN UMVD and now Green TrapZone is also showing up. Current bars are Gray so we must wait for GREEN Bars to enter when up momentum resumes. If we break both angles going UP , down trend may resume so keep you Technical Tools handy :)

$TSLA Super Long Check In Checking up on our NASDAQ:TSLA play, we can see that NASDAQ:TSLA gapped up strong on earnings with a nice run off our bottom trend line.
Zooming in on the Daily we can see a classic Wash, Trap Squeeze pattern emerging.
The conclusion of this pattern will lead us to grab Liquidity at the 205,

TslaTESLA Chart Analysis.........07/05/2024
Long: already at 140 level.
Sl : 100 closing basis
Target : 400 / 600
Enjoy !
Note : Bullish Pennant pattern in TESLA weekly chart. You have to book some profit at 400 level and also trail the stop-loss in the remaining positions.

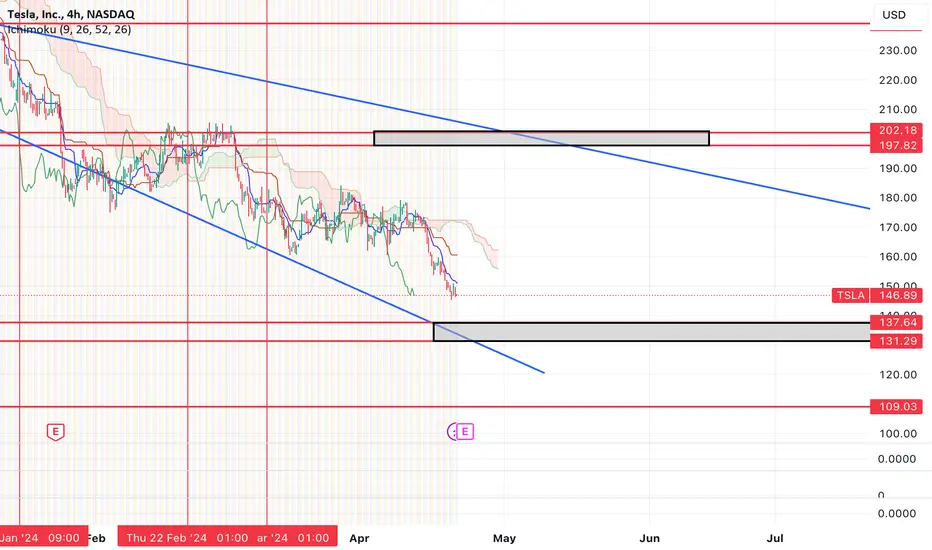
$TSLA bottoming soon around $131-137 and then push to $200?NASDAQ:TSLA looks to be close to making a short term bottom.
Thinking we could see price find support in the $131-137 range and then with earnings see a push to $200 or so.
NASDAQ:TSLA has been the leader to the downside and it looks to be nearing exhaustion. Would make sense for the leader to
TSLA MAY 2 OUTLOOK My opinions on how NASDAQ:TSLA will move in the next weeks. Not financial advised.

See all ideas
Trade directly on the supercharts through our supported, fully-verified and user-reviewed brokers.


Curated watchlists where TSLA is featured.


Frequently Asked Questions
The current price of TSLA is 174.72 USD — it has decreased by 1.74% in the past 24 hours. Watch Tesla stock price performance more closely on the chart.
Depending on the exchange, the stock ticker may vary. For instance, on NASDAQ exchange Tesla stocks are traded under the ticker TSLA.
Tesla is going to release the next earnings report on Jul 17, 2024. Keep track of upcoming events with our Earnings Calendar.
TSLA stock is 4.50% volatile and has beta coefficient of 2.12. Track Tesla stock price on the chart and check out the list of the most volatile stocks — is Tesla there?
TSLA earnings for the last quarter are 0.45 USD per share, whereas the estimation was 0.49 USD resulting in a −8.54% surprise. The estimated earnings for the next quarter are 0.60 USD per share. See more details about Tesla earnings.
Tesla revenue for the last quarter amounts to 21.30 B USD despite the estimated figure of 22.22 B USD. In the next quarter revenue is expected to reach 24.34 B USD.
Yes, you can track Tesla financials in yearly and quarterly reports right on TradingView.
TSLA stock has fallen by 4.00% compared to the previous week, the month change is a 3.18% rise, over the last year Tesla has showed a 3.42% increase.
TSLA net income for the last quarter is 1.17 B USD, while the quarter before that showed 7.93 B USD of net income which accounts for −85.23% change. Track more Tesla financial stats to get the full picture.
Today Tesla has the market capitalization of 567.07 B, it has decreased by 6.63% over the last week.
No, TSLA doesn't pay any dividends to its shareholders. But don't worry, we've prepared a list of high-dividend stocks for you.
Like other stocks, TSLA shares are traded on stock exchanges, e.g. Nasdaq, Nyse, Euronext, and the easiest way to buy them is through an online stock broker. To do this, you need to open an account and follow a broker's procedures, then start trading. You can trade Tesla stock right from TradingView charts — choose your broker and connect to your account.
TSLA reached its all-time high on Nov 4, 2021 with the price of 414.50 USD, and its all-time low was 1.00 USD and was reached on Jul 7, 2010. View more price dynamics on TSLA chart.
See other stocks reaching their highest and lowest prices.
See other stocks reaching their highest and lowest prices.
As of May 9, 2024, the company has 140.47 K employees. See our rating of the largest employees — is Tesla on this list?
Investing in stocks requires a comprehensive research: you should carefully study all the available data, e.g. company's financials, related news, and its technical analysis. So Tesla technincal analysis shows the sell today, and its 1 week rating is sell. Since market conditions are prone to changes, it's worth looking a bit further into the future — according to the 1 month rating Tesla stock shows the sell signal. See more of Tesla technicals for a more comprehensive analysis.
If you're still not sure, try looking for inspiration in our curated watchlists.
If you're still not sure, try looking for inspiration in our curated watchlists.
We've gathered analysts' opinions on Tesla future price: according to them, TSLA price has a max estimate of 310.00 USD and a min estimate of 85.00 USD. Watch TSLA chart and read a more detailed Tesla stock forecast: see what analysts think of Tesla and suggest that you do with its stocks.
EBITDA measures a company's operating performance, its growth signifies an improvement in the efficiency of a company. Tesla EBITDA is 12.27 B USD, and current EBITDA margin is 14.01%. See more stats in Tesla financial statements.