Rising Wedge Pattern S&P 500There is clear a Rising Wedge Pattern formed on S&P 500 4h chart .
There was even a retracement from all-time highs of 6979 back inside the wedge before the weekend.
My suggested SL is 7030-7050 and TP 6500-6550 for the short-to-mid term.
On a larger scale, there is also a huge channel that we are testing the top of right now:
Going all the way back to 2008..
It could easily end up like this:
So for longer term I can see 6100, 5500, 5000 and if recession hits than even 3500.
There has never been such a major Fed hiking and cutting cycle that did not eventually cause a recession. Also, the labor market is weaker than the headline numbers make it seem. Lots of massive downward revisions on NFP. Even the unemployment number is growing slowly, mostly because Labor Force Participation is dropping. If we account for that, then the real unemployment rate is more like 5.5%.
Here are some more examples of rising wedges going back to the pandemic:
Recession

Interesting action in DXYCould we be in for a long decrease in dollar value as DXY rejects new level?

Gold/Copper Signaling Recession & Market Super bubble!We're continuing to see extreme signals from Gold, and that should raise concerns.
Earlier, I highlighted the Gold/Oil ratio — now, I want to draw your attention to the Gold/Copper ratio:
🔗
Historically, such extreme readings in the Gold/Copper ratio have consistently preceded recessions. The only exception? A period of economic stagnation and sideways markets — not exactly a bullish outcome. See the chart from 2014 to 2016
🔗 www.tradingview.com
Quick recap:
Gold = Fear + Inflation hedge
Copper = Economic strength + Inflation signal
Oil = Similar to Copper; reflects growth and inflation expectations
These divergences aren't random — they’re warning signs of a recession & market Super Bubble that's about to POP!
These are not random fluctuations of prices. You can choose to view them as such. I get it. But from a macroeconomic perspective, this is bad JUJU!
Capitalism without failure is like religion without hell! Remember that!
Click boost, like, and subscribe! Let's get to 5,000 followers! ))

Silvers Worth More than Oil! CAUTION!The last time silver traded above both oil and gold was during the Hunt Brothers’ attempt to corner the silver market (arguably the original anti-government Crypto Bros speculators with Lambos, if you think about it. LOL!)
What makes the current setup different is that this move is occurring without a concentrated speculative corner. Silver is outperforming both oil and gold amid systemic monetary stress, driven by broad market forces rather than manipulation.
A currency crisis is therefore one of my leading candidates for what could ultimately blindside markets. It is not the only risk I am monitoring — there are other developing factors and potential catalysts — but this signal stands out and deserves close attention in my view.
Consider what’s happening simultaneously:
The JPY is collapsing in value
The BOJ is raising rates
The Japanese 10-year yield has surged to ~2.0%
The carry trade is being margin-squeezed
Gold is exploding relative to oil
Oil is collapsing
Silver is now outperforming both oil and gold
Trump Starting A Trade war with the world
The DXY is down ~10% since Trump took office.
China has cut U.S. Treasury holdings roughly in half
Central banks are buying gold aggressively
These are not isolated events. They are anomalies clustering at the same time, signaling the same problem. CUERRENCY!
People may not be talking about this with their mouths on social media with silly memes, but they are speaking very loudly & clearly with their MONEY! It’s usually worth listening to what they are saying. The problem is that 99.9% of people don't know what to listen to in a crowded stadium when everyone is yelling and cheering.
That’s why I post observations like this, even if they seem boring or unexciting. I could be more popular by “just giving you the trade,” but context matters. This information is often more important than people realize — especially before it shows up in price. ;)
Here are some of my other posts that relate:
I maintain my position my GTFO and STFO!
CAUTION IS IN ORDER!
THANK YOU for getting me to 5,000 followers! 🙏🔥
Let’s keep climbing.
If you enjoy the work:
👉 Drop a solid comment
Let’s push it to 6,000 and keep building a community grounded in truth, not hype.

MICROSOFT Hit a WALL. DOUBLE TOPPED and WILL DROPPrice action has confirmed and triggered a double top pattern.
Calling tops in tech is dangerous as we all know.
But as Tech fatigue hits, and selloffs quicken, the risk of a deeper shakeout increases.
Remember US stock market is 230% of GDP.
With increasing Job Losses.

10Y-3MO Yield Curve Un-InversionWhich came first, the chicken or the egg? Or in the economic sense, the instability in the financial system or the Black Swan event? Regardless, if history tends to rhyme, this is one out of many indicators to keep in the back of the mind. I don't want to ring any senseless alarm bells but keep am keeping my eyes peeled.
1.) The unemployment rate has bottomed and turned a corner -- it's rising and I anticipate an acceleration.
2.) Inversely, the Fed Funds Rate has topped for the cycle and I assume it will continue to fall next year.
Those two forces have been solid bell weathers ahead of recessions. With the $7 trillion spending bill that is bound to eventually pass sometime next year, I'm hoping for one final push to run asset prices hot before seriously considering a cooling or deflation. What do you guys think?

HOG TIED! Harley could be signalling the next recession.Maybe just a company specific short idea.
Or does Harley represent the broader American consumer confidence.
The sharp declines during the GFC and CV 19 certainly indicates a highly sensitive area of the economy --- Luxury motorcycles.
The core customer base is aging and younger riders are less drawn to big, expensive cruisers no doubt. Harley's attempts to pivot to smaller bikes and electrics have seen minimal sales.
In summary you have declining volatile revenue, margin pressure and large strategic uncertainty, so the market derates the stock even with one off decent Quarterly earnings.
That combo is producing a grinding downtrend or a broken chart.
Each rally on earnings beats get sold down as long money rotates out to other higher growth stories.
@TheCryptoSniper
#HuntVolatiltyFunnel

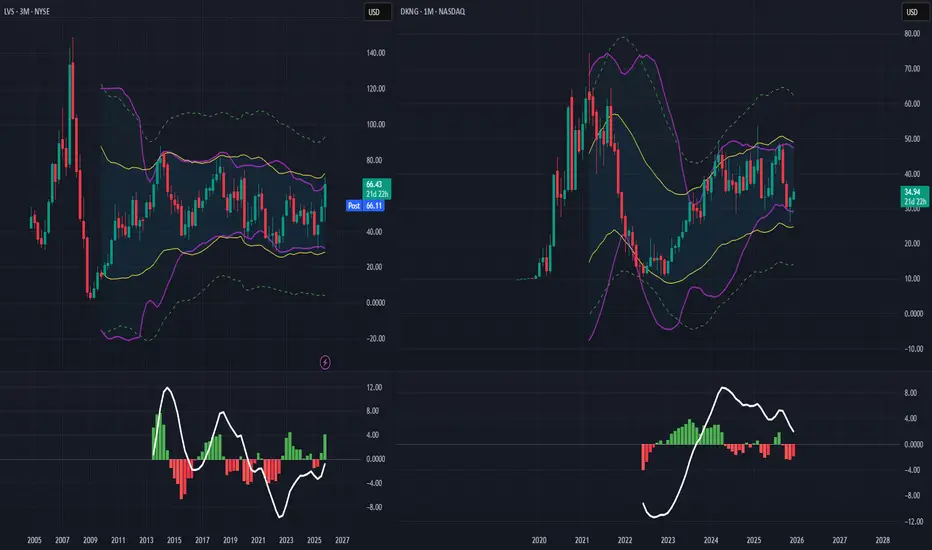
Long Gambling - DKNG and LVSWe are tracking a quarterly squeeze (left chart) on NYSE:LVS as well as a monthly squeeze on NASDAQ:DKNG
As the economy further deteriorates and the average consumer continues to struggle, i expect these 'vice' stocks to outperform over the next 12-18 months.
I will be looking for strategic entries into both of these names, with NASDAQ:DKNG being closer to an appropriate entry.
Keep in mind ALL positions would still be HEDGED, as a broad selloff WILL drag everything down with it, at least short term.
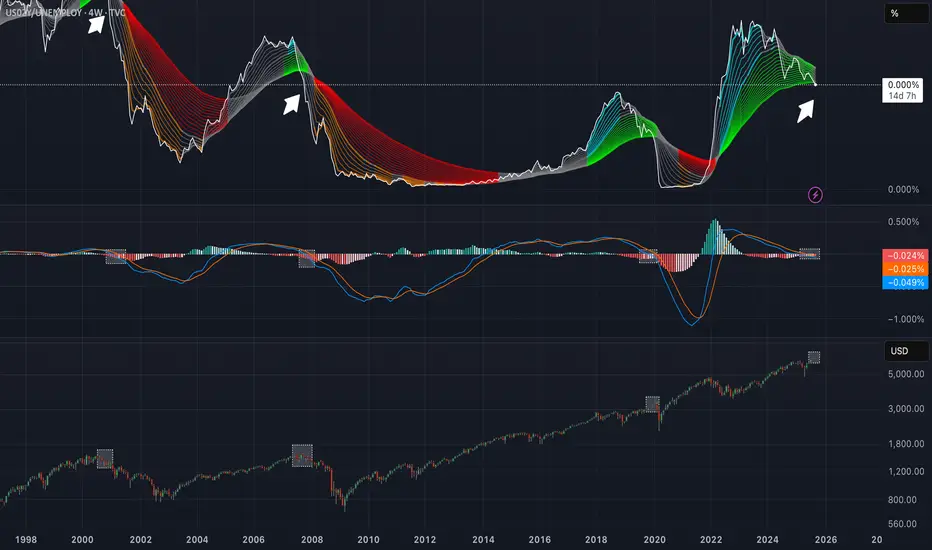
US Recession Imminent! WARNING!Bond traders are best when it comes to economics. Stock traders not so much.
As the chart shows, historically, when rates bunch up, what follows is a recession. During the recession, the economy tries to fix itself by fanning out the yield curve, marking it cheaper to borrow and boosting the economy.
The best time to be buying up stocks and going long the market is when the yield curve is uninverted and fanned out wide—not when it is bunched up like this.
My followers know this is my first warning of a recession since FEB. 2020.
WARNING! Things can get ugly from here very quickly!

Jobless Market boom!📉 Job Openings Are Nowhere Near Where They Should Be — and QQQ Is Laughing in Their Face
If you map the post-GFC job-growth trend from the 2009 bottom, we should be sitting at **11 million job openings** today. Even if you throw out the 2022 spike as a COVID distortion, we’re still at **just 7 million**.
That’s a **massive shortfall** — and nowhere close to a healthy labor market.
Meanwhile, QQQ has historically **tracked** job openings…
but this time it’s **completely detached** and gone **vertical** instead.
You can argue feelings, vibes, narratives, bar-stool opinions — but the **data** is screaming one thing:
**We are in a bubble.** Like it or not.
I can only show you the evidence. What you choose to do with it is your business.
But here’s my advice, blunt and simple: GTFO and STFO No Matter where prices go! . Nobody is forcing you to play hero at the top of a cycle, trying to cosplay Warren Buffett for a week.
Most of you are under 40.
Meaning you were maybe 20–23 years old during the last real recession and bear market.
You have *no idea* how fast you can lose money when the trend truly dies.
You’ve spent 17 straight years being trained to “Buy The Dip,”
as if markets only go one direction — up.
That’s not your fault…
But you’re about to learn what a real cycle feels like.
And it’ll be **sooner, not later.**
When the cracks appear, you’ll start doubling down…
rotating into new “opportunities”…
trying to pick bottoms…
revenge trading…
chasing cute stories…
Repeating the same lines every bull market teaches:
“Money on the sidelines,”
“This is the bottom.”
“It’s oversold,”
“Time to load up,”
“You have to be in for the bad to enjoy the good.”
All of it is designed to **soften your fear** and **trigger your greed** right before the trapdoor opens.
Stay sharp. The data doesn’t lie — people do.
Sorry, but it has to be said by somebody!
THANK YOU for getting me to 5,000 followers! 🙏🔥
Let’s keep climbing.
If you enjoy the work:
👉 Boost
👉 Follow
👉 Drop a solid comment
Let’s push it to 6,000 and keep building a community grounded in truth, not hype.

Gold/Oil Signaling Market Is In A Super Bubble Gold = Fear
Oil = how strong the economy is.
Except for COVID we have never seen such an extreme reading. Yet people are buying up stocks like we will never again be able to produce another stock again as long as we live!
Tulips!
Here are just a few of the factors to consider that make this indicator important.
Why This Indicator Matters: Key Factors at a Glance
Gold’s Surge Signals a Shift
Gold has soared nearly 60% year-to-date, adding a staggering $10 trillion in market capitalization. This rally effectively erases all the stock market gains made since May 2021, including those driven by AI enthusiasm and speculative tech runs.
USD Can Only Be Measured Against Gold
As the world’s reserve currency, the U.S. dollar’s real value is best gauged in terms of gold. This is a critical point—because when gold rises this dramatically, it reflects monetary inflation. A large part of the stock market rally has been driven by an expanding money supply, not true value creation.
Curiously, this inflation hasn’t shown up in oil prices, which have collapsed, despite geopolitical risks. More on that below.
The Dollar’s Worst Year in Decades
2025 marks one of the most significant declines for the U.S. dollar in recent history. Its role as the world reserve currency (WRC) has diminished—from 85% in the 1970s to just 50% today. Trade wars and tariffs are only accelerating this trend.
Monetary Inflation Drives Stock Prices
Stock markets are being lifted by monetary inflation, not organic growth. Stocks can be created endlessly—unlike gold. That makes gold a true inflation benchmark. The stock market’s rise is, in large part, a mirage, reflecting debased currency, not real productivity.
Oil Isn’t Behaving as Expected—Why?
Typically, when the dollar weakens, oil prices rise—because more dollars are needed to buy the same barrel of oil. But right now, oil prices are soft. Why?
Global demand is weak, outpaced by supply. Even the Russia-Ukraine war hasn’t changed that dynamic. In fact, Russia is now importing gasoline, as Ukrainian forces continue to target and disable refining capacity.
Here’s why this matters: when oil wells are opened, they can't just be turned off. If the refiners are destroyed and the oil has nowhere to go—it’s wasted. That’s a strategic win for Ukraine.
The Disconnect Between Stock Prices and Profits
While inflation has pushed stock prices higher, it hasn’t translated into equivalent profit growth.
Example: If a stock goes from $10 to $20 due to inflation, you'd expect earnings to go from $1 to $2 to maintain the same P/E ratio. Instead, the earnings yield is just 3.2%—a historical low. That’s a major red flag.
As pilots would say: WTF, over?
Here’s the likely explanation:
The money hasn’t reached consumers—it's concentrated in the hands of wealthy savers and leveraged investors, who are buying more stocks to sell to the next buyer willing to lever up even more. It’s a classic feedback loop—and a superbubble reminiscent of the tulip mania era.
The Smart Money Knows What's Coming
As this imbalance grows more obvious, central banks and institutional investors are quietly increasing their gold holdings—well above the pace of supply growth.
So when Gold/Oil (two important commodities) completely disconnect like this, and Gold explodes up like this, you'd better take notice!
Lastly, it takes 100 ounces to buy a new home. Last time this occurred was in 1978 ish, 2011, and now!
Debt to GDP in 76 was 33%, 2011 was 99% and today 126% It is not the same animal as the past.
GTFO & STFO! No matter where the prices for stocks go!
CAUTION!!!

Why is crypto dumping? Bitcoin, Ether, and other cryptocurrencies extended their losses on Monday, even as stocks traded mostly higher.
Bitcoin hovers near $106,980, down about 3% in 24 hours, while Ethereum fell roughly 7% to around $3,642. Most major altcoins mirrored the decline (but more pronounced), reflecting a broader pullback in market sentiment.
Investors may have turned cautious after U.S. Treasury Secretary Scott Bessent suggested that the Federal Reserve’s interest rate policy may have already pushed parts of the economy (particularly housing) into recession.

AUD/USD Longer term OutlookHey Guys,
This is a follow up the the Short Term outlook I posted to show you the bigger picture of what happening. If you haven't checked out that short term thesis I suggest you do to understand why i think in the near term why there will be a decline possibly down to .50.
As I'm sure most people are aware there is abit of fear on the longer term of the debasement of the USD, as we have massive debts and deficits which are highly unlikely to get any better soon. This is ultimately lead to its decline relative to other assets think current rise in GOLD. If we have a recession from slower growth from tariffs, regional banks and private credit going bad and the consumer becoming too squeezed then this budget with get much worse as they will try and stimulate the economy to ease some of these pressure. But as a consequence this will lead to inflation and more debasement just like the 60s - 80s period. Each time they try and rein in inflation growth will slow so they will simulate resulting in the cycle continuing.
Now if the "debasement" continues this doesn't mean the USD will die get replace but it does mean other assets and currencies that aren't having this systemic problem will rise relative to the dollar again just like the 1960s-1980s. Australia has had long running fiscal conservative budgets and most definitely no debasing its currency. Our debt to Nominal GDP peak during covid and unlike most other economies has decreased since. Although we are projected to runn a deficit of A$10 billion our growth will more then out weigh this and this is such a small fraction to out A$1.752 trillion economy is a non factor really.
looking at some technicals on the charts we can see we have been in a falling wedge since the last "debasement" of the USD happened after the GFC. This will breakout sometime over the next two years as its running out of room. we have gaining strength on the RSI creating a divergence on the monthly also point to a breakout to the upside. we have clear outlined targets to hit on the way up and looking back again at previous debasement events by 2011 we were at $1.10 and by the 1975 we were at $1.49 so a return to these levels isn't without precedence.
I have shown with the green line the general direction of where i think it will be please dont take that as an exact model. This will take years to fully play out but if you understand even the most basic supply and demand , technical analyst and fundamental problem America is facing then it should keep you true.
Please check out the shorter outlook to gain a full picture and do you own research
here are some links to data used
www.ceicdata.com
data.worldbank.org

USD/AUD Short Term OutlookHey guys, This is a thesis I've had for quite some time but seems to be unfolding of late. With the talks and worries about the regional banks in America and the private credit companies loan books not looking good as the consumer is being squeezed from tariffs, higher interest rates, unemployment slowly ticking up and student debts having to be paid back again after credit growth soared after covid i feel we could see a recession hit the US sometime over the next year. I doubt it will be a collapse anything like 2008 or anything but even a slow down on growth and a pull back on spending could lead to big declines from these AI bubble fueled highs as P/E have risen way out of hand. Something like the 2000s seems more accurate to current conditions.
IF this thesis is right you will see marked declines in the AUD against the USD and i have laid out my first target of .60 as it fits the technical pattern and we have a confluence of support there. We have also recently rejected off the resistance lines, broken the rising wedge (RED Lines), slipped back under the 100SMA. This provides a great enter point with a tight stop loss and a clear take profit.
I will be posting my future outlook for the AUD so please check it out to get the bigger picture
Also do your own research

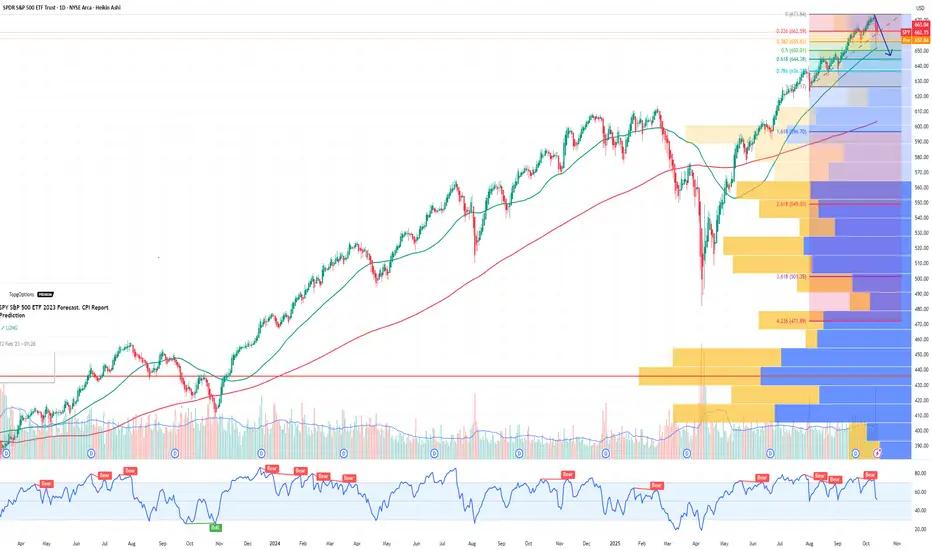
Warning Signs Flashing: SPY May Plunge After Earnings SeasonAfter the recent rollercoaster in equities and crypto, markets are entering a critical period: earnings season. While the initial rebound after last Friday’s selloff has restored some optimism, the broader picture suggests potential downside for SPY in the weeks ahead.
Earnings Season: A Stress Test for Stocks
The third-quarter earnings season kicks off with major banks and tech companies reporting this week. Expectations are high: analysts project around 8% EPS growth for S&P 500 constituents.
However, several factors indicate that this season could reveal underlying weaknesses:
High expectations and valuation pressure – Companies that fail to meet earnings or guidance could see outsized declines, creating ripple effects across the index.
Sectoral stress – Technology, finance, and industrials are exposed to higher input costs, slowing consumer demand, and margin compression. Misses in these sectors often drive SPY lower more than average.
Macro headwinds – High interest rates, slowing GDP growth, and trade tensions with China could exacerbate negative reactions.
Historically, SPY tends to be vulnerable after earnings seasons that reveal cracks in corporate performance, especially when macro uncertainty is elevated.
Geopolitical and Macroeconomic Pressures
Trade tensions: The U.S.-China conflict over rare earth metals and tariffs adds uncertainty to corporate supply chains. Even if earnings beat expectations, investor sentiment can remain fragile.
Recession risk: Economists from J.P. Morgan and S&P Global highlight a 30–40% chance of a U.S. recession by year-end 2025. Weak economic indicators can amplify post-earnings selloffs.
Volatility spikes: The VIX has started creeping higher after last week’s recovery, signaling that investors are hedging against downside risks. Historically, spikes in VIX correlate with short-term SPY declines.
Conclusion: Post-Earnings Risk for SPY
Traders and investors should watch for:
Missed earnings or cautious guidance from major banks and tech companies.
Rising VIX and fear-driven flows into protective options.
Breaks of critical technical support levels in SPY.
In this environment, positioning for a modest correction or increased volatility in SPY could be prudent until the earnings season clears and market sentiment stabilizes.
Oil/Bonds Just Flipped 5-year Support into ResistanceOil-to-bonds SR-flipped this 5-year support
US10Y not as neat and tidy, but close to the same and correlated

XPO Short - Economy is WeakLooking for XPO to pull back significantly.
There is only so much demand a given economy can generate, over the course of a given cycle.
While we have been in a recession (in earnest) since early 2023, the stock market is just now figuring out that demand is increasingly absent and inflation has been the primary driver of all price growth for about 3.5 years now.
I expect at least a 50% selloff, with the possibility that this market can go much much lower.
Moreover, while indexes continue to make new highs, the real economy is completely detached (hence the XPO chart).
Good luck and God bless!

UGLY! FNMA Collapse! We Are in a Recession!The recession began in earnest in late 2022.
Subsequently, in March 2023, Silicone Valley Bank was wiped out; the feds took over and now here we are on the other side of the expansionary cycle. As it currently stands, banks are still sitting on hundreds of billions in unrealized losses.
This can collapse faster than you can blink.
Dump 'em!

Farmers Have Been Losing Money for Years Grain is planted in the Spring and harvested in Autumn.
As shown farmers have been losing money for the past several years, buying grain in the spring and selling at a loss.
The entire ag industry is (was) propped up by land inflation, driven by the fantasy of "Yellowstone" cosplay.
Well, this sort of thing can only go on for so long before we run out of buyers.
Best of luck to all the John Duttons out there. "Soft Commodities" showing you are underwater.

Is there a chance of a 50 basis point cut? SPX traded to new all time highs today.
Many stocks had blow off move or breakout candles.
Market makers cleared out lots of short interest today.
The employment data is starting to get worse.
A new 2 year high in initial jobless claims.
Markets rallied on dollar and yields weakness.
At some point the markets will price in a recession. Growth stocks need to be monitored closely.
We took profits on Tesla & Baidu today.

Economic Tipping Point...GFC 2.0? In this video we discuss;
Bond Market Signal using the 2 year yield.
Is the 2 year yield giving us a 2007 / 2008 signal?
We look at the correlation of the 2 year yield vs SPX
We analyze the forward expectation of interest rate projections.
Observe and dissect last weeks economic employment data.
There will be plenty of opportunities in this next phase of the market cycle.
I will be looking very forward to the plethora of trade alerts I will be issuing.

Credit crunch about to explodeI strongly believe we are about to experience a recession in the coming months. Open some spy shorts posisitions for late 2026.
How to Manage Recession and Inflation?Can a recession and inflation coexist? We saw that in the 30s great depression and 70s great inflation.
Today's jobs numbers is trending lower, indicating a possible recession, while (3) inflation numbers are ticking up.
When these 2 conditions occur simultaneously, it is known as stagflation.
The 70s great inflation and today’s situation is very similar; we will study them. And discuss how to manage stagflation.
Micro Silver Futures
Ticker: SIL
Minimum fluctuation:
0.005 per troy ounce = $5.00
Disclaimer:
• What presented here is not a recommendation, please consult your licensed broker.
• Our mission is to create lateral thinking skills for every investor and trader, knowing when to take a calculated risk with market uncertainty and a bolder risk when opportunity arises.
CME Real-time Market Data help identify trading set-ups in real-time and express my market views. If you have futures in your trading portfolio, you can check out on CME Group data plans available that suit your trading needs www.tradingview.com
