Economy

will silver rise along with a drop in real rates?Real rates look like they are about to turn over.
This should mean that interest rates should drop faster than the inflation.
A good proxy for this is silver which looks like it is touching a support line and the 100 MMA.

Employment Level: Plenty of Room for GrowthEmployment level is not yet overheated which is bullish for risk-on assets. A repeat of the 1981-1982 recession a possibility but trading and investing has always been about probabilities, not possibilities. 6-17% increase in employment from now is far more likely. One is allowed to be a bear, but a bear right now is far more of a gambler than a bull is.

Inflation rate peaked? or retested?So I've been tracking this for a long time - already worrying was the fact that we crossed that all-time trendline - now we just retested it. Everybody is euphoric about Inflation possibly having peaked, I'm still concerned this is just a retest.

Measuring Wage Growth per Presidential TermCaveat - both negative and positive effects of presidencies tend to carry well beyond their terms, we tend to forget this when judging performance.
Link to related idea below - measuring stock market growth per term.

Connection US GDP and Bitcoin quarterly performanceBitcoin and Crypto Nation... eat this ‼️
Found an interesting connection of quarterly reported US GDP and the prediction of the following quarter performance of BTC - no joke - look at the chart ‼️
Kind of sentiment effect IMO
Thursday GDP increase expected - bullish Q3 for Bitcoin ??!!
Tell me your thoughts in that idea
*not financial advice
do your own research before investing

A Clear Signal of Economic ContractionUnemployment vs. Central Bank Tightening
We know there's a shifting of the tides. With unprecedented Monetary Policy to rescue the economy due to never before seen economic maladies. Dotcom, Housing Market Collapse, and now the C-19 Pandemic. We saw the Fed's policies fail during the Great Depression, could we continue to trust this policy to course correct an inherently broken system?
The simplest view of this is as an indicator of economic contraction preceding major Recessions. Now, combine this with yield curve inversions of both the 10 and 2-year yields, now, with a drastic move in the 3-month vs 10-year yield and we should be wary.

SP500 Trading AnalysisConsolidation 3780-4380
Green zone is the support level
Red zone is the resistance level
Subscribe and share

FED Fund Rate, US Bonds and Inflation PredictionThe blue line area shows the historic and current FED's Fund Rate.
Looking back in the past it appears the US10Y (yellow line) is predictive of FED's fund rate upper target (orange arrows).
The US3M (turquoise line) seems to be a good indicator to get a feeling for the FED's fund rate short-term up or downward trend.
In the FOMC Summary of Economic Projections Jun 15 '2022 the FOMC had the midpoint of target range or target level for the federal funds rate at around below 4%
2022: 3,39% midpoint, 2023: 3.78%, 2024: 3.01% and >2024: 2,24% (ghost feed in the red box on the right).
So all that noted it would appear the FED Funds rate is to be expected at just below 4% at around 3.8%.
The next FOMC meeting will give as an update on that from the perspective of the FED.
And as a general indicator you need to know the FED uses the 10 Year- 3 Month Treasury Yield Spread (white line) as follows:
The 10 Year- 3 Month Treasury Yield Spread is the difference between the 10 year treasury rate and the 3 month treasury rate.
This spread is widely used as a gauge to study the yield curve. A 10 year-3 month treasury spread that approaches 0 signifies a
"flattening" yield curve. Furthermore, a negative 10 year-3 month spread has historically been viewed as a precursor or
predictor of a recessionary period. The New York Fed uses the rate in a model to predict recessions 2 to 6 quarters ahead (white arrows).
--------------------------------------------------------------------------------------------------------
** Please support this idea with your likes and comments, it is the best way to keep it relevant and support me. **
--------------------------------------------------------------------------------------------------------
!! Donations via TradingView coins also help me a great deal at posting more free trading content and signals here !!
--------------------------------------------------------------------------------------------------------


ECONOMIC UNITED STATES GDP compared with Other NationsThis chart illustrates the GNP of the USA compared with others over a period
of several decades. The USA is on a much slower trajectory of growth than
all the other countries on the chart except Russia and Ukraine. This
includes the Eurozone, China, India, Mexico, and others. This trend
has been in place for decades. It makes for a poor prognosis for
the future of the US economically, no matter how much our politicians
and other influencers try to hide this.


A Bearish Call On Financial Markets and The Global Economy China/Europe/EM: The UK and the entirety of Europe are in trouble. The UK now experiencing double-digit inflation and to make matters worse they are facing extreme weather and an energy shortage going into the winter. All the while Putin's war is complicating European energy supply and political ties even further. China is experiencing civil unrest, mostly thanks to an ugly property crisis. China also is experiencing lower-than-expected GDP growth. China's economy slowing has large implications given its massive presence in global trade. Emerging markets are struggling partly due to an incredibly strong dollar as well as a tight global food/energy supply.
US: The US housing market is in a recession with 6 straight months of declining sales and more importantly a monthly decrease in median home prices for the first time in years (the housing market gets hit first by rising rates… remember 08?). US consumer credit I.e., debt levels, are through the roof. Signaling that the consumer might not be as strong as market commentators are saying. Layoffs are increasing steadily, while inflation is staying high. I am bothered to see the number of peak inflation calls after just ONE MONTH of zero gains in headline inflation. The FED is now in a lose-lose scenario where they can continue to aggressively tighten and bring down this wildly levered up global economy or back out and try to save the issue for a later date. The latter would cause additions to the size of their already immense balance sheet and create an ultra-severe recession later down the line. Either way, the recent rate hikes have not at all been fully felt by markets, and add on the possibility that the FED truly commits to QT, then a few quarters down the line we will start to see a serious weakening of market conditions across the board (equities, bonds, real estate, you name it).
Forecast: Risk assets globally are going to get decimated during the next several months of trading, especially low-quality speculative names. Crypto investors should prepare to see some nasty losses, BTC to 9800, and ETH to 575 seem attainable in the medium-term. S&P 500 will NOT make any substantial or sustainable gains over the 4300 mark, 3500 is my next low target. Nasdaq 100, like crypto, is in for a large selloff, next target: 10,200. VIX will rise substantially, and could easily double from current levels. The dollar will stay higher as US rates rally upward, likely well higher than markets currently have priced in. Some commodities will make new highs- nat gas- while others like oil are poised to depreciate modestly but remain historically high. Low/non-profitable, high debt companies- Wingstop and its zombie cohorts - are at high risk of bankruptcy in the coming quarters. Widespread bankruptcies are on the horizon. Things look a little too good to be true right now in financial markets… well that's because they are. On the bright side, this bear market bounce of the past 60ish days has provided a good opportunity to exit risk assets, load up on cash and begin to add on to short positions.
As always this is not financial advice. Good luck!

Current vs Future debt payments as percent of incomeThere appears to be a 2-3 year delay between the current debt rates (US) and actually debt payment increases. It seems very likely that debt payments as a percent of tax receipts will go up to 28% similar to 2019 and 2020. What happens after that. It seems unlikely to me that GDP will continue to feed increases in federal tax receipts. 30% and above is next.

Global Liquidity (in USD), a rough measureThis black barchart is the M2 of the largest central banks of the world (USA, China, Europe, Japan.), converted into USD (in Trillions), which is the world reserve currency.
So this is a rough expression for global liquidity, which can go and buy assets like stocks or bonds.
Any strong decrease in this Liquidity should sooner or later lead to a run for US Dollars to service the huge amount of "Eurodollar" debt aka global USD-denominated debt. Leading to asset markets finding themselves up in the air like Wiley Coyote.
In comparison it shows $SPY in orange. You can see how declines in liquidity can lead to stagnations in $SPY. In 2016 though the market seems to have front-ran the acceleration of supply of liquidity...
This chart is just an analysis on liquidity as an indicator, not a prediction on what to come next from here on...

Shiller US National Home Price IndexLog scale for reference. The latest data should update soon. Thank you for viewing. Jesus loves you.

BTC & SP 500 - who will spit the dummy first :)Well this are looking very good for the bears in a bear market... still a little room for the fake out move with your Stops set.
Not financial advice, just noob observation..

RRP the Fed's Soft Landing Tool for 2022?RRP unwind with raising rates could seem viable for a soft landing in the US equities markets and broader economy in 2022. Lots of major headwinds regardless.
Thanks for reviewing. Please let me know your thoughts. Just my personal thoughts and opinions, not financial advice or education. Cheers.

Crash Incoming 10? Be careful with data manipulation (regarding the recent job report), check the "Job Openings: Total Nonfarm" (blue Line) and its relation with the previous big crashes (S&P500; yellow line).
Check also the "Hires: Total Nonfarm" data: www.tradingview.com
Also watch this video: www.youtube.com
I hope that the markets recover soon, nevertheless, calculate very well the risk and the possibility of a major crash.

Purchase Power is tracked by oil!Like Gold & Silver, Crude Oil also tracks your purchasing power.
Hyper inflation not required, just time.
#fintwit #inflation #crudeoil #gold #silver

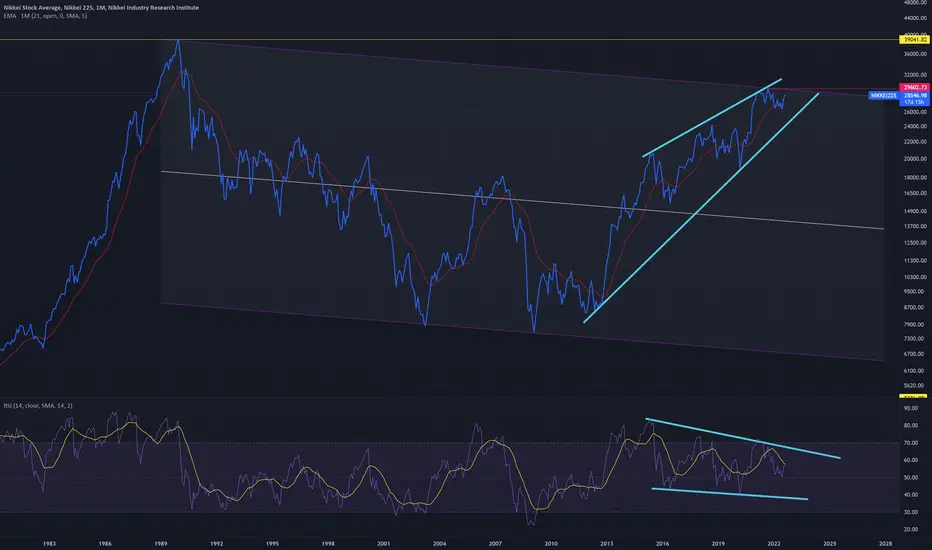
Nikkei225This chart of the Nikkei225 stock average shows that this market topped in 1989 and a parallel channel of a down trend that has recently encountered resistance. The question is whether the price can break above this level and resume the recent bull market or whether the continuation of this extremely long term down trend will happen.
Real disposable incomeThis chart shows some very unusual recent history of big spikes in real disposable income during the last few years followed by the present situation which looks like a severe downturn. It would perhaps explain recent inflation but also may point to a reversal of that coming soon.

10-2 Curve Yield Inversion is foreshadowing recession AMEX:SPY FRED:T10Y2Y Here is my DD on why I think we will officially enter recession early 2023. Current situation is identical to 2000 tech bubble.
Back then 10-2 curve yield inversion dropped to its lowest around Spring-Summer 2000. Then the official recession started Spring 2001. Market didn’t fully bottom until end of 2002/early 2003.
Fast forward to 2022, we’ve just reached the lowest 10-2 curve yield inversion since 2000. Meaning a few months from now we will officially be in recession, either end of 2022 or early 2023. Which I suspect could last until early 2024. Since U.S election is scheduled for Fall 2024, Fed and politicians will have to prop the economy back up so they can use “economy recovering” for voting narratives which is what can trigger the next real bull trend.
Conclusion: curve yield inversion has always been indicative of an upcoming recession, so the real bear market hasn’t even really begun yet. What we recently experience was most likely just a warmup👀
