Corporate profits correlation to stocksNot the most earth shattering observation but good to remember.
As profits fall, the stock markets follows.
A recent Band of America report shows record low profit expectations by global fund managers - lower than anytime in the last 25 years.
Economy

That's why the Fed needs to stop hiking before a system collapseThis is a quite interesting chart showing a ratio (black trend-line) of the Interest Rate, 5Y Yield and Federal Debt trading within a Megaphone pattern since the 1990s. Its (Higher) Highs have naturally coincided with peaks in Rate Hikes (red trend-line). The last peak was on October 2018 and currently the ratio just broke within that range again (red area).
This shows that the Fed is on a timer and has only limited time to act and stop hiking before they jeopardize collapsing a system that is in place for three decades now and brings balance to the market. The S&P500 (blue trend-line) has seen great periods of growth and stability systemically with this in place as long as the Fed doesn't go off limits with hiking.
Do you also think its time they act now and stop or at least ease this round of hiking before total collapse?
--------------------------------------------------------------------------------------------------------
Please like, subscribe and share your ideas and charts with the community!
--------------------------------------------------------------------------------------------------------

"recessions are launch pads for gold & silver"Producer Price Index versus Gross Domestic Income
The government & central bank playbooks to remedy recessions is THE rocket fuel for gold & silver.
#stagflation #inflation #gold #silver #fomc

Home-Builders DROP WORSE THAN 2008 - Canary in the Mine screamsLast Time The National Home Builders Index Dropped repeatedly - The 2008 Market CRASH and Deep Recession happened right after.
And Now It has Dropped Sharpest in its History.
The Canary is the Builder sentiment - Dropped to 55, a drop of 12 points.
This is the largest single-month drop ever, with one exception. The exception being April 2020. As you may recall, the world had decide to shut down at exactly that time.
Or is it the Scream of the Crashing Market ?

On inflation and interest rateswww.youtube.com
"The Inflation Genie Is Out of the Bottle", I'm still predicting a recession soon, but the the long-term trend for inflation and interest rates seems to have shifted or will shift soon.

USBOI and SPXThere appears to be a correlation between the U.S. NFIB Business Optimism Index (USBOI) and the S&P 500. When the Stochastic RSI of the USBOI was oversold to the 2.67 level, the S&P 500 tended to outperform thereafter. Interestingly enough, this signal is currently oversold at that level meaning the S&P 500 could rebound soon.

The Yield curve InversionThe Yield curve has inverted a second time this year, signaling the shift away from short term treasuries into longer term treasuries. This has always been the signal going into recession.

Consumer price index vs Producer price index!"PPI does the wake up, then CPI the melt up!"
Sustained inflation is baked in the cake.

US inflation, FED rate, housing price and S&P since 2007The indicators are not the same as they were in 2007 housing crises.. what could come out of this?

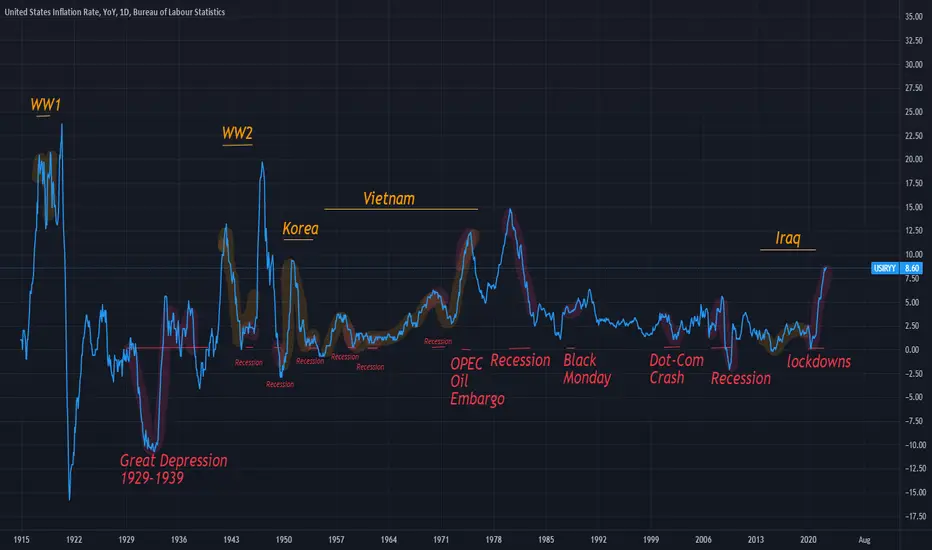
US Inflation RateThe US Inflation Rate Observers an Al-Time High Since the 1980s. Will the US Recover from this level any time soon? or are we yet to see another Higher High?

Inflation peak in 2025So you think we've hit peak inflation? In this new inflationary period, it seems that the 1065-day cycle between when the FED acts too late, and consumer prices peak, may be back in effect.

SHORT SP500. Possible Incoming Recession.- Yield curve inversion of US2Y being higher than US10Y. Biggest inversion since the year 2000. Since 1955, equities have peaked six times after the start of an inversion, and the economy has fallen into recession within seven to 24 months. (Fed Chicago)
- Yesterday release of US inflation data was a new high of 9.1%.
- Almost guaranteed that Fed will raise 75bps for the meeting at the end of July with the consideration of raising 100bps too.
- 'Alongside its actions to tighten monetary policy, which include shrinking its $9tn balance sheet, the Fed has stepped up its rhetoric about not only its “unconditional” commitment to lowering inflation, but also what it is willing to risk in terms of the economic recovery to do so.' (Ft.com, 14 Jul)
- SP500 might retest its 50DMA around 3900-4000. Stop loss and take profit levels are determined using Fibo.
- Downtrend would continue if it breaks 3666 downwards.
- Timeframe: 1-3 months

Interest rate ( DOLLAR )How high will the Federal Reserve ( FED ) raise interest rates? Here you can see how far. As you can see we still have a long way to go. We are on the verge of breaking a congestion of more than 40 years.
The minimum rate hike will be up to 5 points. And that is at least, because we could revisit levels not seen since the 80s. We are in serious trouble, the economy of all citizens will suffer a lot. It is time to be cautious in the markets and not to make hasty decisions, as we may still have a long way to go before we see the end.

FED pivot to printing money?the fed pivot indicator
We are at the point where the fed would usually halt rate hikes and begin easing again
As they gear up for 75bp in a couple weeks, they would be knowingly blowing up the system
This chart is essentially proxy for the acceleration rate of interest expense for the US government, and has been a reliable indicator of fed pivot for 30+ years as the fed has ensured the US doesn't enter a debt death spiral
what is a debt death spiral? It's an increasingly large debt load, with ongoing deficit, that only gets exponentially larger as interest expense increases
The treasury has to issue more bills/notes/bonds to fund interest which drives up supply and can overwhelm demand
thus increasing interest expense even more as yields increase and this spirals out of control, with the only way to make payments being issuing even more treasuries
For the past 33 years the fed has used monetary policy to ensure this spiral doesn't occur
To avoid this, the fed will need to pivot soon otherwise they risk having to do even more easing and monetizing of debt down the road
To keep this line 'inbounds' they need the middle of the curve to fall ~75bp between now and the 24th
Or maybe they'll allow a brief spike above, and given the length of that chart, maybe 'brief' can be a number of months
But as far as what would be normal fed behavior, we're at the tightening limit for interest rates
not my post or idea, but i want to keep a record of it. follow the OG poster @thehappyhawiian

Crash Incoming 4?I would like to give credit to the TradingView user 'jscheurichiv', who suggest me to add the US30Y mortgage rate to this serie of ideas titled "Crash Incoming". As in the previous 3 ideas, it seems to be a relation between the previous big 3 crashes with a strong line of resistance (in red in the chart). Should we assume that the recent 15% correction was that 'big crash'?

Real yield, DGS10-T10YIEcalculating real yield, DGS10-T10YIE
reference
fred.stlouisfed.org/series/DGS10
fred.stlouisfed.org/series/T10YIE

United States Inflation Rate Possible Top Coming In For Inflation In the U.S... RSI & MFI Are showing it and If it continues in the Parallel channel. While Also hitting a .618 on fib retracement

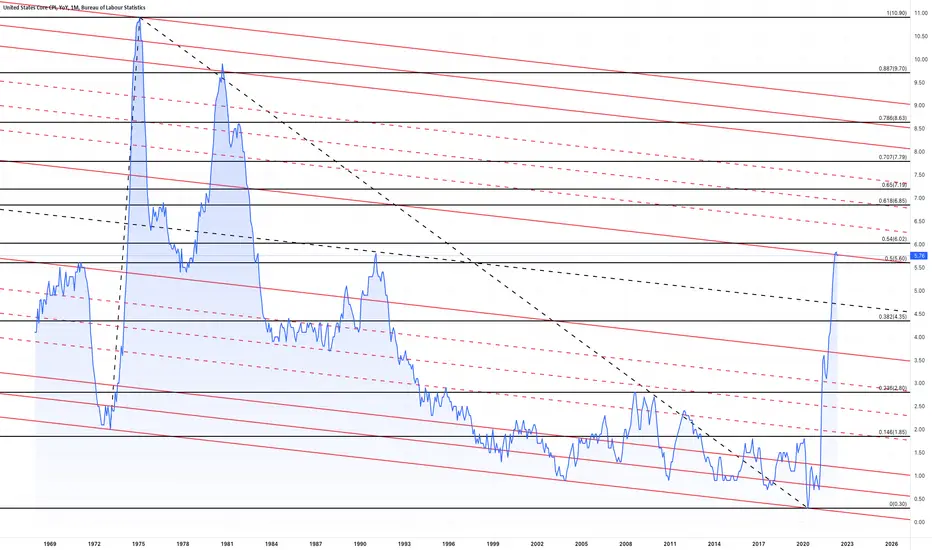
USCCPI * US CORE CPI consumer price indexUS CORE CPI consumer price index ::: Consumer price indices measure the average price change of all goods and services that are bought by households for consumption purposes. The Harmonised Indices of Consumer Prices are calculated monthly.
Downtrend in Fed Funds RateIt will be interesting to see if the Fed can buck this trend or if they will back off the rate hikes before a breakout occurs.
Don't mind the chart on the right, I did not intend to publish it, but it's not hurting anything so I left it there.

BTC vs the Dollar Inflation Rate :-)I thought this was an interesting chart Dollar Inflation vs Bitcoin BTC percentage different with the Bitcoin BTC price on top since the start of the pandemic. I used this Date Jan. 31, 2020 since it was short of a worldwide reset of the financial system. It appeared to give about a week notice before the BTC price collapse. I will follow this chart thru the next bull run to see if gives any earlier indicators or not.

Money supply by itself is also correlated to inflationDespite M2V and GDP having better correlations to inflation, money supply itself also has a correlation to inflation.

Money velocity is correlated to inflationMoney velocity after removing government expenditure is still correlated to inflation. It's not the current number, it's the rate of change. Recently, some on Twitter have stated low M2V means there is not a correlation between velocity and inflation; it's the rate of change.
