Recession Indicator New Orders vs Job OpeningsShowing the causation between new orders data and job opening data.
When new orders fall, new jobs fall.
RN, new orders have fallen. New jobs haven't fallen yet.
Economy

BTC vs the Dollar Inflation Rate :-)I thought this was an interesting chart Dollar Inflation vs Bitcoin BTC percentage different with the Bitcoin BTC price on top since the start of the pandemic. I used this Date Jan. 31, 2020 since it was short of a worldwide reset of the financial system. It appeared to give about a week notice before the BTC price collapse. I will follow this chart thru the next bull run to see if gives any earlier indicators or not.
Don't worry Deeper Network DPR Crypto i have not forgotten about you. Your just taking to long to play out your Bearish M Pattern and i am getting bored waiting..................................

Euro BullHello friends. We are bullish on the Euro. Let's get into why.
The charts shown are the EUR/USD chart (top), and European M2 Money Supply / US M2 Money Supply (bottom).
When the Euro peaked against the dollar at a price of 1 EUR = 1.60 USD, the supply of Euros had been rising dramatically against the supply of dollars, and this supply glut ended up leading to much lower prices for the Euro in the following years.
But now, the supply of the Euro is quite low when compared to the supply of the dollar. In fact, it's at an all time low. There are only 0.69 Euros for every Dollar in the world. If the market were priced purely based off of supply (it isn't, because demand is also a factor), we would see the price of the Euro currently at 1 EUR = 1.45 USD. Instead, the price is at 1 EUR = 1.01 USD, because as we just said demand is a factor. The demand for the dollar has been rising due to fear in the markets, and people have been selling every other currency, including their Euros, in order to get as many dollars as possible.
Our expectation is that the Euro will rise substantially over the next 10 years against the dollar to make up for the supply and demand difference.
Here's another fun observation: The global interest in the search term: "How to buy US dollars" reached it's all time high in May of 2021. Searches for "How to buy Euros" meanwhile are much lower. We think that this illustrates once again that it's not supply but rather demand that is causing these low prices for the Euro. Demand is fickle and can reverse in an instant, and this is what we expect will happen. Supply is more of a constant factor, since it takes many years to truly shift within most of these forex markets.
Supply of the Euro is low, supply of the Dollar is high. Demand for the Euro is low, demand for the Dollar is high. We expect that supply will stay the same, and demand will flip sides. If this is what happens, the Euro will rise VS the dollar.
Thanks for playing.
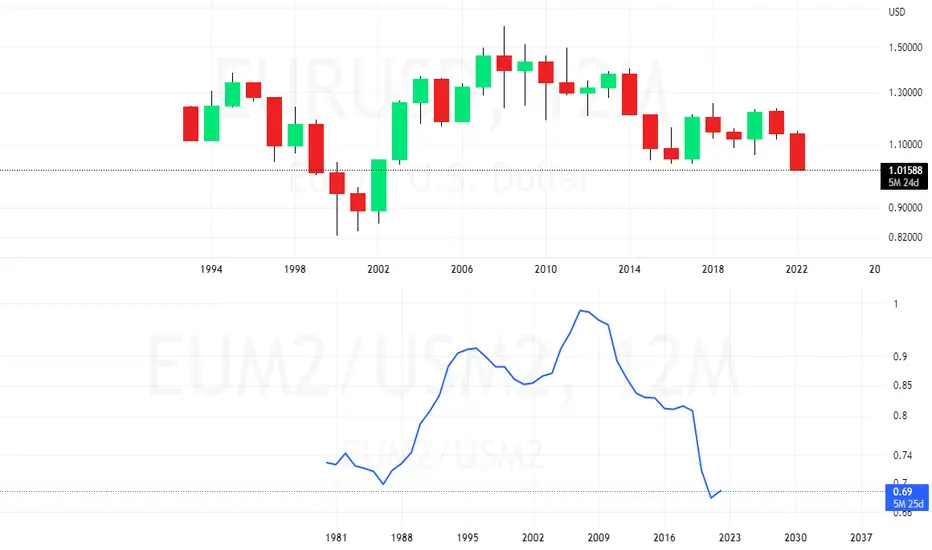
Chart showing that Personal Income doesn't lead sentimentChart showing that Personal Income doesn't lead consumer sentiment
Green is income. Red is sentiment.

Unemployment is inevitable part 2INVERTED GRAPH
Unemployment rates in black.
INVERTED Michigan consumer index in blue.
As consumer sentiment falls, unemployment rises.
Every.
Time.
The consumer index just fell to all-time lows.
Unemployment hasn't risen.
Either we have done something completely unique in the history of the stock market redefining how modern economics work...
Or there's a lot of unemployment coming.

No more Steroids ..!Many of you may hear this many times in the past 2 years:
The stock market is on steroids..!
What does it mean?
To answer this question you must know the definition of Money Supply and How FED play with this powerful tool!
Monetary policy:
refers to the strategies employed by a nation’s central bank with regard to the amount of money circulating in the economy, and what that money is worth. While the ultimate objective of monetary policy is to achieve long-term economic growth, central banks may have different stated goals toward this end. In the U.S., the Federal Reserve’s monetary policy goals are to promote maximum employment, stable prices, and moderate long-term interest rates. (Investopedia)
When the economy overheats central banks raise interest rates and take other contractionary measures to slow things down - this can discourage investment and depress asset prices.
During a recession, on the other hand, the central bank lowers rates and adds money and liquidity to the economy - stimulating investment and consumption, and having a generally positive impact on asset prices. (Investopedia)
Restrictive Monetary Policy(QT)
Raising rates makes borrowing more expensive, put a damper on rapid growth to keep it in check.
Assets perform in this type of environment:
- Equities, Bonds, Real Estate, and Commodities: Underperform
- Cash tends to do well
www.investopedia.com
What Is M2?
M2 is a calculation of the money supply that includes all elements of M1 as well as "near money." M1 includes cash and checking deposits, while near money refers to savings deposits, money market securities, and other time deposits (in amounts less than $100,000). These assets are less liquid than M1 and not as suitable as exchange mediums, but they can be quickly converted into cash or checking deposits.
M2 is closely watched as an indicator of money supply and future inflation, and as a target of central bank monetary policy.
(Investopedia)
www.investopedia.com
Federal Reserve:
M1 consists of (1) currency outside the U.S. Treasury, Federal Reserve Banks, and the vaults of depository institutions; (2) demand deposits at commercial banks (excluding those amounts held by depository institutions, the U.S. government, and foreign banks and official institutions) less cash items in the process of collection and Federal Reserve float; and (3) other liquid deposits, consisting of other checkable deposits (or OCDs, which comprise negotiable order of withdrawal, or NOW, and automatic transfer service, or ATS, accounts at depository institutions, share draft accounts at credit unions, and demand deposits at thrift institutions) and savings deposits (including money market deposit accounts). Seasonally adjusted M1 is constructed by summing currency, demand deposits, and other liquid deposits, each seasonally adjusted separately.
M2 consists of M1 plus (1) small-denomination time deposits (time deposits in amounts of less than $100,000) less individual retirement account (IRA) and Keogh balances at depository institutions, and (2) balances in retail money market funds (MMFs) less IRA and Keogh balances at MMFs. Seasonally adjusted M2 is constructed by summing small-denomination time deposits and retail MMFs, each seasonally adjusted separately, and adding the result to seasonally adjusted M1.
www.federalreserve.gov
Best,
Dr . Moshkelgosha M.D
DISCLAIMER
I’m not a certified financial planner/advisor, a certified financial analyst, an economist, a CPA, an accountant, or a lawyer. I’m not a finance professional through formal education. The contents on this site are for informational purposes only and do not constitute financial, accounting, or legal advice. I can’t promise that the information shared on my posts is appropriate for you or anyone else. By using this site, you agree to hold me harmless from any ramifications, financial or otherwise, that occur to you as a result of acting on information found on this site.

Euro Area Lending Rate Minus Fed Fund RateWhy hold Euros when the overnight lending rate is less than the US Dollars?
When the Fed stops the hikes & reverses, the Euro will have a chance to rise once again.
This has also marked important turning points for gold.
#gold #eurusd #dxy

Consumer Sentiment's Role in Long-Term Buying Opportunities Consumer Sentiment is just one tool for investors to use when choosing whether to buy, sell, add, or trim stocks. But it can be a very useful tool, especially when markets are heavily skewed in one direction as they appear to be today.
There have only been four (the three breaches during the 08 crisis I count as one) occurrences in the past when the U.S. consumer sentiment has dipped below the 57.40 mark. As we are currently quickly approaching 57.40 I have taken the liberty to map out the five-year returns of each of the four previous lows in consumer sentiment (assuming a buy-in during the month of the 57.40 breaches).
11/1974: 43.6% five-year return
04/1980: 76.02% five-year return
06/2008: 16.31% five-year return
11/2008: 81.33% five-year return
02/2009: 116.35% five year return
08/2011: 58.77% five-year return
Average nominal five-year return on the S&P500 since 1957: roughly 53%
Importance of these data? The takeaway here is that historically low consumer sentiment (sub 57.40) has in the past provided great opportunities for patient investors to enter long-term positions in stocks and yield abnormally high returns. Basing an investment decision on one economic metric is not an intelligent strategy, but using consumer sentiment to help time your buying position appears to be an effective method going off of historic price action.

US Inflation.US inflation is very correlated with the extreme rallies we have seen in US stocks, Oil and crypto, FED are increasing rates frequently to counter this abnormal levels inflation show as the bar graph in my chart, one thing that is going to directly affect asset prices is rates, the dollar should look to gain strength too. So increased Inflation will see rising asset prices, and a falling inflation should drop asset prices from their highs. FED are beginning to try tackle the major inflation seen in the US, and the market conditions are going to change, so be prepared and manage your risk very safely, these coming market conditions are going to be a tough sea in my opinion.

10 Year Treasury Elliott Wave Analysis10 Year Treasury Elliott Wave Analysis. The Big question here, is Wave (A) actually Wave (1) ?

Did Biden cause inflation through QE?Many people think that Biden engaged in the QE that is leading to inflation.
This is simply false.

M2 Supply Total Money Supply from February 1st 2020 to March 1st 2022
Increase of 41% of total money supply

US Inflation is Nearing a Harmonic PeakIf we are to base our views of this chart like we would any other price chart, the harmonics we see forming here would imply that US Inflation is reaching a peak and that we will see Inflation come down signfiicantly over the the coming years. If i were to give a target i'd say we'd wanna see it come down to atlest 3% as a first target but it could go down even more depending on how tight things get.
The smaller harmonic is a Bearish Butterfly with a reversal zone between the 1.272 and 1.618 and the bigger one if we get that high is a Bearish Shark. Ideally we'd like to see the Butterfly playout and us not to have to go as high as the Shark.

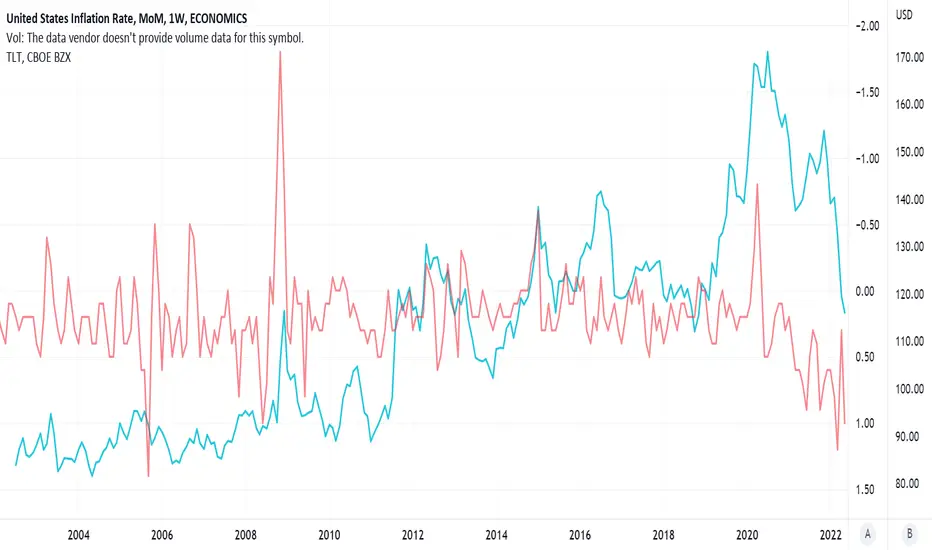
Inverted TLT compared to month-over-month inflation rate in U.S.Pretty clear that TLT trades opposite inflation.
The governments and central banks of the world are all trying to kill inflation.
Comparison of German and US month over month inflation rates.Comparison of German and US month over month inflation rates. Germany's data came out ahead of our PCE number tomorrow so looking for correlations here.

🔥 Has Inflation Peaked? A Century Old Trend Suggests YesWith inflation rising, the FED is applying quantitative tightening to the US market and the Dollar, which has caused chaos in the market of 2022. The market fears that the FED is not doing enough to combat this inflation, which will cause higher inflation, which will eventually cause further chaos in the markets.
However, looking at the chart it seems that inflation is currently at a massive "resistance" which has developed over the last 100 years or so. If inflation were to adhere to the trend, we can assume that inflation has peaked and will move down from here onwards, which would result in much better (bullish) market conditions.
I'm aware that applying TA on fundamental data like inflation is generally speculative at best. I think that inflation will rise further as long as the FED is unable (or unwilling) to rise the interest rates further.
Nevertheless, I think this analysis can shed a different light on on the most important piece of data of 2022.
Time will tell.
Do you think think inflation has peaked? Share your thoughts in the comments.

Comparing SPX performance vs ISM Manufacturing IndexIt is interesting to note that there is a current clear divergence between the SPX and the ISM Manufacturing Index, that started back in January 2019 when the Fed stopped raising rates. The SPX has shot higher, while the ISM has continued to drop crossing below 50 and therefore indicating a contraction. In the past this drop below 50 has lead to a stock market selloff. Maybe the economy isn't as great as some people make it out to be?

Case-ShillerYOY% and BTCUSD are Correlated = Danger for BTCUSDThis bodes ill for BTCUSD at a time when housing prices and rent are a national policy priority

Consumer Credit - The Impending CollpaseConsumers are spent.
Mean
Median
Spent
_______________________
Observe CC closely as it is a leading Economic Indicator.

FED Balance Sheet - Ex-Shadow Operations / Ex- FASB 56Run-Off...
The only thing running is Bids for MBS and USTs.
After an aggressive May 25th, $51 Sell ahead of
the June 15th Taper was stopped dead in its tracks.
____________________________________________
Imagine swimming in the middle of the vast Pacific Ocean.
Bumping into Flotsom and Jetsom every so often.
It's lonely out there...
Nowhere to run.
Paddle?
You'd need a Lifeboat.
It Sunk.

Savings Rate - Free Falling - 90% CollapseWhois gonna buy all those Model Y's, iPhone 14's/13''s/11's, and assorted GPUs for strip mining Klepto Coins?
Apparently - far fewer now.
A 90% collapse in the Personal Savings Rate...
Not Bullish.
_____________________________________________________________________________________________
Consumer Credit expansion is Historic.

sp500 predictor ?so in blue USM2 / USUP * 10y2y / NQCICBER
in orange the sp500 , my suscription give just this short historic , so what do you see in the past please ?

