Hyperinflation & DictatorsI cannot make this any simpler.
🚨 I AM ISSUING A WARNING TO EVERYONE!
Should Trump succeed in taking over the FED, the outcome is already known. What is not known is the SEVERITY. FAFO!
Here is how it works:
1️⃣ Political pressure replaces economic reality
When leaders can’t win within the system, they change the system.
Common moves:
Undermine central-bank independence
Fire or sideline technocrats
Declare that “rates are too high” or “money is too tight”
This happened in:
Argentina
Lebanon
Sri Lanka
Pakistan
Turkey
Venezuela
Zimbabwe
Russia.
Different excuses. Same motive.
2️⃣ FED Monetary discipline is framed as “The Enemy”
Raising rates?
Protecting the currency?
Controlling deficits?
Rebranded as:
“Anti-growth”
“Western ideology”
“Sabotage”
“Austerity”
Once price stability becomes political, it’s already over.
3️⃣ Spending continues — funding doesn’t
Here’s the fatal step:
Governments keep spending
Tax capacity doesn’t grow
Borrowing gets harder
So pressure shifts to the currency system
This is where reality kicks in:
You can print currency.
You can’t print trust.
4️⃣ Markets respond instantly (and mercilessly)
Markets don’t argue ideology. They just reprice risk.
What happens next:
Bonds sell off
Currency weakens
Import prices surge
Inflation feeds on itself
At this point, rate hikes don’t “cause” inflation — they’re a late reaction to lost credibility.
5️⃣ Hyperinflation isn’t a surprise — it’s the end stage
Hyperinflation is not:
A policy mistake
Bad luck
“External shocks”
It’s the logical conclusion of:
Political control → monetary submission → currency collapse
Every country on that list followed this arc. No exceptions.
The uncomfortable truth
Countries don’t collapse because they raise rates.
They collapse because they refuse to accept limits.
Markets respond with inflation — not theory.
If you enjoy the work, drop a solid comment
Let’s push it to 6,000 and keep building a community grounded in raw truth, not hype.
Bonds

Bullish RatesWatch Out if the the 10Y closes above 4.30.
I would start getting very bearish on equities if this happens.
Price action on yields here indicated higher long term rates.
It is currently setting up as if the tax protest will happen.
The wave count here is just a suggestion for this outcome. Long-term rates could spike one final time before the Fed panics. This also lines up with the 10Y minus 2Y yield curve uninverting. The uninversion has started, but typically it will shoot up before downturns and that would happen if this continues.

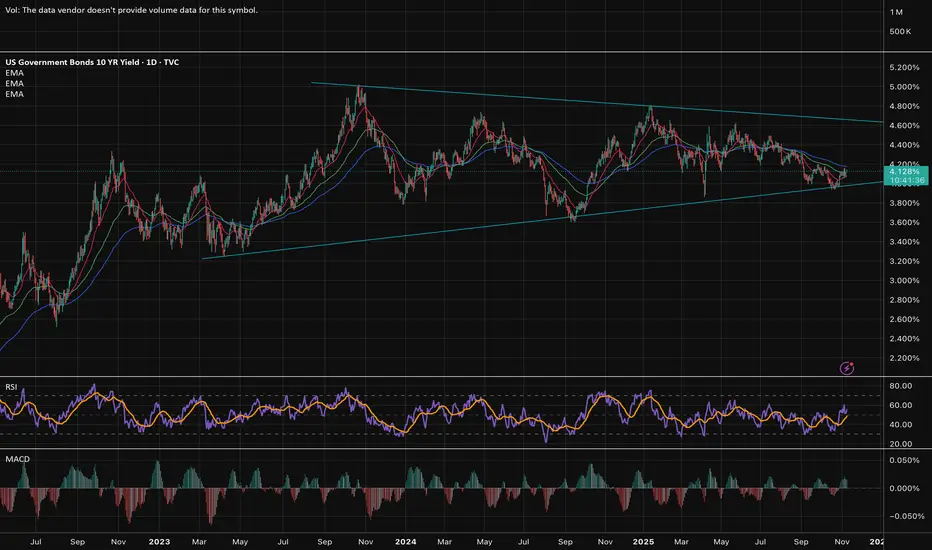
US10Y Expected rising yields can turn stocks bearish in 2026.The U.S. Government Bonds 10YR Yield (US10Y) has been consolidating since 2023 within a Triangle pattern, while the stock markets had one of their strongest Bull Cycles in recent history. Before than in 2022, the US10Y rose aggressively, while stocks took the opposite turn, having a Bear Cycle.
With the US10Y under a Higher Highs uptrend since 2017, while also turning its multi-decade Resistance of the 1M MA200 (orange trend-line) into Support, the long-term trend has long shifted to bullish. And as the market approaches the 1M MA50 (blue trend-line)for the first time since March 2022, it will be tested as the trend's Support.
As long as it holds, we expect the US10Y to start another yearly rally, potentially causing a new Bear Cycle on the stock markets.
---
** Please LIKE 👍, FOLLOW ✅, SHARE 🙌 and COMMENT ✍ if you enjoy this idea! Also share your ideas and charts in the comments section below! This is best way to keep it relevant, support us, keep the content here free and allow the idea to reach as many people as possible. **
---
💸💸💸💸💸💸
👇 👇 👇 👇 👇 👇

CREDIT CRISISWe are beginning to see evidence of a credit crisis starting. low demand for US bonds can trigger a currency crisis for the USD, higher rates will lead to refinancing company problems (especially with all the zombie companies that should have blown up over a decade ago.) and major economic depression-style job losses.
Currently, we are very early stages but things are moving at lightning speed on a macroeconomic level.
I know this is likely gibberish to most here pon trading view but it is of MASSIVE importance to your trading and investing.
CAUTION IS IN ORDER!!
Click boost, follow, and subscribe! I can help you navigate these crazy times.

US 30-year yields hit post FOMC highUh-oh. This is not what you would have expected to see if the Fed was perceived to be more dovish than expected. Also 10y yields show similar price action. Suggests rates will remain high for longer. Possibly a bearish factor for tech stocks. Keep an eye on 30y yields to see if they will break the trend line. Could trigger a bit of vol into year end if it does.
By Fawad Razaqzada, market analyst with FOREX.com

How US03M Are Front‑Running the Next Fed Cut The link between bonds and rates
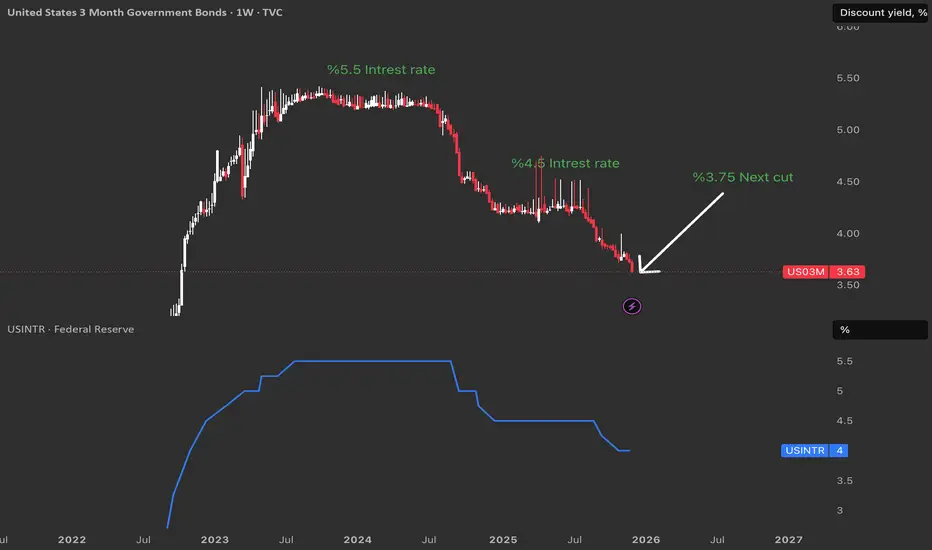
The US03M tracks the yield investors demand to lend to the U.S. government for three months, and this yield moves closely with the Federal Funds Rate set by the Fed.
When the Fed hikes, short‑term Treasury yields usually rise toward the new policy rate, and when markets expect cuts, these same yields start dropping before the official decision.
Why US03M front‑runs the Fed 🕒
US03M is a pure play on near‑term monetary policy, so traders price in where they think the Fed Funds Rate will be over the next quarter, not where it is today.
As a result, sharp declines in US03M while the official Fed rate is still flat often signal that fixed‑income markets are betting on upcoming rate cuts.
Why a 25 bps cut is likely 🎯
With US03M hovering roughly a quarter of a percent under the current effective policy rate area shown on the chart, the bond market is effectively voting for at least a 25 bps reduction at the next meaningful decision.
If the Fed cuts by 25 bps, US03M is already priced for that move, so the bigger reaction will come only if the Fed surprises with either a larger cut or no cut at all, giving traders a clear benchmark for risk positioning.
US10Y - move downAt the end of October 2023, we finished the upward move and entered a correction phase.
The higher-level corrections are coming to an end, and in the medium term a deeper move downward is expected.
For a short period, we may still see some upside (or fluctuations) within the correction, but compared to the main move, it will be insignificant.
The reference level is around 2,770 .
---
Please subscribe and leave a comment.
You’ll get new information faster than anyone else.
Together, we’ll grow and become wealthier.
---

Telegram Bonds - A Pre-IPO OpportunityBond Structure
Telegram has two outstanding bond issues. The first , maturing on March 22, 2026, trades at around 100% of par with a 7% coupon. The second, maturing on June 5, 2030, has a 9% coupon and trades at 104-105% of par, yielding approximately 7.7% to maturity. The total volume of the second issue is $1.7 billion, with $954.6 million from exchanging old bonds and $745.4 million in new cash raised. Such structure reduced overall debt while attracting fresh capital.
Importantly, these bonds include a conversion feature: in the event of an IPO before 2030, bondholders can convert into shares at a 20% discount to the IPO price, with full allocation (100% lock-up potential).
Messenger Market Landscape in 2024-2025
The messaging app sector is dominated by a few giants. WhatsApp leads with 3 billion monthly active users (MAU) and is part of Meta, valued at $1.545 trillion overall. WeChat, with 1.3-1.45 billion MAU, is embedded in Tencent, making standalone valuation challenging. Snapchat, the only publicly traded pure-play messenger, has 943 million MAU and 477 million daily active users (DAU), with a market cap of around $13.2 billion (as of December 2025), revenue of $5.36 billion, and EBITDA of $509 million, though net profit remains negative. Telegram ranks third globally, with 1 billion MAU, while analysts estimate 450 million DAU. Revenue is approximately ≈$1-1.4 billion (based on minimum estimates), with profits of around $540 million in 2024. It’s also worth mentioning smaller players such as Line and KakaoTalk.
Comparative Valuation
To estimate Telegram's capitalization, we draw on multiples derived from Snapchat as a benchmark, where the market cap per MAU stands at approximately $14 per user and per DAU at $28 per active user, while the ratios to revenue and EBITDA are 2.5x and 26.5x, respectively. Applying these metrics to Telegram's figures results in a valuation of $12-14 billion based on MAU and DAU, $2.5 billion when considering revenue, and approximately $14.3 billion using EBITDA. Overall, this points to a core valuation range of $12-14 billion, marking a notable downward adjustment from the earlier $50 billion estimate, largely influenced by Snapchat's own stock performance decline and broader market corrections.
Impact of the TON Ecosystem
The TON (The Open Network) ecosystem adds substantial potential value to Telegram, even though it operates as a formally separate entity. TON encompasses a native token with a current capitalization of around $3.8 billion at a price of approximately $1.5, along with an integrated wallet offering both custodial and non-custodial modes, and proof-of-stake staking mechanisms. Key revenue sources stem from wallet fees, dApp payments, staking yields, and indirect monetization avenues such as advertising. Valuation estimates for TON's contribution to Telegram vary widely depending on the scenario: in a conservative outlook, it generates $23 million in annual income, adding $329 million to the overall valuation; the base case assumes $455 million annually, contributing $6.5 billion; and an optimistic projection sees $2.275 billion in yearly income, boosting the value by $32.5 billion. Under the base scenario, TON could therefore elevate Telegram's total valuation by $6.5 billion, resulting in an adjusted estimate of $18.5-20.5 billion.
Overall Valuation Estimate
By combining the comparative metrics with the potential uplift from TON's contribution, Telegram's realistic capitalization emerges as $12-14 billion in a conservative view, potentially climbing to $18-20 billion in the base case or reaching up to $40 billion in an optimistic framework. Estimates from other analysts span from $15 billion to $40 billion, which aligns closely with this range, and the variations primarily arise from differing assumptions regarding monetization strategies, growth trajectories, and associated risks.
Investment Scenarios
Investing in Telegram bonds presents multiple potential outcomes for investors. One straightforward path is to hold the bonds for their dollar-denominated yield of 6.5-7%, supported by a profitable issuer that has consistently made timely payments over the years. Additionally, as U.S. dollar interest rates decline, the bonds themselves may appreciate in price, thereby improving overall returns. The most compelling scenario, however, involves an IPO, where bondholders have the option to convert their holdings at a 20% discount to the IPO price, benefiting from full allocation and the potential for substantial upside. For instance, a $100,000 bond investment would equate to $100,000 worth of shares priced at the IPO level minus the 20% discount. Although no specific IPO plans have been announced, making the timing uncertain, market conditions around 2027 could create favorable opportunities for such listings amid increased liquidity.
Risks and Considerations
Several risks warrant careful consideration when evaluating this opportunity, starting with regulatory hurdles that have already led to Telegram being blocked in regions such as China or Vietnam, which could constrain its growth prospects. In contrast to competitors like WhatsApp or WeChat, Telegram does not have deep-rooted connections to major markets, amplifying this vulnerability. Financial opacity poses another notable issue, as the revenue and profit numbers reported by founder Pavel Durov remain unaudited and self-declared, prompting skepticism among analysts. The company's lean structure, with only 30-50 in-house employees supplemented by outsourcers, highlights operational efficiency but could limit its ability to pursue robust development in various areas. Ownership complexities further complicate matters, given Telegram's registrations in offshore locations like the British Virgin Islands and Dubai, where structures are deliberately opaque to shield the team from legal risks but inadvertently introduce uncertainty for investors. TON's inherent volatility is also a factor, as the token has experienced price drops in line with broader crypto market slumps, and while its symbiosis with Telegram offers benefits, full integration and sustained value are not assured. Lastly, broader market and execution risks mean that any IPO valuation might deviate from current projections, and potential lock-up periods on converted shares could apply, with specifics outlined in the bond prospectus.

Watch Japan's bond marketsThe recent selling in Japanese bonds caused all sorts of volatility in the prior couple of weeks with equities and the yen both dropping on mounting concerns about Japan’s fiscal position. That was before the relative calm this week, where the selling of JGBs paused and yields held steady. But this could be a temporary respite. Elevated inflation means the pressure is growing on the Bank of Japan to normalise its policy, while the government under the new Prime Minister Takaishi Sanae aims to spending a whopping 21.3 trillion yen in fiscal package, financed by yet more issuance of debt. This is worrying some investors who are concerns that increased spending by the government could strain Japan’s finances. Indeed, according Japan’s Ministry of Finance data, foreign investors sold Japanese bonds last week to the tune of 956.5 billion yen, their largest weekly net sale since October 25. Should the bond market rout continues, this will push up Japanese yields and borrowing costs for the government and raise serious concerns about Japanese assets, and potentially trigger a reverse carry trade that could hurt global markets.
By Fawad Razaqzada, market analyst with FOREX.com

TLT long-term TA20+ Treasury bond looks somewhat very interesting for the last couple of months, the accumulation has been steadily increasing since September, currently mid-term is in a small distribution but nothing serious yet, it rather looks promising for an uptrend in the near future, and as you should know - strong TLT is not good for risky assets growth, it's something you should keep an eye on.

TLT - A long-term outlookIf price is moving up, we look for support structure, which in this case is a Real Swing Low (RSL).
An RSL is confirmed when the most recent Real Swing High (RSH) is broken.
What we’re seeing here is the beginning of a stair-step move to the upside, including short-term support.
Even the CIB has been broken, which suggests that a shift in market behavior is underway.
Our statistical probability of hitting the centerline is roughly 80%. That implies we can look for a longer-term play in TLT.
However, keep a close eye on the 1/4 line. It isn’t exactly friendly, as the rejections we’ve seen so far make clear.
I probably go with ITM LEAP options with a
Delta of around 70–80 and a over 120 DTE.
Happy profits, and for those in the U.S., wishing you a happy Thanksgiving.

Will SPX Make New All Time Highs? We dive into the recent technical setup of the S&P500.
We are on the verge of triggering a new massive bullish patterns.
The backdrop of soft commodities. soft yields, softer dollar and the December 10 rate cute.
We have the tailwinds in place for higher price.
I would like to see some sideways chop to make this rally more sustainable, but bull market bounces are very fierce especially when they come from failed bearish patterns.

US Recession Imminent! WARNING!Bond traders are best when it comes to economics. Stock traders not so much.
As the chart shows, historically, when rates bunch up, what follows is a recession. During the recession, the economy tries to fix itself by fanning out the yield curve, marking it cheaper to borrow and boosting the economy.
The best time to be buying up stocks and going long the market is when the yield curve is uninverted and fanned out wide—not when it is bunched up like this.
My followers know this is my first warning of a recession since FEB. 2020.
WARNING! Things can get ugly from here very quickly!

US10YThe market still can't figure out what to make of COVID. Continuing to coin in this 3 year long consolidation phase.
US10Y This break-out can be the next Buy Signal.The U.S. Government Bonds 10YR Yield (US10Y) has been trading within a long-term Triangle pattern and more recently since May 22 2025 it has found itself declining inside a Channel Down.
This Bearish Leg (Channel Down) almost hit the bottom of the Triangle and has been rebounding in the past 10 days. As long as the 1W MA200 (orange trend-line) holds (right now almost at the bottom of the Triangle), the probabilities of a rebound and new Bullish Leg remain strong.
The confirmation for such Bullish Leg will come after the price closes a 1D candle above the 1D MA50 (blue trend-line). If it does, we an expect the price to rise to at least the 0.786 Fibonacci retracement level (Target 4.475%), which has happened all times (3) inside this Triangle after a Bearish Leg bottomed.
-------------------------------------------------------------------------------
** Please LIKE 👍, FOLLOW ✅, SHARE 🙌 and COMMENT ✍ if you enjoy this idea! Also share your ideas and charts in the comments section below! This is best way to keep it relevant, support us, keep the content here free and allow the idea to reach as many people as possible. **
-------------------------------------------------------------------------------
💸💸💸💸💸💸
👇 👇 👇 👇 👇 👇

Stock Market New Highs on CPI? Lotto call option? Tomorrow is the CPI report.
Inflation headline number is expected to be 3.1%.
We will likely see a positive reaction tomorrow which should send the S&P500 to new all time highs.
If we gap up into new all time highs be very careful as this usually gets sold into.
We took a lotto call option on NASDAQ:CRML with members.
This is a pure speculative dead cat bounce play.

Investing in Bonds in the Global MarketIntroduction
In the ever-evolving landscape of global finance, bonds remain one of the most stable and reliable investment instruments. While equity markets often capture headlines with their volatility and potential for massive returns, the bond market — valued at over $130 trillion globally — forms the bedrock of the world’s financial system. Bonds provide essential capital for governments and corporations while offering investors predictable income streams and portfolio diversification.
Investing in bonds in the global market involves understanding the different types of bonds available, their risk-return characteristics, how interest rate movements influence them, and the factors shaping the global fixed-income environment. This essay explores the nature of global bond investing, its benefits, challenges, strategies, and the evolving dynamics in an interconnected global economy.
1. Understanding Bonds and Their Global Role
A bond is a debt security issued by a borrower — typically a government, municipality, or corporation — to raise funds from investors. In exchange, the issuer agrees to pay periodic interest (known as the coupon) and return the principal on maturity. In essence, bond investors are lenders rather than owners, unlike equity investors who hold a stake in a company.
The global bond market is divided broadly into:
Sovereign Bonds – Issued by national governments (e.g., U.S. Treasuries, German Bunds, Japanese Government Bonds).
Corporate Bonds – Issued by private or public corporations to finance operations or expansions.
Municipal Bonds – Issued by states, cities, or other local governments (mostly in the U.S.).
Supranational Bonds – Issued by international institutions like the World Bank or the European Investment Bank.
Global investors allocate funds to these instruments across various geographies to diversify risk and capture stable returns.
2. The Structure and Dynamics of the Global Bond Market
The global bond market is larger than the global stock market and plays a critical role in facilitating liquidity and funding across economies. It operates through both primary markets (where new bonds are issued) and secondary markets (where investors trade existing bonds).
The U.S. dominates the bond market, followed by the Eurozone, Japan, and China. Emerging markets have also become increasingly active players, issuing bonds denominated in both local and foreign currencies to attract international investors.
Key indicators in the bond market include:
Yield to Maturity (YTM): The total return expected if the bond is held to maturity.
Credit Rating: An assessment of the issuer’s creditworthiness, provided by agencies like Moody’s, S&P, and Fitch.
Duration and Convexity: Measures that indicate the bond’s sensitivity to interest rate changes.
These metrics help investors assess potential risks and rewards in a global portfolio.
3. Benefits of Investing in Global Bonds
a. Diversification
Investing in global bonds provides geographic diversification. Since interest rates, inflation, and economic cycles vary across countries, exposure to multiple bond markets reduces the portfolio’s overall volatility.
b. Stability and Predictable Income
Unlike equities, bonds provide fixed coupon payments, offering a predictable income stream. This stability attracts conservative investors, such as pension funds and retirees.
c. Risk Management
Bonds, especially government and high-grade corporate bonds, often act as a hedge during equity market downturns. When stock markets fall, investors typically move toward safer assets, driving bond prices higher.
d. Access to Foreign Currencies
Investing in foreign bonds can provide exposure to different currencies, offering potential gains from favorable exchange rate movements.
e. Inflation Protection
Certain bonds, such as inflation-indexed securities (like U.S. TIPS or U.K. Index-linked Gilts), adjust their principal and interest payments based on inflation, preserving real returns.
4. Risks in Global Bond Investing
While bonds are often viewed as safer than equities, they are not risk-free. Investing globally introduces additional layers of complexity.
a. Interest Rate Risk
Bond prices and interest rates move inversely. When global central banks raise rates, existing bonds with lower yields lose value. Hence, global investors must monitor monetary policies across major economies.
b. Credit Risk
There is a risk that the bond issuer may default on payments. Emerging-market bonds and corporate bonds typically carry higher credit risk compared to sovereign bonds of developed nations.
c. Currency Risk
Investing in bonds denominated in foreign currencies exposes investors to exchange rate fluctuations. For instance, if the U.S. dollar strengthens, returns from euro-denominated bonds may diminish for dollar-based investors.
d. Liquidity Risk
Certain bonds, especially those from smaller issuers or emerging markets, may have limited trading activity, making it difficult to sell them quickly without a price concession.
e. Geopolitical and Economic Risk
Global events such as wars, trade tensions, sanctions, and political instability can disrupt bond markets, particularly in developing regions.
5. Types of Global Bonds
a. Government Bonds
Issued by sovereign states, these bonds are considered the safest investments. Examples include:
U.S. Treasury Bonds – Global benchmark for risk-free rates.
German Bunds – The eurozone’s standard for stability.
Japanese Government Bonds (JGBs) – Used by investors seeking ultra-low yields but high safety.
b. Corporate Bonds
Issued by companies to raise capital. They offer higher yields than government bonds but with added credit risk. Global giants like Apple, Toyota, or Shell issue bonds accessible to global investors.
c. Emerging Market Bonds
Issued by developing economies (e.g., Brazil, India, South Africa). These bonds offer higher yields due to elevated risk but can be rewarding in periods of global growth.
d. Eurobonds
Issued in a currency different from the issuer’s home currency. For example, a Japanese company might issue dollar-denominated bonds in Europe. These instruments enhance global liquidity.
e. Green and Sustainable Bonds
An emerging category where proceeds are used for environmental or social projects. These have gained significant traction as investors prioritize ESG (Environmental, Social, and Governance) criteria.
6. Factors Influencing Global Bond Markets
a. Central Bank Policies
Interest rate decisions by central banks such as the U.S. Federal Reserve, European Central Bank, and Bank of Japan significantly impact bond yields globally. Quantitative easing and tightening cycles influence global liquidity and investor sentiment.
b. Inflation Trends
Rising inflation erodes real returns on fixed-income investments, leading investors to demand higher yields. Conversely, low inflation boosts bond prices.
c. Fiscal Deficits and Public Debt
Countries with large fiscal deficits may need to issue more bonds, influencing supply and yield levels. Investors also consider debt sustainability when investing globally.
d. Global Capital Flows
Institutional investors and sovereign wealth funds allocate massive capital across borders, affecting demand and yield spreads among regions.
e. Geopolitical and Economic Stability
Stable economies attract more bond investors. Events like Brexit, wars, or trade conflicts can trigger capital flight or yield volatility.
7. Strategies for Global Bond Investing
a. Active vs. Passive Investing
Active managers analyze global economic trends, interest rate expectations, and credit cycles to select bonds that may outperform. Passive investors, on the other hand, prefer bond index funds or ETFs that track global benchmarks such as the Bloomberg Global Aggregate Bond Index.
b. Currency Hedging
To mitigate currency risk, investors often use hedging tools like forward contracts or currency-hedged ETFs. This helps stabilize returns in home-currency terms.
c. Duration Management
Investors adjust portfolio duration based on interest rate outlooks. When rates are expected to rise, shorter-duration bonds are preferred to minimize price losses.
d. Credit Spread Analysis
Monitoring credit spreads — the yield difference between corporate and government bonds — helps investors gauge market sentiment and risk appetite.
e. Diversification Across Regions
Allocating investments across developed and emerging markets balances risk and return potential. For instance, combining U.S. Treasuries with Indian or Brazilian bonds can enhance yield without extreme exposure.
8. Role of Technology and Innovation
Technological innovation has transformed global bond investing. Electronic trading platforms have improved liquidity and transparency, while data analytics and artificial intelligence help investors identify opportunities faster.
Moreover, tokenized bonds — digital versions of traditional bonds traded on blockchain platforms — are emerging, promising greater accessibility and efficiency in global debt markets.
9. The Future of Global Bond Investing
The future of global bond markets will be shaped by several key trends:
Sustainability Focus: Growing demand for green and ESG-compliant bonds.
Digitalization: Blockchain-based issuance and trading to reduce costs.
Emerging Market Growth: As developing nations expand, their bond markets will attract more global investors.
Interest Rate Normalization: Following years of low or negative rates, the post-2020 era may witness gradual normalization, impacting bond valuations.
Geopolitical Realignment: Shifts in global power structures and currency preferences (e.g., de-dollarization trends) will influence international bond flows.
10. Conclusion
Investing in bonds in the global market offers investors a unique blend of safety, income stability, and diversification. While equities may deliver higher returns, bonds provide the essential balance in a diversified portfolio, helping manage risk and protect capital during volatile times.
However, success in global bond investing requires understanding complex factors — interest rate movements, currency dynamics, credit risks, and geopolitical developments. With proper strategy, diversification, and risk management, investors can harness the immense opportunities in the global bond market while safeguarding their wealth.
In an interconnected world, bonds remain not just a tool for income generation but a cornerstone of global financial stability. As economies evolve, technologies advance, and sustainability takes center stage, global bond investing will continue to adapt — offering investors both security and growth in an uncertain yet opportunity-rich financial landscape.

Its Time to Diversify YO Bonds - Wu Tang Financial $TLT $IEFyep, the National Debt is about to get reset.. do your reserarch and buy TLT and IEF.

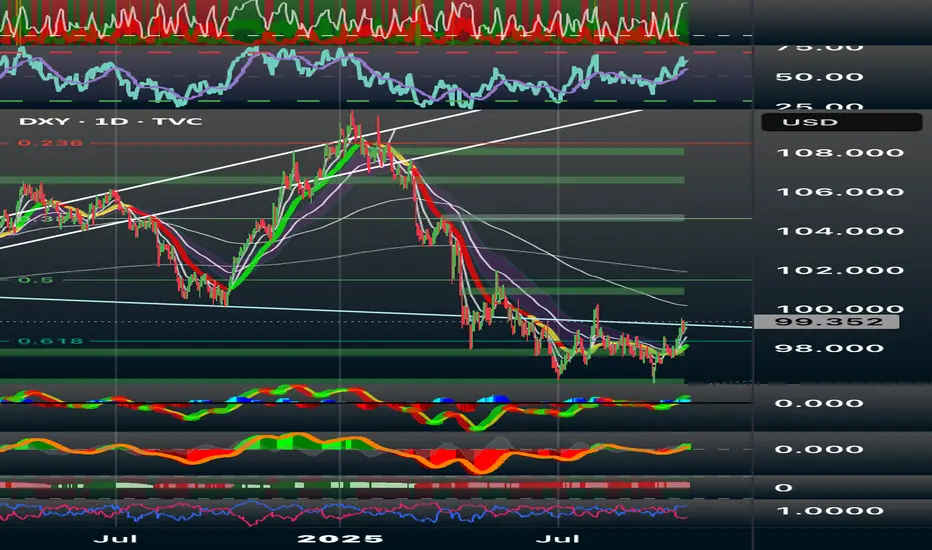
DXY: Key Reversal or Dead Cat Bounce?The U.S. Dollar Index has found footing around the 0.618 Fibonacci retracement near 97.8, breaking a long downtrend. Its push toward the 99.35–100 range suggests a possible retest of a broken structure and alignment with the 50-day EMA. I noticed this move also aligns with short-term recovery signals.
Technical View (1D)
RSI climbing above 50 hints at renewed momentum.
MACD turning green shows early signs of follow-through.
Price is testing 100–101, a former support turned resistance.
If momentum holds, 102, 104, and 106 are the next resistance zones.
Support remains steady at 98, 97, and 95.8, which are shown as strong confluence points with Fibonacci structure.
Scenarios:
If DXY closes above 100.3, I’d expect continuation toward 102.4 or 104.2.
Failure to clear 100 followed by a drop under 98.5 could send it back toward 97.2 or even 95.8.
For now, my bias stays neutral to slightly bullish in the short term. A clean breakout above 100 would confirm a structural shift upward. None the less, I’m watching U.S. yields and upcoming CPI data closely and considering the factor that stronger inflation or a hawkish Fed tone could fuel the next DXY leg higher.
Thank you for your time and support, and as always please remember that this is always NFA and DYOFR, respectfully.
Why Did The Market Bounce Today? Today the market bounced for 2 reasons....
1. Broadcom NASDAQ:AVGO received news of another OPENAI partnership. This multi year billion dollar deal caused the stock to bounce double digits. When this name rallies it causes liquidity to flow into the $SOXX. Semiconductors are still the heartbeat of this market and have propped everything up today.
The OPENAI headline seems to be running out of steam as the last 3 partnership announcements caused 3 stock to make new highs but AVGO did not take out its highs. This will be on watch.
2. The bond market was closed today allowing investors to not have to worry about catalysts or yields. There's an old saying on "when the cats away, the mice will play" .
The bond market is the much larger investment market aka the "cat" and this liquidity has clearly spilled over into smaller cap higher beta stocks.
Tomorrow we will see if the markets can take out the 20 day Moving average or if this pop gets sold into.

Oil/Bonds Just Flipped 5-year Support into ResistanceOil-to-bonds SR-flipped this 5-year support
US10Y not as neat and tidy, but close to the same and correlated

The DOW, Gold, and Morgan StanleyAs it turns out, the stock market that appears to be the gift that keeps giving, is actually giving nothing. In reality, when we measure the value of the DOW with real money (Gold) rather than fiat inflationary currency, the markets are crashing down so fast it'll make your head spin. The $NYSE:DOW/TVC:GOLD shows us that what appears to be one of the greatest bull markets in the history of the entire exchange, is actually just one giant melt up fueled by monetary expansion and inflationary action.
Morgan Stanley NYSE:MS recent came out and shared their new edit to their famous 60/40 portfolio arrangement. In this edit, they entertained the idea that inflation was simply not friendly to the client's holdings and that they should actually diversify their positions. Originally, the 60/40 portfolio consisted of 60% equities, and 40% bonds. However, they presume that the future will not bring a passive environment to the boring 40% bonds because, like anyone with two eyes and a brain, they believe that higher inflation lies ahead. Their solution? Get this, to buy Gold . Who would of thought of something so genius? The profound idea that a placeholder of value would hold value and protect you from inflation could only possibly be developed in such a megabank super titan with trillions in AUM. All sarcasm aside though, it might not be exactly obvious to most what this means for gold and bonds.
Firstly for bonds, most of which are held in treasuries, we can expect some sort of retail selloff only to be bought back up again by the Fed. So nothing news worthy there. However for our precious gleaming metal, we can expect a continuing bull run as money leaves the debt market and enters into precious metals (again namely gold). We should also be inclined to believe that this should help gold mining companies and give them a nice increase in their stock values over time. Next, we shouldn't expect to much of a move from this in the stock market except the usual volatility and seasonal shifts.
Lastly, from this admission from the boys at Morgan Stanley, we can also expect continuing inflation despite what the numbers released by the Fed say. No, the cost of living will not lower. No, the Fed will not raise rates to curb inflation. No, the numbers are never real and never will be. But this does mean that we know what's coming and how to protect ourselves.
Here are the possible plays to consider
Gold: GOLD (USD/OZ)
Stocks: NYSE:NEM , $B, NYSE:EGO , AMEX:EQX , NYSE:AEM
ETF: GDX, GDXJ

SOFR Futures: Understand Market Pricing for future Fed PolicyWith the Federal Reserve having just cut interest rates and guiding towards further cuts this year and through 2026, I have received several requests to explain how traders can understand for themselves what the market is pricing and expecting for Fed policy by a specific point in time.
Perhaps the more simplistic way to view what is priced or implied for the next FOMC meeting is to use the ‘FedWatch’ tool on the CME's website - www.cmegroup.com . This looks at the distribution of expectations for the next FOMC meeting, as implied in the fed funds futures pricing.
Interest rate futures can guide our understanding of what’s priced
One way traders can gauge the market’s expectations for future Fed policy—commonly referred to as “what is priced in”—is through interest rate futures pricing or in interest rate derivatives (interest rate swaps, for example). These are tradable instruments that allow investors and corporates to hedge their interest rate risk, while also giving speculators a vehicle to express views on where they see Fed interest rate policy at a specific point in time.
TradingView doesn’t offer pricing on IR swaps, but it does offer pricing on SOFR 3-month futures and Fed funds futures, both of which can be useful in understanding where the market sees policy risk. My preference is SOFR futures, as they are comparatively more liquid, especially in the further-dated contracts for 2026 and 2027 and are more heavily traded than Fed funds futures.
What is the SOFR rate?
SOFR is one of, if not the most important, markets in the entire financial ecosystem. It is the first derivative of markets and is worth taking a moment to familiarise yourself with.
SOFR (Secured Overnight Financing Rate) essentially represents the interest rate at which financial institutions lend cash overnight (and what borrowers pay), with borrowers pledging US Treasuries as collateral.
The Federal Reserve influences SOFR through its monetary policy settings, with the rate typically tracking within the Fed’s target corridor. This corridor is defined by the upper bounds and what the Fed pays banks on reserves (currently 4.25%) and the lower bounds and what the Fed pays financial institutions that lend overnight repo to the Fed (the ‘RRP rate’, currently 4%).
SOFR 3-month futures, therefore, reflect the market’s expectations of what the overnight risk-free rate will average over a defined three-month period at a forward point in time.
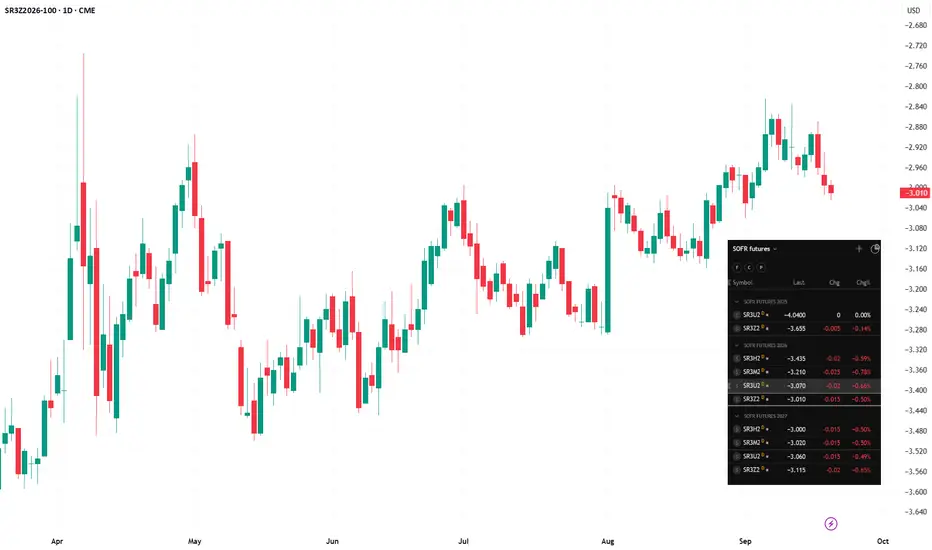
For example, the SOFR 3-month December 2026 futures contract (TradingView code: SR3Z2026 ) reflects the market’s expected average interest rate on overnight cash borrowing from December 2026 through to the contract’s expiration on 16 March 2027.
Since SOFR is guided by the Fed’s policy corridor, the futures price on that contract provides an indication of where the Fed could set interest rates at a given point in time.
Calculating the markets expectations for future Fed policy from SOFR futures
The price of SOFR 3-month futures moves dynamically through supply and demand, with rates traders reacting to economic data, Fed communications, sentiment in other markets (such as equities), and liquidity conditions. Upon expiration, futures are cash settled at 100 (or “par”), so the implied interest rate for a set contract is calculated as 100 minus the futures price.
For example, if SR3Z2026 trades at 96.99, the implied rate for the SOFR between Dec 2026 and 16 March 2027 is 3.01% (100 – 96.99). If the current SOFR spot rate (TradingView code: SOFR) is 4.38%, this therefore implies that the market is pricing 139 basis points of further Fed rate cuts by early 2027.
You can add all the SOFR 3-month futures contracts to a watchlist in TradingView, ordered by the contract period. For instance, starting with SR3U2025 (the September SOFR futures expiring on 16 December 2025).
As we see in the screenshot, based on today’s curve, the perceived low point—or the pricing for the “terminal” rate—in the Fed’s cutting cycle is seen in the December 2026 contract, at 2.99%.
Why is this useful for all traders?
Firstly, it provides a clear guide to the market’s view of future Fed policy and what is currently already discounted in interest rate markets. This matters because the USD, US Treasuries, equities, and even gold tend to move in line with—or inversely to—shifts in interest rate futures pricing.
If the market has fully priced in a rate cut, then when the Fed delivers that cut, the market reaction should be minimal. Conversely, if the market expects little or no cut and the Fed surprises by cutting rates, one can expect an outsized reaction in assets like the USD or US 2-year Treasury yields.
This makes SOFR futures incredibly helpful for traders across asset classes when managing risk around key data releases or Fed meetings.
They can also help assess perceived recession risk. If the Fed’s “neutral rate”—the equilibrium setting that is neither stimulatory nor restrictive—is 3%, and the market prices the terminal rate in the cutting cycle at the same level, this suggests a low probability of recession. A recession risk scenario would likely see the market pricing the Fed’s terminal rate well below 2.5%.
Given how often the question “how do I know what’s priced in?” comes up, I hope this offers a clear framework for assessing it through SOFR futures on TradingView.
Good luck to all