Finally time for TLT to run?TLT has been consolidating for a couple of years now, I think the next move is going to be a big one.
We've tested the trend line multiple times now, and I think the next time it touches the trend line, it should break it.
First stop would be the $113-117 area. Let's see how high we can go. I've marked off key resistances, should we break the trend line to the upside.
TLT

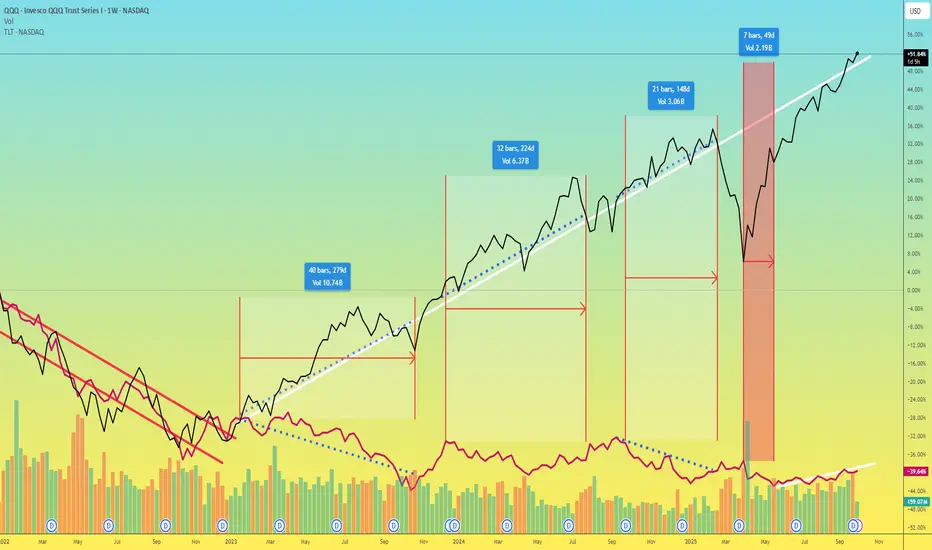
How Intermarket Signals Could Help to Avoid Major CrashesThree Crashes, One Pattern
I've been testing whether intermarket analysis can help avoid major drawdowns when selling weekly puts. Here's what the data shows across three very different market crashes:
COVID Crash (Feb-Mar 2020)
Drop: -914.75 points (-22.87%)
Duration: 29 bars, 41 days
Signal: BEAR fired in mid-February, BEFORE the crash
The macro composite dropped sharply as bonds rallied (flight to safety), credit weakened, and VIX exploded. The signal went red weeks before the worst of the selling.
2022 Bear Market (Jan-Jul 2022)
Drop: -837.25 points (-15.25%)
Duration: 137 bars, 199 days
Signal: BEAR fired in early January, stayed red through most of the decline
This was a slow grind lower as the Fed tightened. The indicator stayed in BEAR mode for most of the year, keeping me flat during the worst of it. Notice how the red background covers almost the entire decline.
April 2025 Tariff Crash
Drop: -770.25 points (-13.35%)
Duration: 6 bars, 10 days
Signal: BEAR fired in late March, BEFORE the drop
The fastest of the three crashes - just 10 days. But the macro signals still deteriorated first. Credit (JNK) weakened, volatility spiked, and the composite crossed below its signal line before price collapsed.
The Pattern
Three different causes (pandemic, Fed tightening, tariffs). Three different timeframes (41 days, 199 days, 10 days). But in each case, the macro signals deteriorated BEFORE equities fell hard.
The Core Idea
Markets don't move in isolation. Before major equity drawdowns, stress often appears first in:
TLT (Bonds) - Flight to safety begins
JNK (Credit) - High-yield weakens as credit risk gets priced
DXY (Dollar) - Strengthens as risk-off flows accelerate
VIX (Volatility) - Fear builds in the options market
The indicator normalizes each market using z-scores (standard deviations from 1-year average), then combines them:
Macro Score = (TLT + JNK) - (DXY + VIX)
When this composite trends down and crosses its signal line, conditions favor caution. When it trends up and crosses above, conditions favor risk.
Why This Matters for Put Sellers
Selling weekly puts has attractive math: 90%+ win rate, consistent premium. But the losses when they come are brutal (600% stop loss). One bad week can erase months of gains.
The question isn't IF a crash will happen. It's whether you're holding short puts when it does.
My 5-year backtest on ES 7DTE puts - using TastyTrades backtester:
Without Macro Filter:
357 trades | 96.1% win rate
Total P/L: +$63,492
Max Drawdown: 10.30%
Profit Factor: 2.90
With Macro Filter:
200 trades | 96.0% win rate
Total P/L: +$33,636
Max Drawdown: 2.91%
Profit Factor: 3.51
Key finding: 72% reduction in maximum drawdown.
Yes, fewer trades means less total profit. But avoiding the tail risk changes everything about position sizing and sleep quality.
Current Status: A Challenging Environment
Right now (January 2026), we're in a consolidation range. The macro score is hovering near flat, and with the 7-day EMA setting, signals are flipping almost weekly.
This is exactly the environment where the indicator struggles:
Range-bound price action
No clear macro trend
Frequent signal changes (whipsaws)
Difficult to follow systematically
I'm being transparent about this because it's real. The indicator seems to work well for catching major regime shifts but generates noise during consolidation phases.
Work in Progress
This is not a finished system. It's a research framework I'm actively developing. Areas I'm exploring:
Signal method variations - The indicator offers 7 different methods (EMA Cross, Slope, Momentum, Multi-Confirm, etc.). Some may handle consolidation better.
Longer smoothing periods - The current 7-day EMA is responsive but whipsaw-prone. Testing longer periods for range markets.
Regime detection - Adding logic to identify trending vs ranging environments and adjust sensitivity.
Combining with price filters - Using EMA20 or other price-based filters as secondary confirmation.
The goal is to reduce false signals during consolidation while maintaining the ability to catch major turns.
What It Catches vs. What It Doesn't
Works well for:
Major regime shifts with clear macro deterioration
Gradual credit/bond stress building over days or weeks
Events like COVID, 2022 bear market, April 2025 tariff crash
Struggles with:
Range-bound, choppy markets (like now)
Overnight gaps from surprise news
Idiosyncratic moves unrelated to macro
Short-term whipsaws in flat macro environments
How I'm Using It (Current Approach)
1. Check the indicator before opening new put positions
2. Clear RISK-ON (green, rising): Full position size
3. Clear RISK-OFF (red, falling): No new positions or reduce exposition
The "flat/choppy" category is new - I'm adding nuance rather than treating it as binary. When macro is unclear, I'd rather miss premium than get caught in a whipsaw.
The Honest Tradeoff
What you give up:
Fewer trades = less total premium
False signals in consolidation
Missed rallies when flat
Requires discipline to follow
What you gain:
Avoided COVID crash: -22.87%
Avoided 2022 bear: -15.25%
Avoided April 2025: -13.35%
Significantly better risk-adjusted returns
Ability to size up when conditions are clearly favorable
For me, avoiding those three crashes was worth the whipsaws in between. Your risk tolerance may differ.
Try It Yourself
I've published the indicator with multiple signal methods so you can test what works for your approach:
EMA Cross (what I use) - Classic crossover
Slope - Simple trend direction
Momentum - Rate of change threshold
Multi-Confirm - Requires 4+ methods to agree (more conservative)
Indicator in related ideas below.
What's Next
I'll continue refining this approach and will share updates as I find improvements. Specific things I'm testing:
Longer EMA periods for the signal line
Adding a "flat zone" where macro is inconclusive
Combining macro with price structure (above/below key MAs)
Different parameter sets for trending vs ranging markets
If you have ideas or are working on something similar, drop a comment. This is open research, not a black box.
Final Thought
Three crashes. Three different causes. Three times the macro signals warned before price collapsed.
Is it perfect? No - the current consolidation proves that. But when the big moves come, they tend to show up in credit, bonds, and volatility first.
I'd rather deal with some whipsaws during flat markets than be holding short puts when the next -15% hits.
---
What macro signals do you watch? How do you handle range-bound environments? Let me know in the comments.

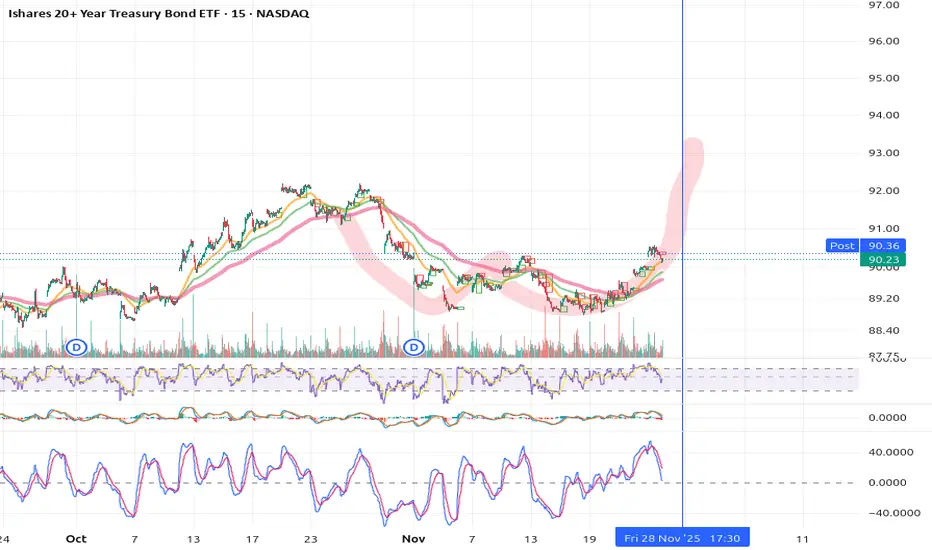
TLT surpressed alot can we push higherHi, i want to show you my TLT chart
As i found a very common pattern, named the Adam and Eve as you see highlighted in red brush,
we could have an enormous pump on the 20year Bond ETF coming this week.
Closing price today was higher as the daily start and the aftermarket closed at 90,36 which shows strength.
No trading advice, just my 2 Cents. Lets see what markets do.
BTW 27th NYSE is closed but on 28th we can trade till 1pm NY Time.
Good luck
coinwide
Opening (IRA): TLT May 15th -83P... for a .91 credit.
Comments: I don't know that I really need more TLT shares, but wouldn't mind picking them up if they're cheap or they reduce my cost basis in the stock aspect of my covered call setup.
Here, targeting the 52-week low in the expiry that is paying around 1% of the strike price in credit. This is a bit long-dated, but I don't have much on here, so am fine with hanging out in the trade longer than I would usually.
Metrics:
Max Profit: .91 ($91)
Buying Power Effect: 82.09
ROC at Max: 1.11%
Will look to ladder out at the 83 strike, so long as it's paying >1% of the strike price in credit.

CREDIT CRISISWe are beginning to see evidence of a credit crisis starting. low demand for US bonds can trigger a currency crisis for the USD, higher rates will lead to refinancing company problems (especially with all the zombie companies that should have blown up over a decade ago.) and major economic depression-style job losses.
Currently, we are very early stages but things are moving at lightning speed on a macroeconomic level.
I know this is likely gibberish to most here pon trading view but it is of MASSIVE importance to your trading and investing.
CAUTION IS IN ORDER!!
Click boost, follow, and subscribe! I can help you navigate these crazy times.

TLT📌 Summary
This week's events and data paint an interesting picture for long-term Treasuries.
The Federal Reserve has confirmed large-scale Treasury purchases in the coming months. In the next 30 days, the Fed will enter the market with $40 billion in Treasury bill purchases. This is effectively a return to quantitative easing (QE), which will put direct downward pressure on yields..

WAVE 5 TOPPING EXIT ANY LONGS IN SPY Today I moved back to a 50% long in the money PUTS at sp cash 6840 /6845 zone if we can breakout to above 6870 on a close I will move to 75% long in the money 2027 puts Timing in my call for the BULL market to end within 9 to 15 TD is now day 6.5 The market is setting up for a decline of 10% out of nowhere . Silver is confirming the BUBBLE I am looking for 64 plus or minus 2 $ before the Start of the reversal in ALL ASSETS
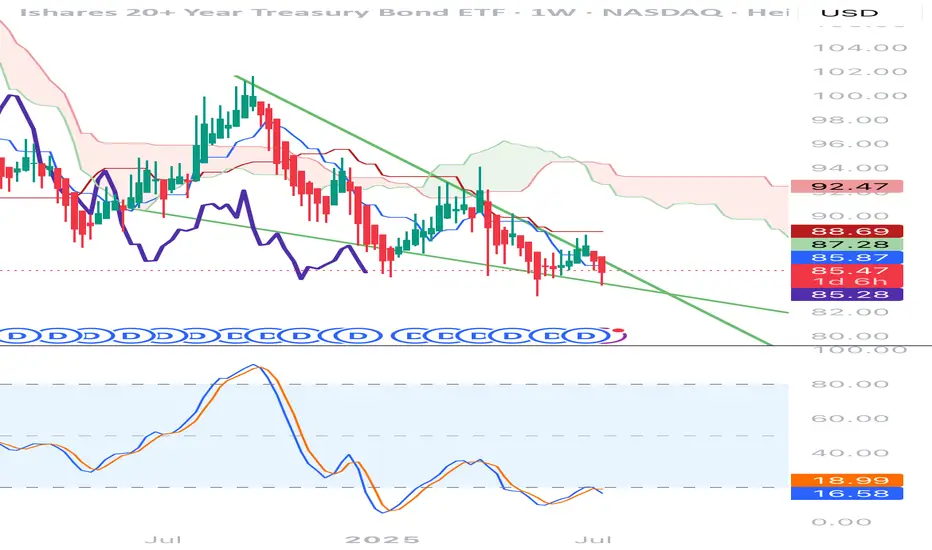
TLT long-term TA20+ Treasury bond looks somewhat very interesting for the last couple of months, the accumulation has been steadily increasing since September, currently mid-term is in a small distribution but nothing serious yet, it rather looks promising for an uptrend in the near future, and as you should know - strong TLT is not good for risky assets growth, it's something you should keep an eye on.

TLT - A long-term outlookIf price is moving up, we look for support structure, which in this case is a Real Swing Low (RSL).
An RSL is confirmed when the most recent Real Swing High (RSH) is broken.
What we’re seeing here is the beginning of a stair-step move to the upside, including short-term support.
Even the CIB has been broken, which suggests that a shift in market behavior is underway.
Our statistical probability of hitting the centerline is roughly 80%. That implies we can look for a longer-term play in TLT.
However, keep a close eye on the 1/4 line. It isn’t exactly friendly, as the rejections we’ve seen so far make clear.
I probably go with ITM LEAP options with a
Delta of around 70–80 and a over 120 DTE.
Happy profits, and for those in the U.S., wishing you a happy Thanksgiving.

Its Time to Diversify YO Bonds - Wu Tang Financial $TLT $IEFyep, the National Debt is about to get reset.. do your reserarch and buy TLT and IEF.

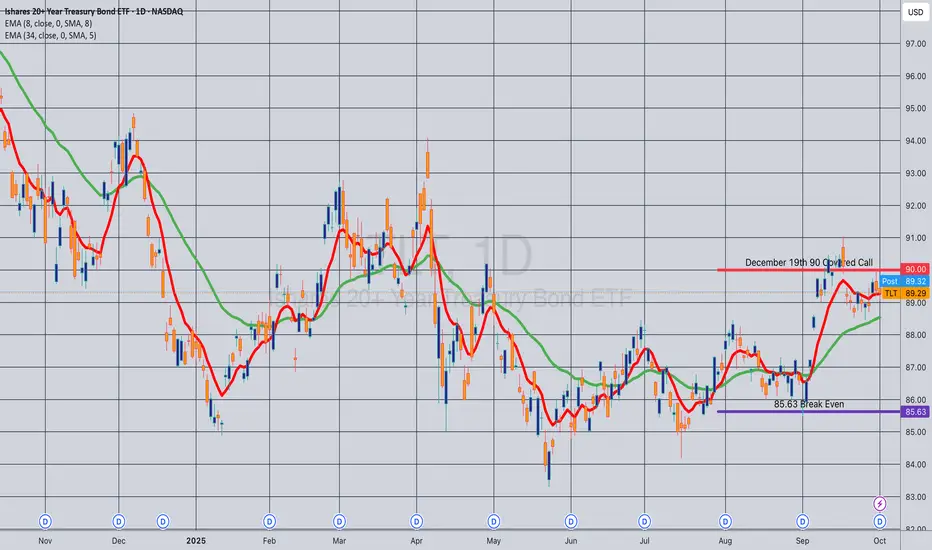
UPDATE: TLT December 19th 90 Covered CallsThis is a continuation of a long-running TLT covered call setup that I started out in April of 2025 (See Post Below) with my current break even shown which I'm doing an update on.
I've generated 6.50 ($650) in free cash flow to date in short call premium + dividends on a buying power effect that was a 92.13 debit/contract when I opened it.
Sitting on my hands here, waiting to roll out the short calls when they're in profit or alternatively to take profit on the setup at or near max and then reset.
TLT to 110 as FED cut cycle beginsExtended duration bond proxies like TLT are trading at all time lows due to the high interest rates in the US the last few years. With the FED turning dovish, and labor market starting to crack, this trend is likely to reverse. TLT is a good bet here, more leverage can be gained with a 3x ETF like TMF.

TLT TimeRate cuts start this Wednesday, September17th, 2025.
Polymarket odds are now strongly in favor of 3 rate cuts in 2025. CME Fedwatch probability is now at 70% for 3 cuts by December 10th.
Economic data, especially employment, has strongly confirmed the start of a full rate-cutting cycle beginning in 1.5 days.
Historically this set of circumstance has coincided with large or even historic bond rallies.
Will this time be different?
Long TLT/SPY📌 Bonds Explained: What They Are, How They Work & Key Risks
Bonds are one of the oldest and most important financial instruments in global markets. They are used by governments, corporations, and institutions to raise money, and by investors to earn income, diversify portfolios, and manage risk.
At their core, a bond is a loan:
The issuer (borrower) raises capital by selling bonds.
The investor (lender) provides money in exchange for periodic interest payments (coupon payments) and the return of the principal (face value) at maturity.
🔹 1. What is a Bond?
When you buy a bond, you are lending money to the issuer. The issuer promises:
Interest payments (usually fixed) on a regular schedule (semiannual or annual).
Repayment of principal (the original investment amount) when the bond matures.
📌 Example:
You invest $1,000,000 in a 10-year bond paying 3% annually (semiannual coupons).
Every 6 months, you receive $15,000 in interest payments.
At the end of 10 years, you (hopefully) receive back your original $1,000,000 principal.
🔹 2. Why Do Companies and Governments Issue Bonds?
Governments → Fund infrastructure, social programs, defense, or refinance existing debt.
Corporations → Finance expansion, research, acquisitions, or refinance loans.
Municipalities → Build schools, hospitals, and roads.
Bonds allow issuers to access large pools of capital without giving up ownership (like stocks).
🔹 3. Why Do Investors Buy Bonds?
Stable Income: Regular coupon payments.
Capital Preservation: Return of principal at maturity (assuming no default).
Diversification: Bonds often behave differently from stocks, balancing risk.
Hedging Inflation/Interest Rates: Certain bonds (like TIPS) protect against inflation.
Relative Safety: High-quality government bonds are considered safe-haven assets.
🔹 4. Key Types of Bonds
Government Bonds
Issued by sovereign states.
Example: U.S. Treasuries, UK Gilts, German Bunds.
Generally low risk, lower yields.
Corporate Bonds
Issued by companies.
Higher yields than government bonds but higher risk.
Municipal Bonds
Issued by local governments or agencies.
Often come with tax benefits for investors.
High-Yield (Junk) Bonds
Issued by lower-credit issuers.
Higher potential returns, but much riskier.
Inflation-Protected Bonds
Coupon/principal linked to inflation.
Example: U.S. TIPS (Treasury Inflation-Protected Securities).
🔹 5. Three Main Risks of Investing in Bonds
Even though bonds are often seen as “safe,” they carry risks that investors must understand:
1️⃣ Credit Risk (Default Risk)
The issuer may fail to pay coupons or repay the principal.
Higher with corporate bonds and emerging market government bonds.
Mitigated by credit ratings (Moody’s, S&P, Fitch).
📌 Example:
If a company defaults, you may lose part or all of your investment.
2️⃣ Interest Rate Risk
Bond prices move inversely to interest rates.
If rates rise, existing bond prices fall (since new bonds offer better yields).
If you sell before maturity, you could face a loss.
📌 Example:
You bought a 10-year bond at 3%. A year later, rates rise to 5%. Your bond’s market value falls, because investors prefer newer bonds paying higher coupons.
3️⃣ Inflation Risk (Purchasing Power Risk)
Even if you hold the bond to maturity, rising inflation erodes the real value of your returns.
A 3% coupon loses attractiveness if inflation rises to 6%.
📌 Example:
Your bond pays $30,000 annually, but inflation pushes up costs by $40,000 per year → you are effectively losing purchasing power.
🔹 6. Bonds vs. Stocks
Bonds: Debt, fixed income, contractual obligation, lower risk, limited upside.
Stocks: Equity ownership, dividends (optional), higher risk, unlimited upside.
In a company bankruptcy, bondholders are paid before shareholders.
🔹 7. How Investors Use Bonds in Portfolios
Income generation: Retirees and pension funds rely on coupon payments.
Diversification: Bonds often rise when stocks fall, reducing portfolio volatility.
Risk management: Safe-haven bonds (like Treasuries) act as “insurance” during crises.
Speculation: Traders can bet on interest rate moves via bond futures and ETFs.
🔹 8. Bonds vs. Stocks: The TLT–SPY Correlation
One of the most widely followed relationships in global markets is the correlation between:
TLT → iShares 20+ Year Treasury Bond ETF (tracks long-dated U.S. Treasury bonds).
SPY → SPDR S&P 500 ETF (tracks U.S. equities).
📈 Historical Relationship
Over the past two decades, TLT and SPY have often moved in opposite directions. (The Correlation between SPY/TLT often hovers around 0.)
Why? When stocks sell off, investors typically seek safety in Treasuries, pushing bond prices up (yields down).
This negative correlation makes bonds a powerful diversifier in equity-heavy portfolios (60/40).
📌 Example:
2008 Financial Crisis → SPY plunged ~37%, while long-dated Treasuries (TLT) surged as investors fled to safety.
March 2020 COVID Crash → SPY fell ~34% peak-to-trough, TLT spiked ~20% as the Fed cut rates and investors piled into Treasuries.
🐂 Strategy #1 (MA):
Buy SPY when TLT crosses below the 95 MA.
Sell SPY when TLT crosses above the 95 MA.
🔄 But the Correlation Can Shift
In inflationary environments, bonds and stocks can fall together.
2022 is a perfect example:
Inflation spiked → Fed hiked rates aggressively.
TLT dropped ~30% (yields surged).
SPY also fell ~19%.
Both asset classes sold off simultaneously, breaking the hedge.
🐂 Strategy #2 (Re-Balancing):
Buy TLT at the close of the seventh last trading day of the month.
Sell TLT at the close of the last trading day of the month.
Sell TLT short at the close of the month.
Cover TLT at the close of the seventh trading day of the month.
Higher Returns after rate hikes.
📊 Why This Matters for Investors
In normal times: TLT acts as a counterweight to SPY, smoothing portfolio volatility.
In inflationary shocks: Both can decline, reducing diversification benefits.
Lesson: Don’t assume bonds will always hedge equities — context (inflation, Fed policy, growth cycles) matters.
📌 Practical Uses of the TLT–SPY Correlation
Portfolio Diversification
A 60/40 portfolio (60% stocks, 40% bonds) relies on the negative correlation.
Works best when inflation is low and stable.
Risk-On / Risk-Off Gauge
If both SPY and TLT rise → markets are calm, liquidity flows into both risk and safety.
If SPY falls while TLT rises → classic risk-off move (flight to safety).
If both fall → inflation or policy tightening environment (no safe haven).
Trading Signals
Divergence trades: When SPY rallies but TLT also rallies strongly, it may signal equity rally exhaustion (risk-off brewing).
Macro hedge: Long TLT positions can offset downside risk in SPY-heavy portfolios — but only in disinflationary or deflationary shocks.
🔹 9. EWJ–TLT Correlation: Japan Equities vs. U.S. Treasuries
EWJ → Tracks Japanese equities (large & mid-cap companies).
TLT → Tracks U.S. long-dated Treasuries.
Unlike the classic SPY–TLT inverse correlation, the EWJ–TLT relationship is more complex, shaped by:
Global risk sentiment (risk-on/risk-off flows).
Currency effects (USD/JPY exchange rate).
Japan’s ultra-low interest rate environment (BoJ policy).
📈 Historical Tendencies
1️⃣ Risk-Off Periods (Global crises → flight to safety):
TLT rallies (U.S. Treasuries bid).
EWJ often falls, as Japanese equities are highly cyclical and export-driven.
Negative correlation dominates.
📌 Example:
2008 Crisis → TLT surged; EWJ plunged with global equities.
2020 COVID Crash → Same pattern: safety flows to Treasuries, Japanese stocks sold.
2️⃣ Risk-On Periods (Liquidity, global growth optimism):
EWJ rallies with global equities.
TLT may drift lower (yields rising on stronger growth).
Correlation weak to moderately negative.
📌 Example:
2016–2018: Global growth rebound → EWJ rose, TLT fell as U.S. yields climbed.
3️⃣ Currency Channel (USD/JPY)
Japanese equities (EWJ) are sensitive to the yen.
A stronger USD/JPY (weaker yen) boosts exporters (good for EWJ).
TLT rallies often coincide with USD weakness (yields down, dollar down), which can hurt Japanese exporters, adding another layer of inverse correlation.
🔄 Shifts Over Time
Long-term average correlation: Mildly negative (similar to SPY–TLT, but weaker).
During inflation shocks (2022): Correlation turned positive at times:
TLT fell as U.S. yields spiked.
EWJ also struggled due to global tightening & yen weakness.
Both moved down together, breaking the hedge.
📊 Why EWJ–TLT Matters
Global Diversification Check: Investors often think Japanese equities diversify U.S. equities, but they can be just as cyclical. Adding TLT creates the real hedge.
Risk-Off Signal: When both EWJ and TLT rise, it may indicate global liquidity easing (rare but bullish).
Currency Overlay: Always factor USD/JPY → sometimes EWJ’s move is more about currency than equities.
🐂 Strategy #3 (EWJ):
When Japanese stocks are above their 150-day moving average, go long TLT (US long-term Treasury). When the average is below the 150-day average, stay out. The correlation between TLT and EWJ can serve as a breath signal.
📌 Conclusion: Bonds as the Foundation of Finance
Bonds are the backbone of the global financial system, connecting borrowers (governments, corporations) with lenders (investors).
✅ Bonds provide regular income and capital preservation.
✅ They carry risks: credit, interest rate, and inflation.
✅ They are essential for diversification and risk management.
✅The TLT–SPY correlation is dynamic. Historically negative, providing diversification. In inflationary shocks (like 2022), the correlation turns positive, breaking the hedge.
✅ EWJ–TLT is a Global Macro Hedge, But Fragile. Usually inverse: Risk-off = TLT up, EWJ down. Sometimes aligned: Inflation shocks or synchronized global tightening → both down. Currency filter essential: USD/JPY often mediates the relationship. This makes EWJ–TLT correlation a powerful barometer of global macro regimes: Disinflationary slowdowns → Strong hedge. Inflationary crises → Hedge breaks.
For investors, understanding bonds is crucial, even if you primarily trade equities or commodities, because bond yields influence everything: stock valuations, mortgage rates, and even currency markets.

Opening (IRA): TLT November 21st -83P... for a 1.02 credit.
Comments: Looking to pick up additional shares at 83 or below. Targeting the strike and duration that pays around 1% of the strike price in credit.

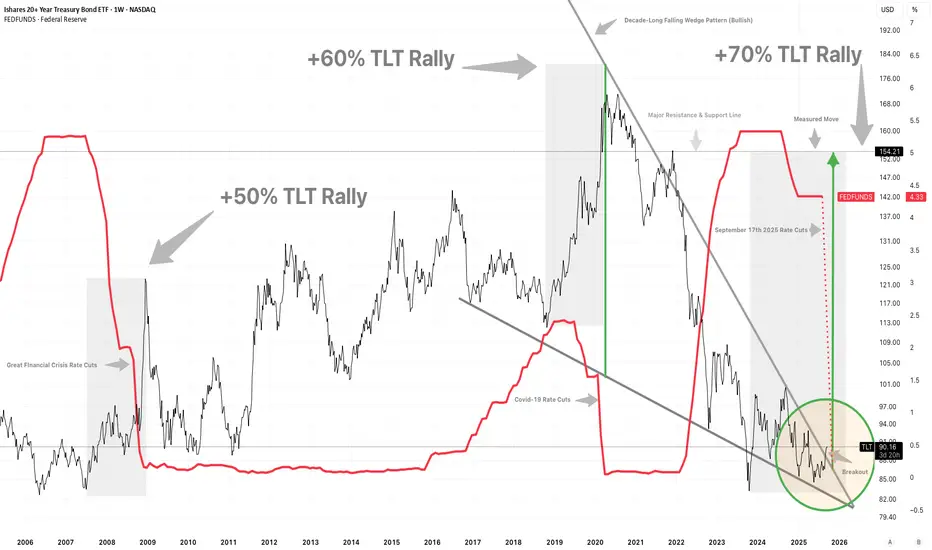
$TLT bull run is beginning; Top trade idea for 2026- Anticipated Federal Reserve Rate Cuts are coming. People think for the good reason but it is actually for the wrong reason. Fed is too late !
- Treasury yields are falling after being stubborn for years
- NASDAQ:TLT would be safe haven for the recession we are tipping into 2026
- Market is all time high with la laland spending by Big Cap Tech stocks because of AI

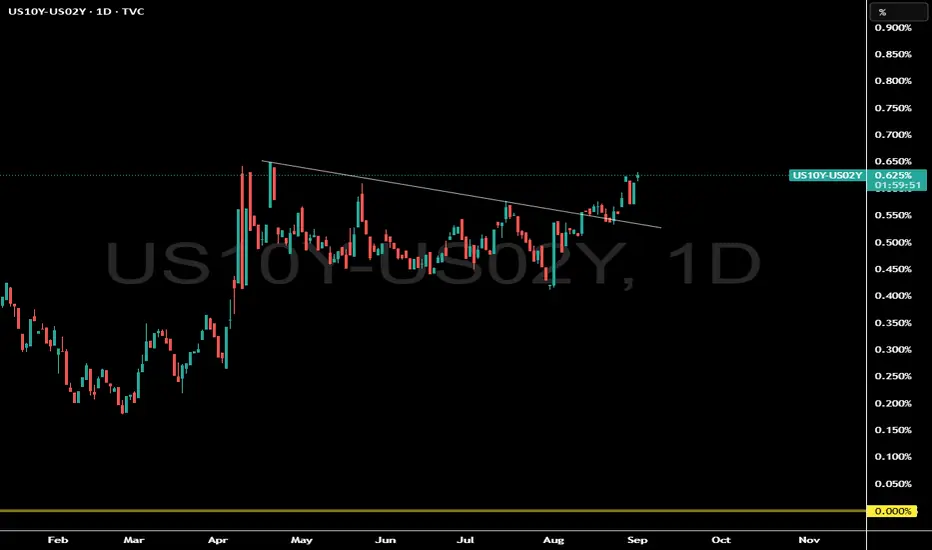
The Most Bullish Chart in the stock marketWhat does this 10 year yield and 2 year yield chart represent?
Is the bond market signaling a big economic event?
This bond market signal has a 100% success rate...but timing is the hard part since its a monthly long term signal.
Wait until we make a new pivot high in this chart...we should see some fireworks.
If you need to know what this means subscribe to our Youtube channel Where we often discuss macro economics and equites.
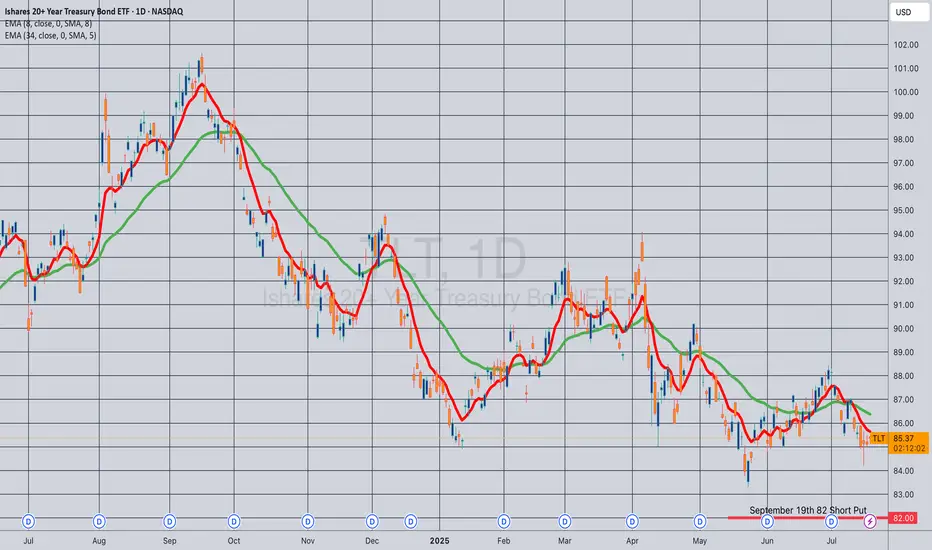
Opening (IRA): TLT Sept 19th 83 Short Put... for an .88 credit.
Comments: Camping out with a strike slightly below the 52-week low, where the options contract is paying a smidge more than 1% of the strike price in credit.
I don't really need more TLT, but wouldn't mind being assigned more at a lower price than the stock element of my covered calls.

Opening (IRA): TLT September 19th 82 Short Put... for a .90 credit.
Comments: Adding to my position at strikes slightly better than what I currently have on ... .
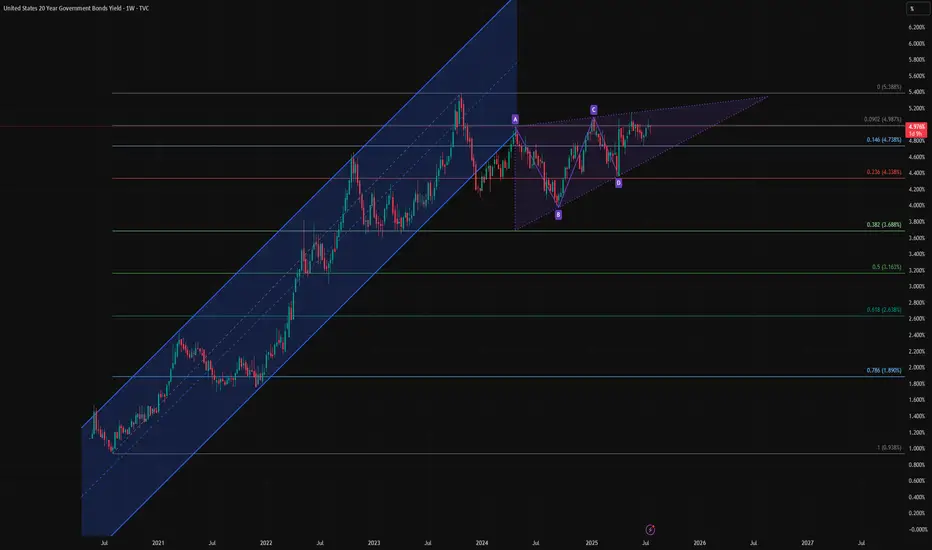
Bond Bulls Smell Blood: 20-Year Yields Likely to Fall🧩 Fundamental Bear Case for 20-Year Yields
1. Recession Risk and Slowing Growth
Leading economic indicators (e.g., ISM Manufacturing, Conference Board LEI) continue to suggest softening demand across key sectors.
A recession or significant slowdown would drive capital into long-duration Treasuries, causing yields to fall as bond prices rise.
Historically, 20-year yields fall 200–300bps from cycle peaks during recessions. With yields near 5%, there is ample downside room.
2. Federal Reserve Policy Pivot
The Fed’s hiking cycle appears to be at or near its terminal point. Rate cuts in 2025 are increasingly priced in, especially as inflation moderates.
If inflation continues to decelerate toward the Fed’s 2% target while growth slows, the Fed may be forced to ease sooner or more aggressively than expected.
Long-duration bonds, including the 20Y, are highly sensitive to forward rate expectations and would benefit from a dovish pivot.
3. Disinflationary Trends
Core inflation metrics (e.g., Core PCE, Core CPI) are in year-over-year decline.
Key disinflationary forces:
Wage pressures have eased as labor markets normalize.
Housing costs, which lag in CPI data, are projected to fall further.
Supply chain normalization continues post-COVID.
These factors reduce the need for elevated long-term yields, especially with inflation expectations anchored.
4. Supply-Demand Dynamics Favor Treasuries
Despite large Treasury issuance, global demand remains strong:
Foreign buyers (e.g., Japan, EU) seek higher yields as their home rates remain low or negative.
U.S. institutions (pensions, insurance funds) are rebalancing into risk-free long bonds amid equity volatility.
A risk-off rotation or broader de-leveraging cycle would only accelerate this demand.
🔍 Technical Summary
Rising wedge pattern is nearing a potential breakdown — a bearish structure signaling exhaustion.
Price is failing to reclaim the previous uptrend channel, now acting as resistance.
A completed harmonic AB=CD pattern near recent highs suggests a mean-reverting move could be imminent.
Closest technical targets include:
4.33% (23.6% Fib)
3.68% (38.2% Fib)
Possibly even 3.16% (50% retracement) over the next 6–12 months if macro weakness persists.
📌 Bottom Line
The combination of:
Cooling inflation
A Fed pivot on the horizon
Rising recession risk
And technical exhaustion signals
Supports a bearish outlook for 20-year yields, meaning bond prices (especially long-duration instruments like TMF or TLT) could appreciate meaningfully from here.
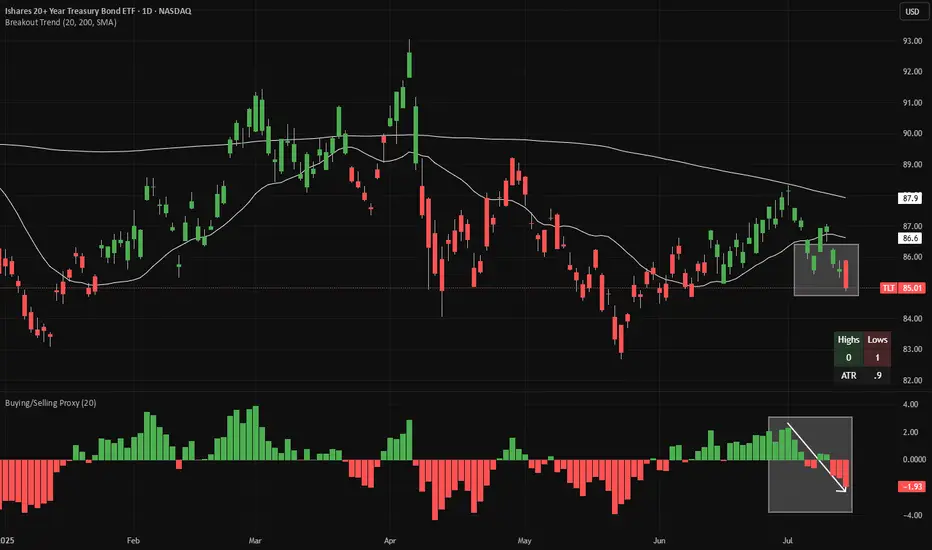
TLT short - warning signs from JapanTLT is making 20-day lows (red candles in the main chart), while continuing to make 20-week lows on a weekly chart (not shown). Meanwhile, looking at a proxy of net buying/selling (bottom panel), we have flipped from buying to selling.
Looking at Japanese bond yields, 10-year JGBs (JP10Y) just broke out of tight range. This is the third attempt to trade above ~1.59% recently, which we saw earlier today. As Japan's is one of the world's leading overseas investors, this is an obvious warning sign for bonds globally.
There is good risk/reward to short bonds here, with a stop-loss if the price closes at a 20-day high. If a 20-day high is made, the candles will change color from red to green.
Both indicators (Breakout Trend and Buying/Selling Proxy) are available for free on TradingView.
Do we continue the wedge…Bonds have been hit hard and Crypto at Ath trend lines, do we need to finish the wedge