Bitcoin Collapse Underway -75% ProbableBitcoin is collapsing, it will go deep.
As of right now, I am looking for AT LEAST a -75% selloff, with the expectation that we will soon test the 2018 price level.
This thing might be wiped out entirely.
I really don't have much else to say.
Good luck everyone.
Recession

RECESSION ALERT | Total Vehicle Sales Data Print DelayedWith last months revision of 818,000 jobs, it is probably safe to conclude that other data points have also been incorrectly reported (manipulated for political purposes).
Total Vehicle Sales for the month of August 2024 were supposed to be published today. As of 8:45 PM EST, the data STILL has not been released.. HUH??
Total vehicle sales are a leading economic indicator. I’m guessing the numbers are bad.. really bad.
In Germany, the economic powerhouse of Europe, vehicle sales collapsed in August (in August 2024).
The absence of today's scheduled print is a choice. Someone decided that Total Vehicle Sales (for the month of August 2024) would not be released as scheduled.
In addition to illustrating the obvious failures of the current US political administration, this is also a strong indicator that Tesla ( the entire green new scam ) is on the verge of bankruptcy. I will explain this in more detail later.

US 3-month bond yield - a recession signal?The US 3-month bond yield looks like it's rolling over. In recent history this has sometimes been a signal of an incoming recession.

XIU / TSX (Toronto Stock Exchange)The TSX / XIU (ETF) is going down over the next 8 months, no doubt in my mind as a Canadian. Housing is not selling, starts are being cancelled / going bankrupt, we are over-populated and our infrastructure can not handle it. The rate decreases won't save our over-leveraged banks (real-estate, mostly residential, down 20% in many areas and still barely any buyers and many looking to exit - investors primarily). No way this holds these levels.
I bought Feb 2025 $34 puts for $0.65 CAD. I expect this could be a ten bagger, especially if they finally admit Canada and USA and the world is in a massive recession. It is undeniable here. Foodbanks are empty and people are too strapped to donate (or are sick of seeing "students" from India eating "free food" meant for Canadians - many of whom are struggling).
This stock price is a joke.
Good luck to all!

DJI Collapse Imminent | Caution All AssetsThis is how we hold the finance sector accountable.
Caution in all assets.
The world economy is grinding to a stand-still.
This selloff will be deep and obviously very painful.
There are a ton of hype stories and narratives out there - I have covered and poked fun at many of the ridiculous narratives in previous posts.
We knew this day would come.

BTC will continue to increase forever, but not in the short term
COINBASE:BTCUSD , NASDAQ:NVDA , NASDAQ:COIN , AMEX:HODL , AMEX:ARKB NASDAQ:IBIT , AMEX:GBTC
The Long-Term Bullish Case
The fundamental argument for Bitcoin's long-term bullishness remains strong. The US Dollar, as the world's reserve currency, has been steadily losing value over time due to excessive government spending and quantitative easing. This inflationary environment creates an ideal backdrop for Bitcoin, which is designed to be a deflationary asset with a limited supply. As investors seek to protect their wealth from inflation, Bitcoin's appeal as a store of value becomes increasingly compelling.
Increased Institutional Investment
One of the most significant developments in the cryptocurrency market has been the growing interest from institutional investors. These large financial institutions, such as hedge funds, pension funds, and asset managers, have the potential to significantly impact Bitcoin's price and volatility.
As more institutions allocate a portion of their portfolios to Bitcoin, several positive effects can be expected:
Decreased Volatility: Institutional investors tend to be more patient and less prone to panic selling than individual investors. Their long-term investment horizons and sophisticated risk management strategies can help to stabilize Bitcoin's price and reduce volatility.
Improved Store of Value: Increased institutional adoption can enhance Bitcoin's reputation as a reliable store of value. As more mainstream financial institutions recognize Bitcoin's potential, it is likely to become a more widely accepted asset, which could boost its price and strengthen its position as a hedge against inflation.
Increased Liquidity: Institutional participation can increase the liquidity of the Bitcoin market, making it easier for investors to buy and sell the cryptocurrency without significantly impacting its price. This can further contribute to price stability and reduce volatility.
While the fundamental factors supporting Bitcoin's long-term bullish case remain strong, the technical analysis suggests a short-term bearish trend may be in play.
Bitcoin is currently trading within a descending channel, a technical pattern that indicates a potential downtrend. This negative channel is formed by two downward-sloping lines that constrain the price action. As long as Bitcoin remains within this channel, there is a risk of further price declines.
Additionally, a bearish crossover has occurred between Bitcoin's 100-day and 50-day moving averages and the 200-day moving average. This technical indicator is often used to identify potential trend reversals. When the shorter-term moving averages (100-day and 50-day) cross below the longer-term moving average (200-day), it is generally considered a negative signal, suggesting that the price may be heading lower.

Yield Curve Inversion: A Warning Sign You Can't IgnoreThe yield curve, which shows the difference between short-term and long-term interest rates on government bonds (US10Y-US02Y). In normal market conditions, this number should be positive because the interest that investors require on 10Y bonds is higher than the interest required on 2Y bonds. Interest is a value of risk perception. Higher risk of default means higher required interest on bonds.
As seen on the chart, the moment that the yield-curve "un-inverts" (yellow circles) is a critical market indicator that can often predict upcoming recessions.
In the last 35 years, the un-inversion has always preceded a dump in stock prices and a recession.
Seeing this chart, it's not too far-fetched to assume that the world will go into a recession at some point in the next 1-2 years.

RECESSION ALERT - Homebuilders WAY Overbought | SHORT $KBHLeverage. It's a beautiful thing.
There is not much to say about this one, the chart speaks for itself.
Brief Disclaimer: this chart has evaded me - I personally think it should have corrected awhile ago (see grey arrows). Nonetheless, I never bought it... WHY?:
The economy is now well into a recession (has been for at least a year). For whatever reason this thing was bought into the stratosphere.
Now comes profit-taking and the COLLAPSE! This baby is going DEEP!
Thank you for playing.
💀💀💀

Disney About to Give it Up! | $DIS SHORTLooks like the moment of truth for Mickey & Co.
I have been covering this one for a long time, with numerous mentions that Disney is a sell / short.
How low this thing will go, we do not know. Right now I am comfortable saying, -50% is probable.
While there are many factors in play, the broader economy is weak and Disney has done nothing but push people away with their radical political positions. Additionally, the destruction of "woke" mob is unfolding before our eyes.
Short Disney. Make Money.
If this changes, I will update.

Knock Knock. Who's There? Vibecession Ft. US Interest RatesHello Everyone,
IMPORTANT: ALL FED POLICIES LEAD TO NEGATIVE OUTCOMES
TLDR AT THE END
In February 2022 the Federal Reserve gave us the fastest rate raising campaign in history to try and combat very high inflation, but they were very late in raising rates causing one of the worst inflation in 40 years. During his speech at Jackson Hole he confirms rate cuts in September due to inflation being under control and the labor market "cooling." Good news is inflation is under control, however this is only the start of our labor market "cooling."
Jerome Powell is extremely late in cutting rates and will be cutting rates because we are getting BAD economic data and the cracks are showing in our labor market, commercial real estate, and banking sectors.
The Federal Reserve 100% KNOWS a recession is coming that is why they are cutting rates. We have Jerome Powell come up on stage sweet talk to us about a soft landing, inflation under control, and how he will cut rates to help the labor market. He's not going to be instilling fear in Americans as a chairman.
Just Remember, ALL FED POLICIES LEAD TO NEGATIVE OUTCOMES. Recession is coming, Sahm rule and inverted yield curve hasn't been wrong and it won't be wrong this time. This time it's not different.
TLDR: Jerome Powell is too late in cutting rates causing a recession

Federal Reserve is Behind the Curve, Recession is 100% CONFIRMEDHello everyone,
The federal reserve has kept interest rates at near zero and printed the MOST money in US history back in 2020 and this has caused one of the worst inflation in 40 years. Jerome Powell decided to fight inflation by giving us the fastest rate raising campaign in history. He has kept rates too high for too long and we are now guaranteed a recession. Jerome Powell will find himself in a position to cut rates very fast due to the cracks in the job market. It is already too late we will be witnessing a huge spike in unemployment. Who knows how high this can go, back in 1929 unemployment hit 24.9%.

SPX TOP History Repeats Itself AgainHello everyone,
We may be entering a very powerful recession. We get a good crash about every 100 years and history is repeating itself again. We went into the great depression during the 1929s and the stock market did not reach it's highs again for the next 37 years. We find ourselves in the same situations eerily similar to 1929.

Recession After Fed Rate Cut?Are we heading toward recession? To answer this question, I'm pulling the recession prediction indicator based on GDP provided by FED (ticker:JHGDPBRINKDX) which is the purple color on the bottom chart. It shows that we are on fairly low probability of recession (around 4%) as of end of Aug 2024. The FED indicates it will cut rate on end of Sep 2024.
However, if we look back of history of recession based on GDP indicated by FED data (ticker: JHDUSRGDPBR) which is the pink color. It shows that recession only happen right after FED cut rate as show by lime color (ticker:FEDFUNDS). It hard to believe that recession is caused by the FED cutting rate. Or the FED will only cut rate if we are heading toward recession? At least from the past history of rate cut we can see high chance of recession happening after the FED cut rate. And during the recession we can see that S&P500 are falling. So will there be another crash coming after Sep 2024? Please comments below.

Is Warren Buffett Losing Faith in Bank of America?A Strategic Shift with Far-Reaching Implications
Warren Buffett, the legendary investor and CEO of Berkshire Hathaway, has taken a significant step that has sent ripples through the financial world. Berkshire, a long-time major shareholder of Bank of America (BofA), has been steadily selling its stake in the bank. This strategic move, totaling over $3.8 billion in sales, has raised eyebrows and sparked speculation about the future of BofA.
Buffett's decision to reduce Berkshire's holdings in BofA is a departure from his typical investment strategy, which often involves long-term, unwavering commitments. This shift raises questions about his perception of the bank's prospects and the broader financial landscape.
The implications of this move extend beyond Berkshire and BofA. As one of the most closely watched investors in the world, Buffett's actions can influence market sentiment and investor behavior. His decision to sell BofA shares could signal a potential shift in his outlook on the banking sector or broader economic conditions.
To learn more about the reasons behind Buffett's decision, the potential impact on Bank of America, and the broader implications for the financial sector, please visit our website.

SP500 MAJOR RECESSION COMING...The unemployment rate has been steadily rising for the past year, which as seen on the comparison regularly precedes major economic downturn.

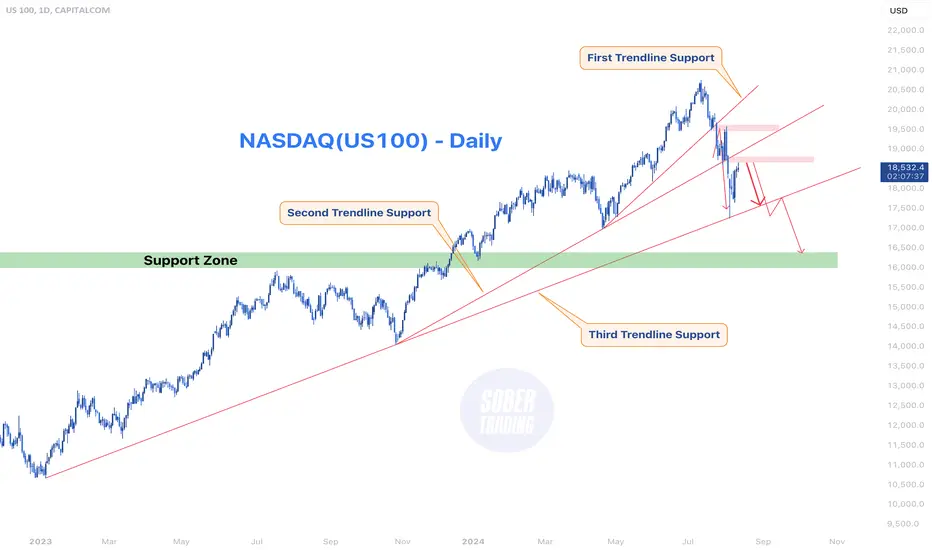
NASDAQ - US100 Facing Bearish PressureThe CAPITALCOM:US100 index is currently facing significant downward pressure, largely due to mounting concerns about the U.S. economy. The potential for a recession is growing as recent data points to an increase in unemployment claims, and the Federal Reserve has decided to delay interest rate cuts. This has created uncertainty in the markets, as higher unemployment could lead to reduced consumer spending, further exacerbating the economic slowdown. The anticipation of prolonged higher interest rates is also weighing on investor sentiment, making the stock market, particularly tech-heavy indexes like NASDAQ, more vulnerable to declines.
Technically, the BLACKBULL:NAS100 index has been following a clear pattern of reactions to its trendlines. The index recently fell and touched the third trendline support, which has historically been a critical level for determining market direction. After this touch, the index attempted a recovery, moving back towards the second trendline, which now acts as a breakeven point. However, the failure to break through this level and the subsequent rejection suggests that the bears are firmly in control. The pattern indicates that the index may face further declines, particularly if it breaches the third trendline support.
In conclusion, both fundamental and technical factors are pointing towards a bearish outlook for the NASDAQ index. The rising possibility of a recession, driven by increasing unemployment claims and the Fed’s cautious approach to rate cuts, has dampened investor sentiment. On the technical side, the index’s inability to reclaim key trendline supports indicates that more downside is likely. As a result, investors should be cautious and prepared for potential further declines in the NASDAQ index in the coming weeks.
Sector Rotation in Anticipation of Rate CutsMarkets have rebounded sharply after last week's fear-driven decline. Despite this, rate cuts are still anticipated in the upcoming FOMC meetings. Changes in monetary policy often benefit some sectors over others, providing investors a chance to adjust their portfolio allocations accordingly.
This paper delves into a comparative analysis of sectors around monetary policy pivots to highlight how a spread between S&P Financials Select Sector and S&P Utilities Select Sector stands to benefit in the coming months. It also describes a hypothetical trade setup using CME E-Mini S&P Select Sector futures which can be used to express the view in a margin-efficient manner.
RATE CUTS WILL HURT FINANCIAL FIRMS
Financial firms benefit significantly from higher rates, as these drive net interest margin (NIM) expansion, boosting their bottom line. However, when rates start to decrease, this positive impact reverses.
The Financials Select Sector ETF (XLF) is comprised of 25% banks, 31% financial services firms, and 16.6% insurance firms. All these firms have benefited from higher rates, albeit the strongest impact may be limited to banks and insurance firms whose overall bottom line is significantly impacted by expanding NIM.
In the last three monetary policy pivots, XLF has declined by an average of 5.6% over the following six months. Conversely, at the start of rate hikes, the ETF has typically risen by an average of 3.7% in the subsequent six months. While the most recent pivot in 2019 saw an increase in XLF, the overall average trend suggests a decline.
The trend is visible even when examining the relative performance of XLF and SPX. Following rate cuts, the spread declined by an average of 2.8% while during rate increases, it declined by just 1.1%.
There is another headwind facing the XLF ETF, particularly banks – rising credit delinquencies. Credit card delinquencies are especially concerning as they stood at the highest level in 13 years as of Q1 2024. Overall delinquencies are also rising and near the highest level since 2021.
Updated data from the New York Fed has shown that conditions remained stressed in Q2 with total delinquencies at 3.2%. Particularly concerning were severe (>90 days delinquent) credit card delinquencies at a staggering 10.93%. Consumers are increasingly relying on unsustainable credit card debt to cover expenses. As delinquencies remain elevated, issuing banks must increase loan loss provisions which impacts earnings directly.
Source: New York Fed
As credit card usage becomes unsustainable, another class of companies in XLF – payment processors - will also be hurt. The largest payment processors (Visa, Mastercard, and Amex) represent nearly 15% of the XLF index.
RATE CUTS WILL BENEFIT UTILITY FIRMS
Unlike financial firms, utility companies have struggled in a high-rate environment. As their huge capital expenditure is often fueled by debt, higher rates result in narrower profits.
As rates decline, debt payments decrease, leading to expanded profit margins for utility firms. Historically, the ETF has shown a significant average increase after rate hikes and a smaller increase after rate cuts. This behavior might be due to investors anticipating a weakening economy following rate cuts, which would favor utility firms. However, the index tends to correct later once rates remain elevated for some time.
The impact is close to even when comparing the relative performance against the broader S&P 500 with both periods resulting in a ~6% increase in the spread.
Utility firms are also likely to outperform in case of a US recession. Although some of the concerning economic data has normalized over the past week, the risk of a recession in the US persists. As utility firms provide essential services, their cash flows are relatively stable even during recessions. While consumers may cut down on discretionary spending, spending on essential services remains unaffected.
Mint Finance previously covered these factors in a separate paper.
HYPOTHETICAL TRADE SETUP
A pivot in Fed Policy is expected in the upcoming FOMC meetings with the CME FedWatch tool signaling 100 basis points of rate cuts in 2024 itself. Rate cuts will impact different sectors differently. While utility firms stand to benefit from lower rates, financial firms may see lower profits.
Source: CME FedWatch
The spread between CME E-Mini Utilities Select Sector Futures (XAU) and CME E-Mini Financial Select Sector Futures (XAF) has been rising since March as it has favored XAU. The spread responded strongly to a shift in rate cut sentiment as well as the recession signal at the start of the month.
The recent correction over the past week offers an improved entry point into the spread.
A hypothetical trade setup using XAU futures expiring in September (XAUU2024) and XAF futures expiring in September (XAFU2024) is described below. CME offers margin offset totaling 60% for this spread reducing the capital requirement to USD 3,740.
MARKET DATA
CME Real-time Market Data helps identify trading set-ups and express market views better. If you have futures in your trading portfolio, you can check out on CME Group data plans available that suit your trading needs tradingview.com/cme.
DISCLAIMER
This case study is for educational purposes only and does not constitute investment recommendations or advice. Nor are they used to promote any specific products, or services.
Trading or investment ideas cited here are for illustration only, as an integral part of a case study to demonstrate the fundamental concepts in risk management or trading under the market scenarios being discussed. Please read the FULL DISCLAIMER the link to which is provided in our profile description.

Why are Interest rates falling? Time to buy? We have seen an amazing fall in interest rates.
Bonds have looked to put in a local bottom.
Why are bonds showing signs of accumulation?
Is the bond market pricing in a recession?
I believe the recent decline in yields is due to commodity weakness.
Yields have soften because energy & base metals have become cheaper.
This drives the disinflationary narrative.
I think its to early to tell whether this decline is from demand or global weakness.

Yield ChartThis chart tracks U.S. Treasury yields for 2-year (blue), 10-year (white), and 30-year (orange) bonds, along with the yield spread (green) between the 10-year and 2-year bonds. A positive spread suggests a normal yield curve and economic growth, while a negative spread (inversion) often signals a potential recession.

ANF reversal or dead-cat bounce?
NYSE:ANF
ANF has recently pulled back from its all-time high (ATH) following its latest earnings report. Despite strong earnings, same-store sales, and electronic sales growth, and a dynamic inventory selection, concerns about a potential recession have weighed on the stock.
Key Developments:
Recently dropped below the 100-day Moving Average (MA)
Retested the 200-day MA
Bounced off the 200-day MA
Broke out of a triangle formation on a 15-minute timeframe
Broke above the 100-day MA but failed to break above previous support
Expected Outcomes:
Bullish scenario: If ANF bounces off the 100-day MA and reclaims the previous support level, it could retest the 50-day MA, coinciding with the upper limit of the current negative channel. In this case, I would consider near-term put options to hedge against a potential retest of the 200-day MA.
Bearish scenario: If ANF fails to hold above the 100-day MA and the $150 support level, it is likely to retest the 200-day MA.
I am closely monitoring the $150 level and will make decisions based on price action this week. Given the current macro environment, I prefer to be short this position. If the bullish scenario unfolds, I will wait for a retest of the upper channel limit before taking action. With key economic data, including retail sales, being released this week, expect volatility. Regardless of my position, I plan to be short-term and exit before the next earnings report.

WING head and shoulders
NASDAQ:WING
WING has recently broken out of a previous upward channel following positive earnings and raised guidance. This pattern resembles a head and shoulders formation, and a neckline break could at least trigger a retest of the 200-day MA.
Key Developments:
Uptrend channel breached.
Retested bottom of previous channel, failed to break through.
Dropped below 100-day MA, subsequently retested and failed to hold above.
Expected Outcomes:
Bullish Scenario: WING breaks above the upper boundary of the current falling wedge, coinciding with the 100-day MA resistance. In this case, I would exit the position.
Bearish Scenario: WING fails to surpass the upper wedge boundary and retests the lower boundary, aligning with previous support and the potential 200-day MA. A subsequent lower high would confirm the head and shoulders pattern, targeting a price of $270-285.
Economic Considerations:
While declining interest rates are anticipated due to recession fears, this could negatively impact consumer spending, including dining out. WING's franchise-heavy business model may be affected by franchisees delaying store openings in anticipation of lower interest rates and improved economic conditions.

Bitcoin Down 14% from Halving Event: What Happens from HereThree posts ago, we discussed the intricate relationship between Bitcoin’s halving events and broader economic conditions. The recent market developments have indeed proven this connection, as Bitcoin has experienced a significant 14% drop since the halving event on April 20th 2024.
Context of the Recent Market Crash
Several factors have contributed to Bitcoin's recent decline:
1. Macro-Economic Conditions : The Bank of Japan's rate hike on July 31, 2024, significantly impacted global markets. This move made borrowing more expensive, disrupting the carry trade involving the yen and causing a ripple effect across various asset classes, including cryptocurrencies.
2. Market Sentiment and Sell-offs : The anticipation of Mt. Gox creditor repayments, releasing around $8 billion worth of Bitcoin into the market, created fear among investors, prompting a sell-off that drove prices down to as low as $53,600.
3. Broader Equity Market Decline : Global equity markets have also been under pressure, with major indices experiencing significant losses. This broader market downturn has influenced Bitcoin's price, as investors often sell off riskier assets during periods of economic uncertainty
It's Not All Doom and Gloom
Over the long term, Bitcoin has always shown resilience and growth, particularly in the years following a halving event. Historically, Bitcoin's price tends to experience significant increases 6-12 months after each halving. This pattern has been consistent across the previous three halving events:
2012 Halving: Bitcoin surged from around $12 to over $1,000 within a year.
2016 Halving: Bitcoin climbed from approximately $650 to nearly $20,000 within 18 months.
2020 Halving: Bitcoin soared from $8,000 to over $60,000 in the following year.
These historical trends indicate that despite short-term volatility and market downturns, Bitcoin has a strong track record of long-term growth. This resilience is driven by the fundamental principle of reduced supply through halvings, which creates scarcity and can drive demand.
Position Update from Our Trend Model
The Model had gone cash one day prior to the sell-off, resulting in a small loss of 6% from the long entry price back in July, the model was however able to avoid what was to come after that, which was a 20% drawdown within 72 hours. The model remains bearish for the medium term and we'll update in another post when the time comes.
As always, it is crucial to conduct thorough research and consider both macroeconomic factors and market sentiment when making investment decisions. Stay tuned for more updates and insights as we continue to monitor the evolving market conditions and their impact on primarily crypto 🚀.

Russell 2000 fractal points to 40-60% dropRussell 2000 currently creating fractal.
Points to possible 40-60% downside.
This fractal creates:
- A top
- A bear flag
- A failed break to the upside
- A large break down after the failed break up
This fractal occurred in 2008 and 2020.
Both instances of recessionary bear markets.
This could play out similarly if we get a recession.
Price target is around 95 -100.
