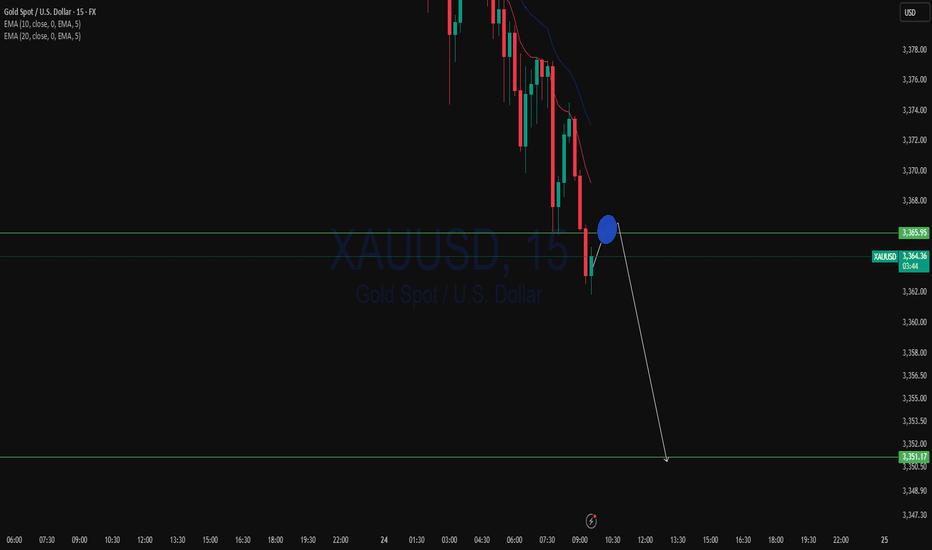
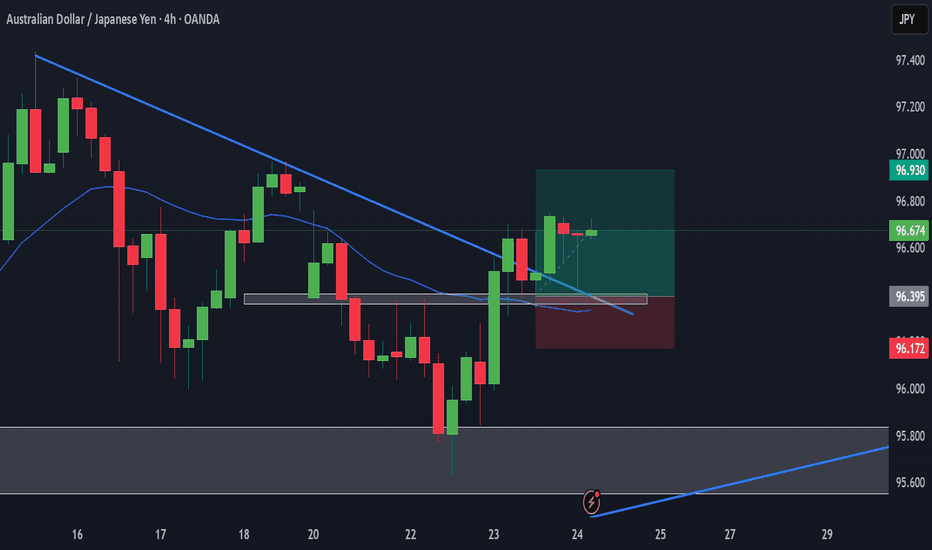
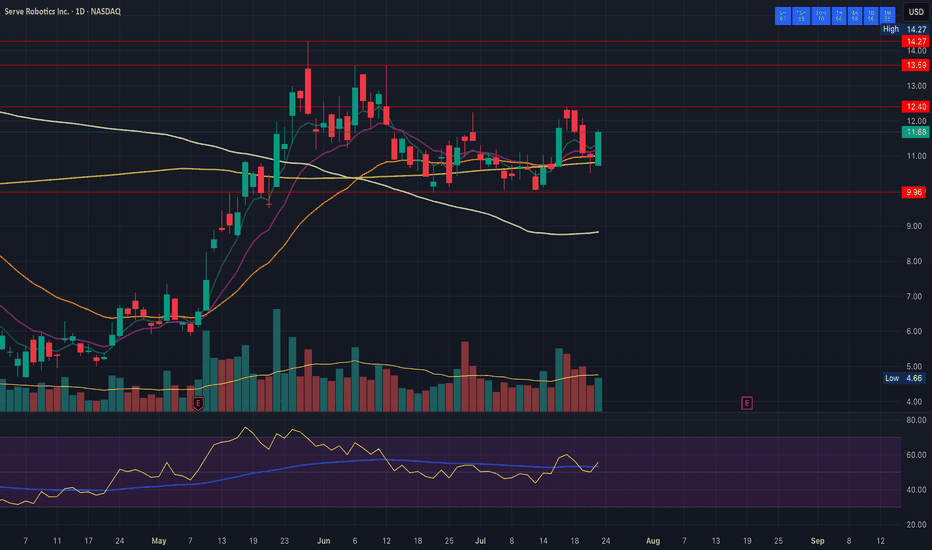
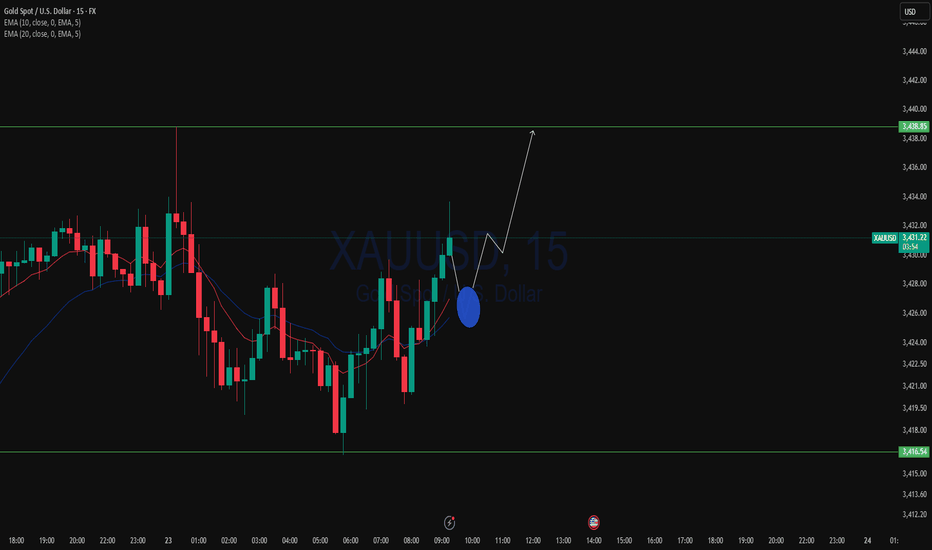
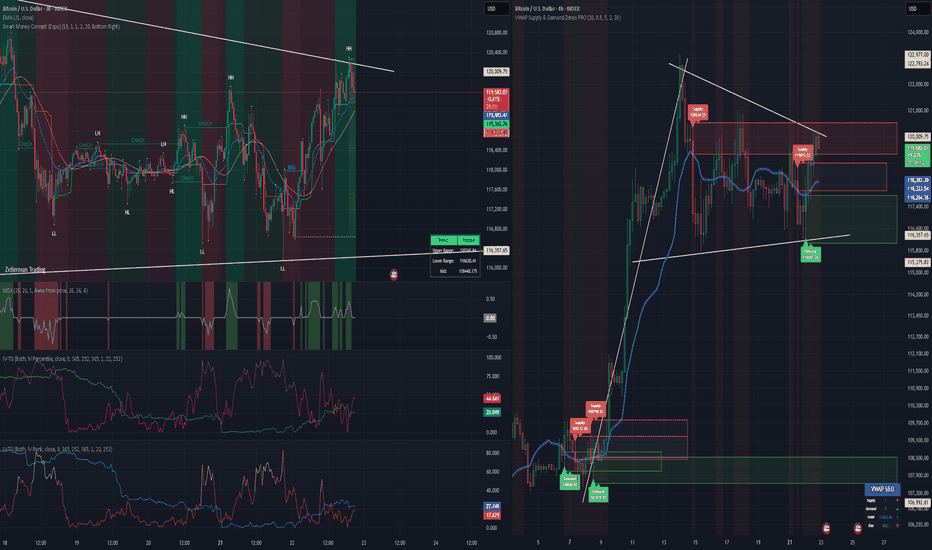
XAUUSD Top-down analysis Hello traders, this is a complete multiple timeframe analysis of this pair. We see could find significant trading opportunities as per analysis upon price action confirmation we may take this trade. Smash the like button if you find value in this analysis and drop a comment if you have any questions or let me know which pair to cover in my next analysis.
X-indicator
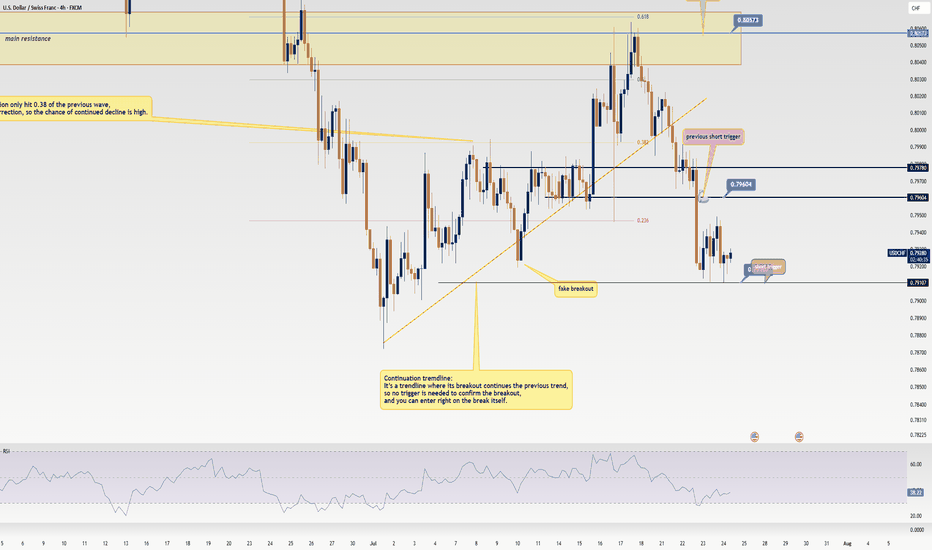
USD/CHF Update: Missed the Last Short? Grab the New Trigger!Yo traders and market lovers, it’s Skeptic from Skeptic Lab! Here’s a quick USD/CHF update: my last short trigger after the support break gave us a 50-pip drop . With a solid stop loss, you’re likely sitting on a 2:1 R/R; risk-takers might even be at 5:1. I’m breaking down a fresh trigger in this video—don’t miss it! Drop your thoughts or coin requests in the comments, give it a boost if it helped , and don’t miss my educational post coming tonight on Skeptic Lab’s TradingView page with lessons from my first 100 trades—it’s gonna be fire. Catch you tonight! 😎
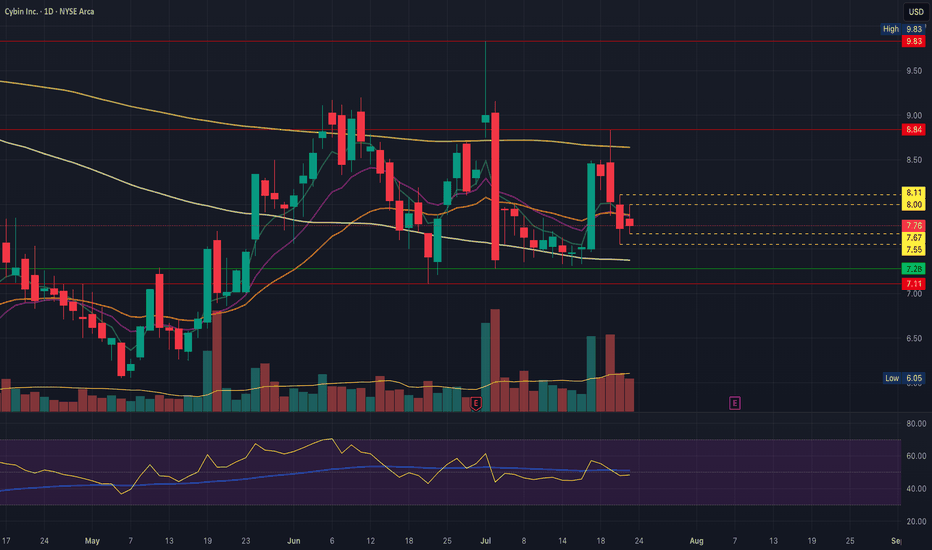
CYBN remains in daily equilibriumCYBN remains within a wide daily equilibrium, we have an inside bar today for early clues to get an early gauge on direction. Nothing changes for me as long as price remains between 7.11 and 8.84, and we can remain tightening within this range for another couple of weeks..
Support: 7.67, 7.55, 7.28, 7.11 key
Resistance: 8.00, 8.11, 8.847 key
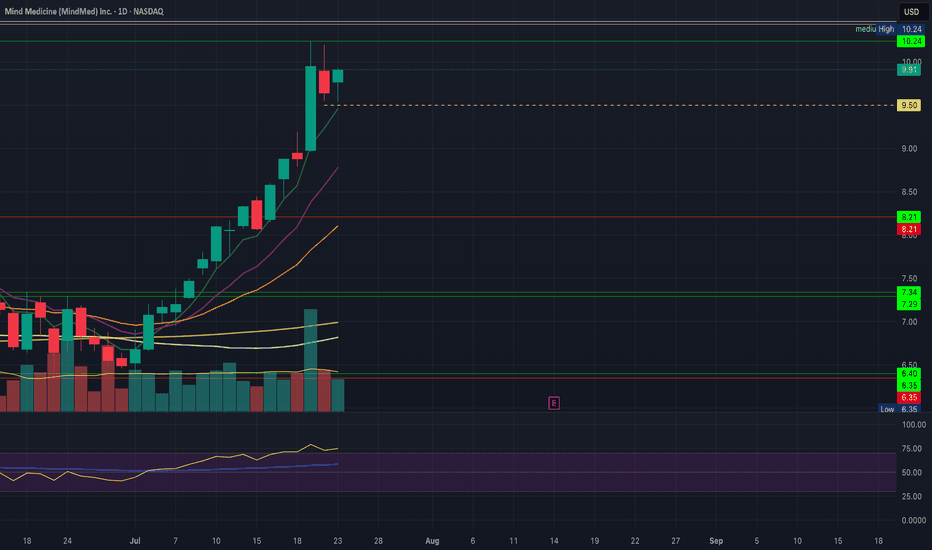
MNMD Daily bullflag below key resistance on monthly timeframe MNMD bulls are setting up a daily bullflag just below key monthly resistance at 10.44, the break of which would confirm the monthly trend change for the first time in the history of the chart. 10.24 key short term resistance to confirm the bull flag.
Support: 9.50, 9.00, 8.79, 8.51, 8.43
Resistance: 10.24, 10.44, 10.47, 11.00, 11.22
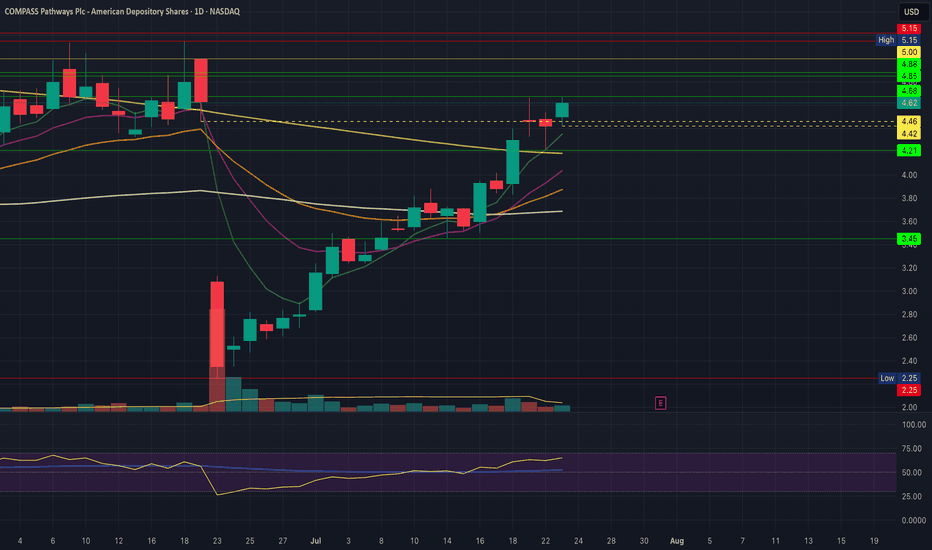
CMPS bulls trying to confirm the daily bullflagCMPS bulls attempting to confirm the daily bullflag and keep the very impressive bounce going, If we reject tomorrow anticipate a 4hr equilibrium and we'll look for a higher low above 4.21 and a tightening range for the next few days.
Support: 4.42, 4.21
Resistance: 4.68, 4.85, 4.88, 5.00
ATAI bulls confirm daily bullflagATAI bulls bought the dip for the third day in a row off of 3.31 support and V-shaped to a new high of day. As mentioned in previous videos we are now in a medium volume node so price can move through this area a bit more easily. Beware of short term extension, I wouldn't be a buyer up here but I see no reason to be a seller.
Support: 3.77, 3.75, 3.68, 3.31
Resistance: 3.90, 4.00, 4.08, 4.17, 4.52
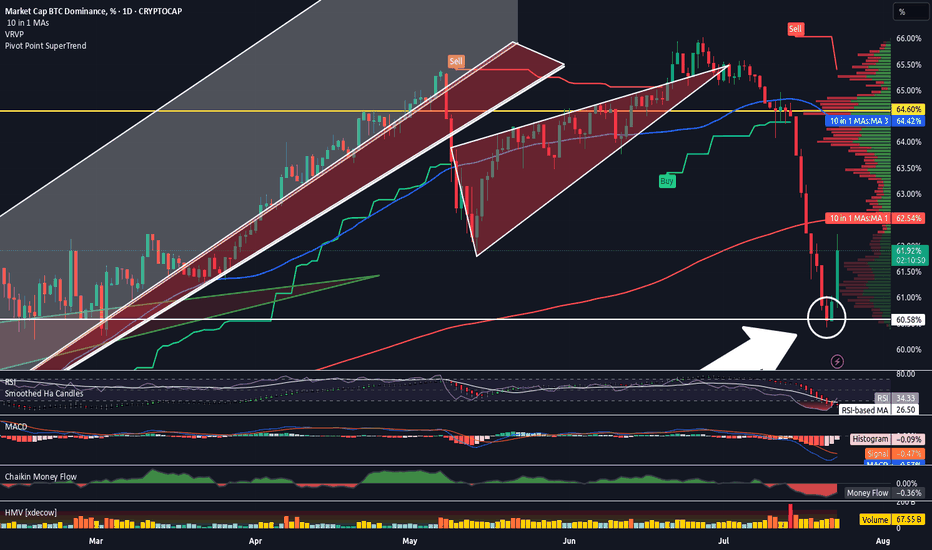
Altcoin Season Has Started. And A Quick Look At The Stock MarketHey Traders,
Time for me to catch you up on the latest price action in both the stock market and crypto as well as touch upon a few changes on my platform and subscription services and what I plan for the future.
Timestamps:
00:00 | Housekeeping - site changes, etc
04:35 | BTC Dominance
06:45 | DXY Dollar Chart
10:00 | SPY
14:25 | BTC Bitcoin Chart
15:45 | Bitcoin Liquidity Heatmap
17:30 | Solana
19:05 | Ethereum
20:20 | Crypto & Stock Trackers
24:25 | My Indicator
26:10 | Where I Went Wrong & How I Plan To Course Correct
✌️ Stew
Bullish Continuation on Silver. 4 Areas To TargetWhen we last visited Silver we were looking at a Bullish Daily Chore opportunity. That opportunity played out nicely and now that we've officially violated the most recent structure high, it should be relatively smooth sailing to our next level of structure from back in 2011.
I say relatively, because the most conservative target area is right above current price, but don't worry, because in this video we'll discuss how there will still be plenty of trading opportunities, even if you choose to wait for a sign after that initial level.
If you have any questions or comments, please leave them below. Also, if you want to share your analysis that's always helpful for the community.
Akil
Review and plan for 24th July 2025Nifty future and banknifty future analysis and intraday plan.
Quarterly results.
This video is for information/education purpose only. you are 100% responsible for any actions you take by reading/viewing this post.
please consult your financial advisor before taking any action.
----Vinaykumar hiremath, CMT
AW1 analysisIgnore the below write-up and watch the video.
Lorem Ipsum is simply dummy text of the printing and typesetting industry. Lorem Ipsum has been the industry's standard dummy text ever since the 1500s, when an unknown printer took a galley of type and scrambled it to make a type specimen book. It has survived not only five centuries, but also the leap into electronic typesetting, remaining essentially unchanged. It was popularised in the 1960s with the release of Letraset sheets containing Lorem Ipsum passages, and more recently with desktop publishing software like Aldus PageMaker including versions of Lorem Ipsum
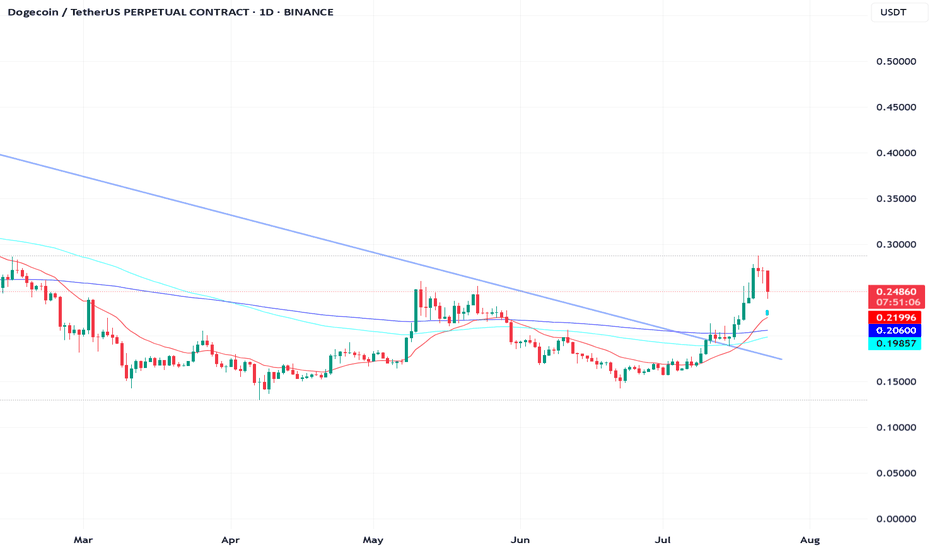
accumulation phase means bullish sentiment We are seeing a bullish scenario in an accumulation phase, we should be seeing doge test the 200 ema before bouncing back or test the 20 ema before bouncing back. we see a change in character which as short lived after a day's breakout. After a 7 day's rally after breaking out of the 200 ema, we see a pull, I THINK WE SHOULD BE SEEING MORE OF THAT UNTIL BUYERS ARE CONVINCED THE MARKET IS NOT JUST FOLLOWING THE SUMMER RALLY TREND
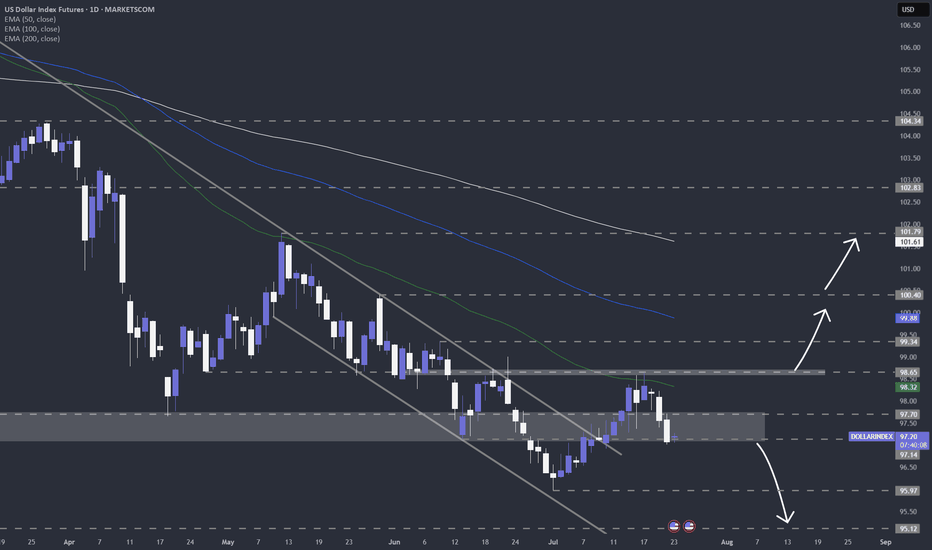
US dollar index (DXY) still looks weakAfter finding resistance near my 50-day EMA on the daily chart, TVC:DXY is now showing signs of continued weakness. Let's dig in.
MARKETSCOM:DOLLARINDEX
Let us know what you think in the comments below.
Thank you.
75.2% of retail investor accounts lose money when trading CFDs with this provider. You should consider whether you understand how CFDs work and whether you can afford to take the high risk of losing your money. Past performance is not necessarily indicative of future results. The value of investments may fall as well as rise and the investor may not get back the amount initially invested. This content is not intended for nor applicable to residents of the UK. Cryptocurrency CFDs and spread bets are restricted in the UK for all retail clients.
XAUUSD Analysis todayHello traders, this is a complete multiple timeframe analysis of this pair. We see could find significant trading opportunities as per analysis upon price action confirmation we may take this trade. Smash the like button if you find value in this analysis and drop a comment if you have any questions or let me know which pair to cover in my next analysis.
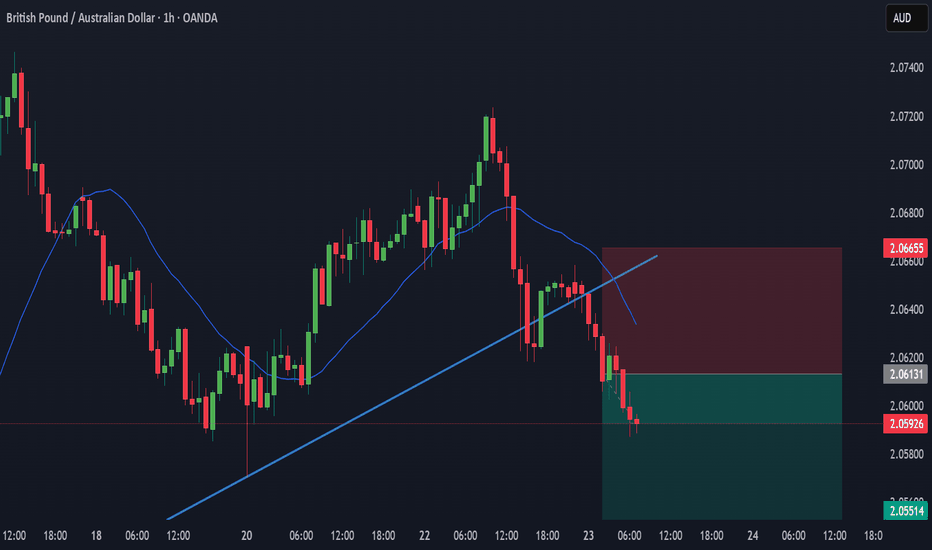
WOULD YOU TAKE THIS TRADE? GBPAUD SELLAll the information you need to find a high probability trade are in front of you on the charts so build your trading decisions on 'the facts' of the chart NOT what you think or what you want to happen or even what you heard will happen. If you have enough facts telling you to trade in a certain direction and therefore enough confluence to take a trade, then this is how you will gain consistency in you trading and build confidence. Check out my trade idea!!
www.tradingview.com
Review and plan for 23rd July 2025Nifty future and banknifty future analysis and intraday plan.
Quarterly results.
This video is for information/education purpose only. you are 100% responsible for any actions you take by reading/viewing this post.
please consult your financial advisor before taking any action.
----Vinaykumar hiremath, CMT
Gold silver7.22 2025 gold is at a pivotal Junction and it looks bullish but it's come to ABCD patterns and reversal patterns that indicate that it could go lower and the silver it doesn't look quite the same but it's moving to levels that it hasn't been for a long period of time so this may indicate the possibility of a breakout higher. There are more details in the video and I think that coffee May go higher even though it may not look like a good trade but it's a trade you can take with very small risk and I talk about it more in the video. Palladium traded to an ABCD pattern and it looks very bullish but anything that looks like an ABCD pattern that's been filled you have to be concerned that it's going to reverse and take the market in the other direction.
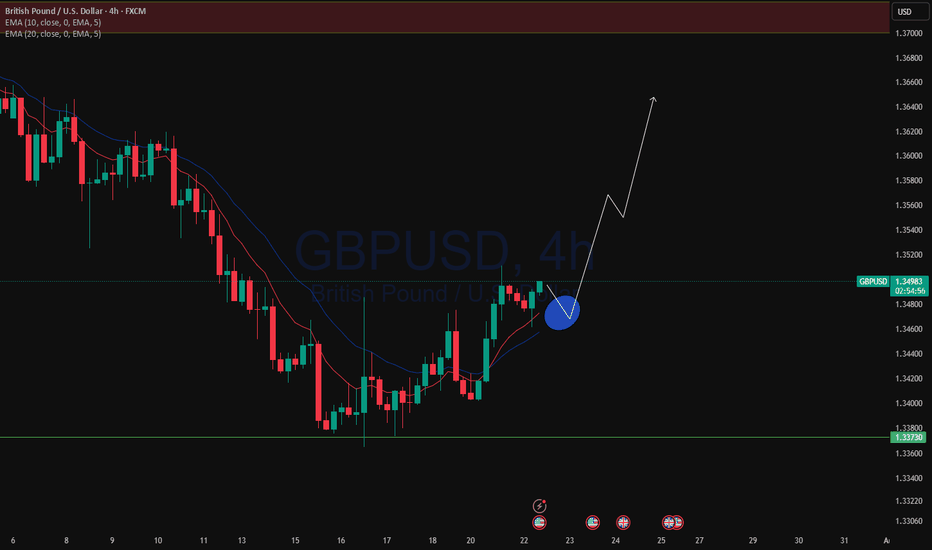
EURUSD and GBPUSD Analysis todayHello traders, this is a complete multiple timeframe analysis of this pair. We see could find significant trading opportunities as per analysis upon price action confirmation we may take this trade. Smash the like button if you find value in this analysis and drop a comment if you have any questions or let me know which pair to cover in my next analysis.
