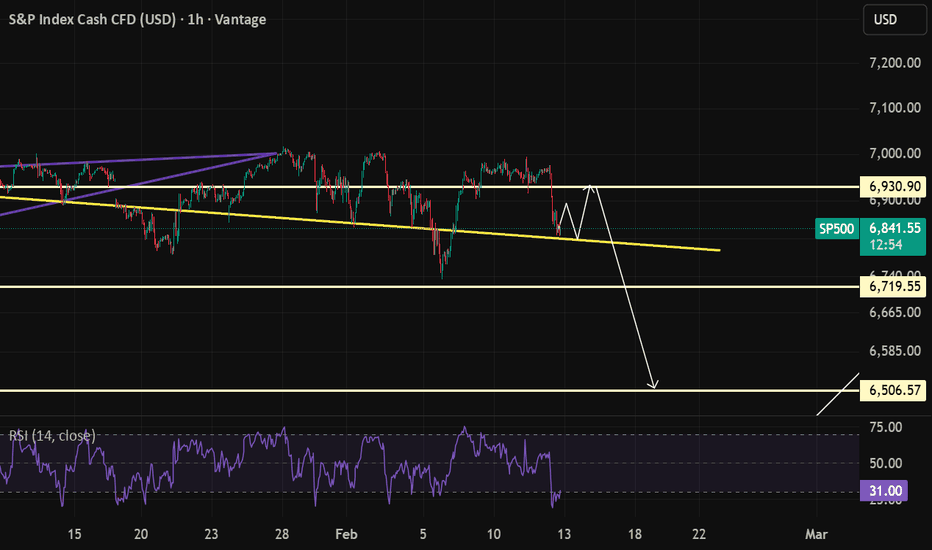
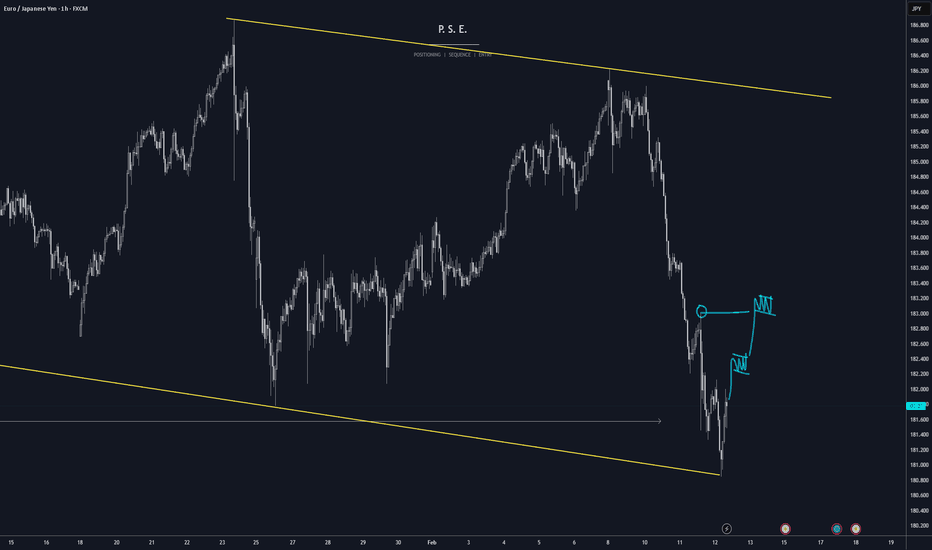
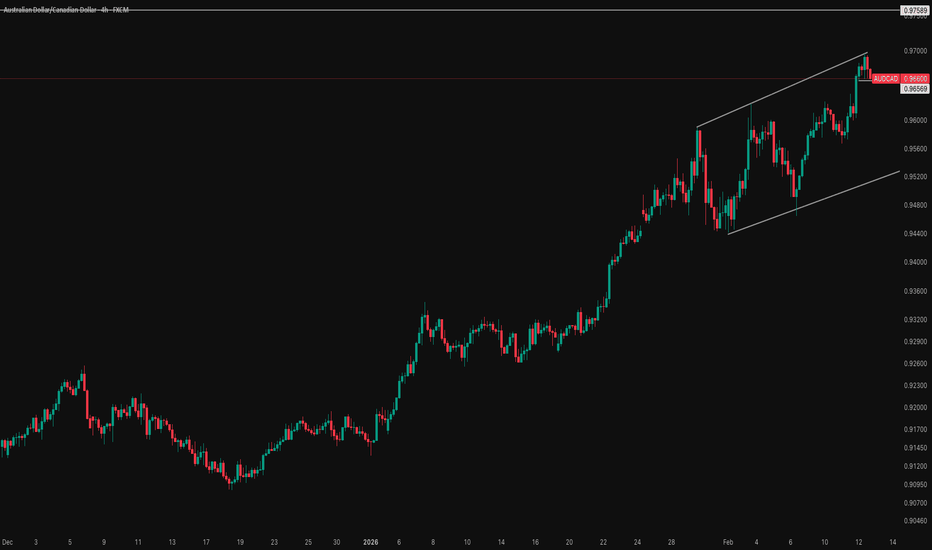
Unisawp Coin (UNI): Expecting Another Smaller Bounce From HereUNI has a good chance for a potential long-term spot trade but what is more interesting to us is what is happening on the smaller timeframes, where we are expecting a good long setup to form!
More in-depth info is in the video—enjoy!
Swallow Academy
Chart Patterns
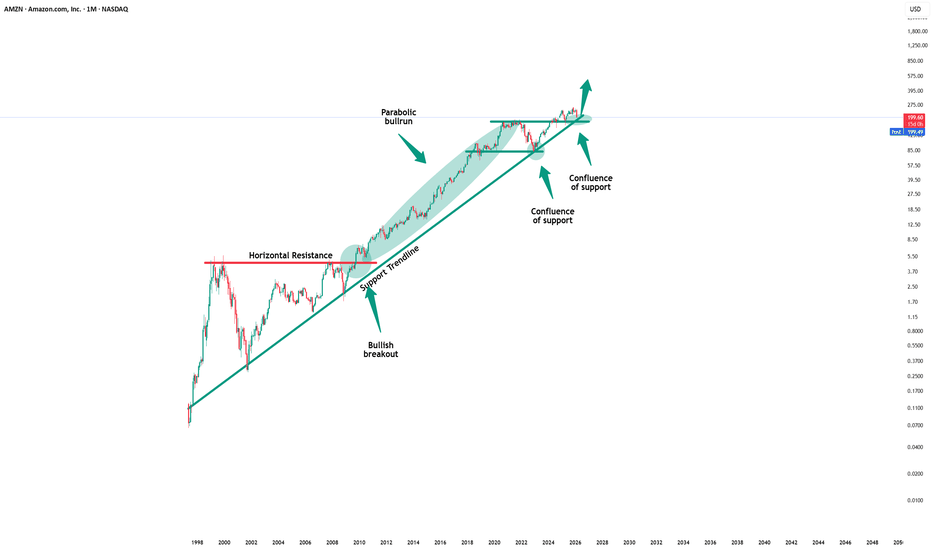
Amazon - This stock is still 100% bullish!🎉Amazon ( NASDAQ:AMZN ) just remains totally bullish:
🔎Analysis summary:
This month alone, Amazon is down about -15%. But looking at the higher timeframe, the underlying uptrend still remains incredibly strong. And even if Amazon drops another -15%, it will retest a significant support and subsequently head for new all time highs.
📝Levels to watch:
$175
SwingTraderPhil
SwingTrading.Simplified. | Investing.Simplified. | #LONGTERMVISION
Oracle - The worst drawdown ever!💣Oracle ( NYSE:ORCL ) will ends its bearmarket soon:
🔎Analysis summary:
Over the past five months, Oracle has been correcting more than -60%. And while we can clearly witness a major selloff, Oracle is also approaching a major support area. And if we see bullish confirmation in the near future, Oracle might even create new all time highs.
📝Levels to watch:
$125
SwingTraderPhil
SwingTrading.Simplified. | Investing.Simplified. | #LONGTERMVISION
Netflix - Finally approaching support!🎥Netlix ( NASDAQ:NFLX ) will soon reverse higher:
🔎Analysis summary:
The recent -40% correction on Netflix was totally expected. But slowly, Netflix is approaching a major confluence of support at the previous all time high. If we see a final -15% drop, Netflix can then reverse towards the upside and head for new all time highs.
📝Levels to watch:
$65
SwingTraderPhil
SwingTrading.Simplified. | Investing.Simplified. | #LONGTERMVISION
The XAUUSD Monster Trade is Alive & Well: My Next Move for GOLDIn this video I reveal the mechanics behind my "Monster Trade" strategy specifically for XAUUSD. You will learn how to scale into winning positions, mathematically remove risk by banking 50% profits, and leave "runner" positions active to capture massive macro moves. This isn't about scalping; it's about building life-changing wealth by riding the higher-timeframe bullish bias.
Bulleted Key Takeaways
💰 The 50% Rule: How to bank early profits to create a "risk-free" buffer for long-term holds.
📈 Pyramiding Logic: The exact way to add positions on pullbacks without over-leveraging.
🛡️ Psychological Edge: Why having a "capital buffer" eliminates the fear and anxiety of market volatility.
🎯 Targeting 10,000 R: Visualizing the power of compounding runners over months, not minutes.
Intel - The final bullish breakout!🚀Intel ( NASDAQ:INTC ) is attempting to break out:
🔎Analysis summary:
Over the past 25 years, Intel has overall been just consolidating. But recently, Intel retested massive support and already created a rally of more than +100%. And at this exact moment, Intel is about to create the final breakout before we see new all time highs.
📝Levels to watch:
$50
SwingTraderPhil
SwingTrading.Simplified. | Investing.Simplified. | #LONGTERMVISION
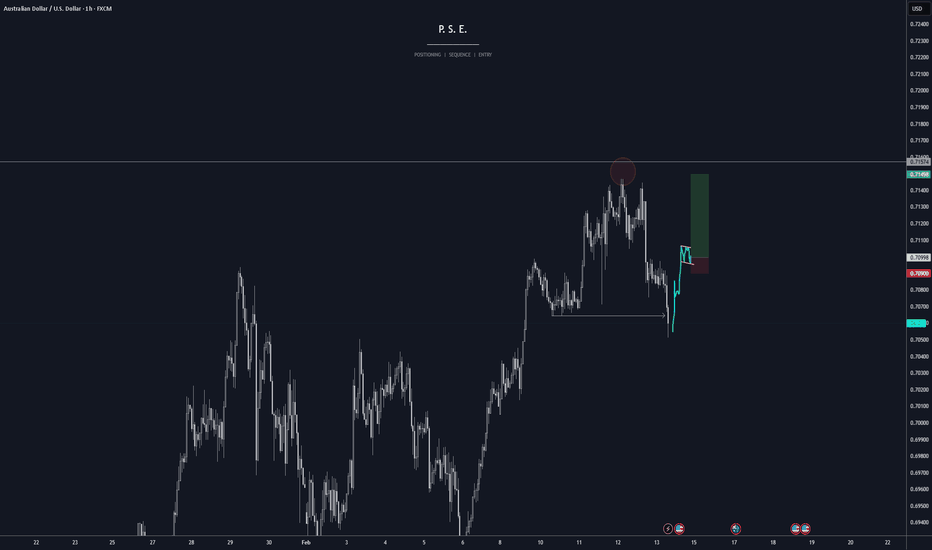
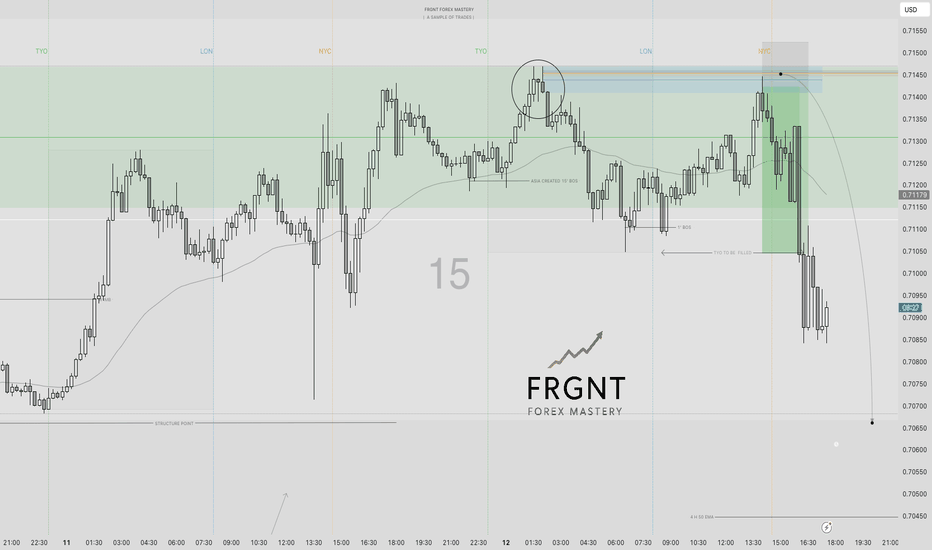
AUDUSD | FRGNT DAILY FORECAST | TEXTBOOK TRADING MADE EASY !📅 Q1 | W6 | D12 | Y26
📊 AUDUSD | FRGNT DAILY FORECAST |
🔍 Analysis Approach
I’m applying a developed version of Smart Money Concepts, with a structured focus on:
• Identifying Key Points of Interest (POIs) on Higher Time Frames (HTFs) 🕰️
• Using those POIs to define a clear and controlled trading range 📐
• Refining those zones on Lower Time Frames (LTFs) 🔎
• Waiting for a Break of Structure (BoS) as confirmation ✅
This process keeps me precise, disciplined, and aligned with market narrative, rather than reacting emotionally or chasing price.
💡 My Motto
“Capital management, discipline, and consistency in your trading edge.”
A positive risk-to-reward ratio, combined with a high-probability execution model, is the backbone of any sustainable trading plan 📈🔐
⚠️ On Losses
Losses are part of the mathematical reality of trading 🎲
They don’t define you — they are necessary, expected, and managed.
We acknowledge them, learn, and move forward 📊➡️
🙏 I appreciate you taking the time to review my Daily Forecast.
Further context and supporting material can be found in the Links section.
Stay sharp 🧠
Stay consistent 🎯
Protect your capital 🔐
— FRGNT 🚀📈
Silver bottom in? Tracking cluster entry for rally to $100!Silver has rebounded sharply after a brutal 5-wave drop, potentially signalling a major low at $64. With gold reclaiming 5k on geopolitical tensions and the US dollar struggling ahead of tomorrow’s CPI print despite a hot NFP print, the technicals suggest a new leg higher may be forming.
We are tracking a critical "Fibonacci Cluster" for a high-probability long entry.
Key topics covered
Fundamentals : Why the US Dollar is under pressure following weak retail sales and reports of China curbing US Treasury exposure, while gold gains on geopolitical risks in Ukraine and the Middle East.
Technical reversal : Identifying the 5-wave impulse to the downside and why the bounce to $86.00 suggests the first leg of the recovery might be complete.
Cluster entry : We are watching the 78 level, where the 23.6% retracement of the major drop aligns with the 38.2% retracement of the recent rally - a classic confluence zone for buyers.
RSI : Divergence on the 4-hour chart confirms a shift in momentum, with the RSI holding above 40 suggesting room for an extension into overbought territory.
XAG/USD scenarios:
Bullish : A pullback to the $78 cluster holds support, triggering a rally towards $93 (50% Fib) and the primary target at $99.70 (61.8% Fib/Magnet Zone), just shy of the $100 level.
Bearish : Losing the $73 (61.8% Fib support) invalidates the bullish thesis, signalling a deeper correction towards the 78.6% level at $68 or a retest of the $64 lows.
Are you buying the dip at the cluster or waiting for CPI confirmation? Share your thoughts in the comments.
This content is not directed to residents of the EU or UK. Any opinions, news, research, analyses, prices or other information contained on this website is provided as general market commentary and does not constitute investment advice.
ThinkMarkets will not accept liability for any loss or damage including, without limitation, to any loss of profit which may arise directly or indirectly from use of or reliance on such information.
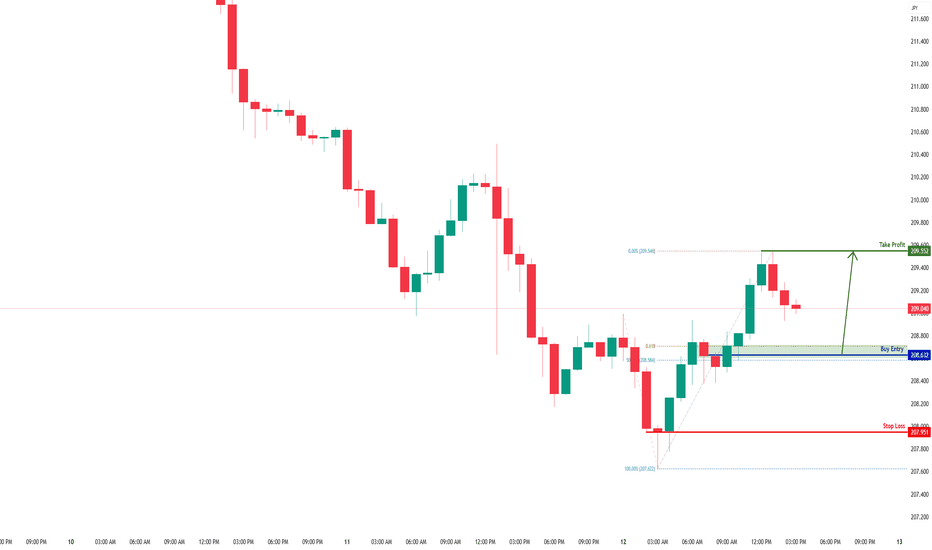
GBPJPY H1 | Bullish Bounce Off Key SupportMomentum: Bullish
Price is currently above the ichimoku cloud.
Buy entry: 208.632
- Pullback support
- 50% Fib retracement
- 61.8% Fib projection
Stop Loss: 207.951
- Swing low support
Take Profit: 209.552
- Swing high resistance
High Risk Investment Warning
Stratos Markets Limited (fxcm.com/uk), Stratos Europe Ltd (fxcm.com/eu):
CFDs are complex instruments and come with a high risk of losing money rapidly due to leverage. 69% of retail investor accounts lose money when trading CFDs with this provider. You should consider whether you understand how CFDs work and whether you can afford to take the high risk of losing your money.
Stratos Global LLC (fxcm.com/en): Losses can exceed deposits.
Please be advised that the information presented on TradingView is provided to FXCM (‘Company’, ‘we’) by a third-party provider (‘TFA Global Pte Ltd’). Please be reminded that you are solely responsible for the trading decisions on your account. Any information and/or content is intended entirely for research, educational and informational purposes only and does not constitute investment or consultation advice or investment strategy. The information is not tailored to the investment needs of any specific person and therefore does not involve a consideration of any of the investment objectives, financial situation or needs of any viewer that may receive it. Past performance is not a reliable indicator of future results. Actual results may differ materially from those anticipated in forward-looking or past performance statements. We assume no liability as to the accuracy or completeness of any of the information and/or content provided herein and the Company cannot be held responsible for any omission, mistake nor for any loss or damage including without limitation to any loss of profit which may arise from reliance on any information supplied by TFA Global Pte Ltd.
Stratos Trading Pty. Limited (fxcm.com/au):
Trading FX/CFDs carries significant risks. FXCM AU (AFSL 309763), please read the Financial Services Guide, Product Disclosure Statement, Target Market Determination and Terms of Business at fxcm.com/au
EURUSD H1 | Bearish Reaction Off Key ResistanceMomentum: Bearish
Price is currently below the ichimoku cloud.
Sell entry: 1.19093
- Pullback resistance
- 78.6% Fib retracement
- Fair value gap
Stop Loss: 1.19310
- Swing high resistance
Take Profit: 1.18726
- Swing low support
High Risk Investment Warning
Stratos Markets Limited (fxcm.com/uk), Stratos Europe Ltd (fxcm.com/eu):
CFDs are complex instruments and come with a high risk of losing money rapidly due to leverage. 69% of retail investor accounts lose money when trading CFDs with this provider. You should consider whether you understand how CFDs work and whether you can afford to take the high risk of losing your money.
Stratos Global LLC (fxcm.com/en): Losses can exceed deposits.
Please be advised that the information presented on TradingView is provided to FXCM (‘Company’, ‘we’) by a third-party provider (‘TFA Global Pte Ltd’). Please be reminded that you are solely responsible for the trading decisions on your account. Any information and/or content is intended entirely for research, educational and informational purposes only and does not constitute investment or consultation advice or investment strategy. The information is not tailored to the investment needs of any specific person and therefore does not involve a consideration of any of the investment objectives, financial situation or needs of any viewer that may receive it. Past performance is not a reliable indicator of future results. Actual results may differ materially from those anticipated in forward-looking or past performance statements. We assume no liability as to the accuracy or completeness of any of the information and/or content provided herein and the Company cannot be held responsible for any omission, mistake nor for any loss or damage including without limitation to any loss of profit which may arise from reliance on any information supplied by TFA Global Pte Ltd.
Stratos Trading Pty. Limited (fxcm.com/au):
Trading FX/CFDs carries significant risks. FXCM AU (AFSL 309763), please read the Financial Services Guide, Product Disclosure Statement, Target Market Determination and Terms of Business at fxcm.com/au
Gold - Preparing the final blow off top!💰Gold ( OANDA:XAUUSD ) will rally a final +20%:
🔎Analysis summary:
Just in January alone, Gold is up another +25% so far. Looking at this very bullish parabolic rally, Gold remains super strong and is still not done with the bullrun. Until Gold retests the ultimate resistance trendline, it can easily rally another +20% from the current levels.
📝Levels to watch:
$6,000
SwingTraderPhil
SwingTrading.Simplified. | Investing.Simplified. | #LONGTERMVISION
United Health - Losing $60bln in one day!📢United Health ( NYSE:UNH ) still overall remains bullish:
🔎Analysis summary:
Just within a couple of hours, United Health wiped out $60bln. And despite this massive -20% drop, United Health is approaching a major confluence of support. After we see bullish confirmation, a rejection higher is very likely to follow in the future.
📝Levels to watch:
$250
SwingTraderPhil
SwingTrading.Simplified. | Investing.Simplified. | #LONGTERMVISION
USDCHF H4 | Bearish Reaction Off Pullback ResistanceMomentum: Bearish
Price is currently below the ichimoku cloud.
Sell entry: 0.77432
- Pullback resistance
- 78.6% Fib retracement
Stop Loss: 0.77880
- Multi-swing high resistance
Take Profit: 0.76804
- Pullback support
High Risk Investment Warning
Stratos Markets Limited (fxcm.com/uk), Stratos Europe Ltd (fxcm.com/eu):
CFDs are complex instruments and come with a high risk of losing money rapidly due to leverage. 69% of retail investor accounts lose money when trading CFDs with this provider. You should consider whether you understand how CFDs work and whether you can afford to take the high risk of losing your money.
Stratos Global LLC (fxcm.com/en): Losses can exceed deposits.
Please be advised that the information presented on TradingView is provided to FXCM (‘Company’, ‘we’) by a third-party provider (‘TFA Global Pte Ltd’). Please be reminded that you are solely responsible for the trading decisions on your account. Any information and/or content is intended entirely for research, educational and informational purposes only and does not constitute investment or consultation advice or investment strategy. The information is not tailored to the investment needs of any specific person and therefore does not involve a consideration of any of the investment objectives, financial situation or needs of any viewer that may receive it. Past performance is not a reliable indicator of future results. Actual results may differ materially from those anticipated in forward-looking or past performance statements. We assume no liability as to the accuracy or completeness of any of the information and/or content provided herein and the Company cannot be held responsible for any omission, mistake nor for any loss or damage including without limitation to any loss of profit which may arise from reliance on any information supplied by TFA Global Pte Ltd.
Stratos Trading Pty. Limited (fxcm.com/au):
Trading FX/CFDs carries significant risks. FXCM AU (AFSL 309763), please read the Financial Services Guide, Product Disclosure Statement, Target Market Determination and Terms of Business at fxcm.com/au
NZDUSD H1 | Bullish Bounce Off Pullback SupportMomentum: Bullish
Price is currently above the ichimoku cloud.
Buy entry: 0.60488
- Pullback support
- 78.6% Fib retracement
Stop Loss: 0.60321
- Overlap support
Take Profit: 0.60742
- Swing high resistance
High Risk Investment Warning
Stratos Markets Limited (fxcm.com/uk), Stratos Europe Ltd (fxcm.com/eu):
CFDs are complex instruments and come with a high risk of losing money rapidly due to leverage. 69% of retail investor accounts lose money when trading CFDs with this provider. You should consider whether you understand how CFDs work and whether you can afford to take the high risk of losing your money.
Stratos Global LLC (fxcm.com/en): Losses can exceed deposits.
Please be advised that the information presented on TradingView is provided to FXCM (‘Company’, ‘we’) by a third-party provider (‘TFA Global Pte Ltd’). Please be reminded that you are solely responsible for the trading decisions on your account. Any information and/or content is intended entirely for research, educational and informational purposes only and does not constitute investment or consultation advice or investment strategy. The information is not tailored to the investment needs of any specific person and therefore does not involve a consideration of any of the investment objectives, financial situation or needs of any viewer that may receive it. Past performance is not a reliable indicator of future results. Actual results may differ materially from those anticipated in forward-looking or past performance statements. We assume no liability as to the accuracy or completeness of any of the information and/or content provided herein and the Company cannot be held responsible for any omission, mistake nor for any loss or damage including without limitation to any loss of profit which may arise from reliance on any information supplied by TFA Global Pte Ltd.
Stratos Trading Pty. Limited (fxcm.com/au):
Trading FX/CFDs carries significant risks. FXCM AU (AFSL 309763), please read the Financial Services Guide, Product Disclosure Statement, Target Market Determination and Terms of Business at fxcm.com/au
Review and plan for 13th February 2026 Nifty future and banknifty future analysis and intraday plan.
Quarterly results.
This video is for information/education purpose only. you are 100% responsible for any actions you take by reading/viewing this post.
please consult your financial advisor before taking any action.
----Vinaykumar hiremath, CMT
EURUSD H1 | Bearish Reaction Off Pullback ResistanceMomentum: Bearish
Price is currently below the ichimoku cloud.
Sell entry: 1.18866
- Pullback resistance
- 61.8% Fib retracement
Stop Loss: 1.19225
- Multi-swing high resistance
Take Profit: 1.18359
- Overlap support
High Risk Investment Warning
Stratos Markets Limited (fxcm.com/uk), Stratos Europe Ltd (fxcm.com/eu):
CFDs are complex instruments and come with a high risk of losing money rapidly due to leverage. 69% of retail investor accounts lose money when trading CFDs with this provider. You should consider whether you understand how CFDs work and whether you can afford to take the high risk of losing your money.
Stratos Global LLC (fxcm.com/en): Losses can exceed deposits.
Please be advised that the information presented on TradingView is provided to FXCM (‘Company’, ‘we’) by a third-party provider (‘TFA Global Pte Ltd’). Please be reminded that you are solely responsible for the trading decisions on your account. Any information and/or content is intended entirely for research, educational and informational purposes only and does not constitute investment or consultation advice or investment strategy. The information is not tailored to the investment needs of any specific person and therefore does not involve a consideration of any of the investment objectives, financial situation or needs of any viewer that may receive it. Past performance is not a reliable indicator of future results. Actual results may differ materially from those anticipated in forward-looking or past performance statements. We assume no liability as to the accuracy or completeness of any of the information and/or content provided herein and the Company cannot be held responsible for any omission, mistake nor for any loss or damage including without limitation to any loss of profit which may arise from reliance on any information supplied by TFA Global Pte Ltd.
Stratos Trading Pty. Limited (fxcm.com/au):
Trading FX/CFDs carries significant risks. FXCM AU (AFSL 309763), please read the Financial Services Guide, Product Disclosure Statement, Target Market Determination and Terms of Business at fxcm.com/au


