BMNR Technical Outlook: A Textbook PlayStructure and Pattern Recognition
BMNR has developed a constructive base while holding its broader uptrend structure. The chart highlights the potential formation of a double bottom reversal, a classical pattern that often signals the exhaustion of selling pressure and a shift toward accumulation.

The best trades require research, then commitment.
Get started for free$0 forever, no credit card needed

Scott "Kidd" PoteetThe unlikely astronaut

Where the world does markets
Join 100 million traders and investors taking the future into their own hands.
Major indices

Gold Tops $3,800 to New Record as Traders Wonder: Short or Long?Gold OANDA:XAUUSD is back in the spotlight, flashing new record highs in bold efforts to reclaim its throne as the ultimate “don’t panic” asset.
The yellow metal hit a record high of $3,820 per ounce early Monday morning before cooling slightly to hover near $3,810. That’s up more than 47% year

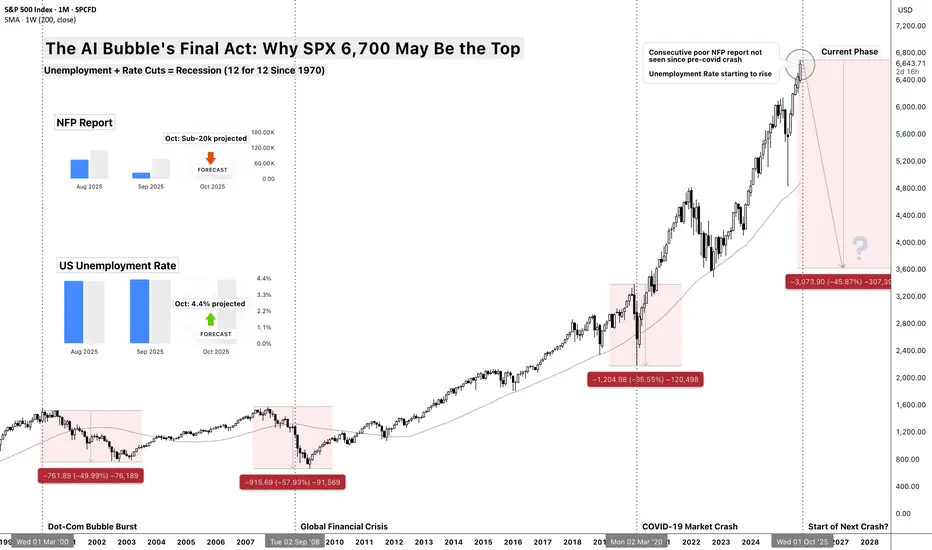
The AI Bubble's Final Act: Why $SP:SPX 6,700 May Be the TopThe AI Bubble's Final Act: Why SP:SPX 6,700 May Be the Top
Unemployment + Rate Cuts = Recession (12 for 12 Since 1970)
The Death Cross Pattern
There's a simple rule that's worked for 55 years: When the Fed cuts rates while unemployment is rising from cycle lows, recession follows within 12 m
Wall Street Weekly Outlook - Week 40 2025Every week I release a Wall Street Weekly Outlook that highlights the key themes, market drivers, and risks that professional traders are watching.
This week promises to be particularly important, with several events likely to move markets. 📊 Stay ahead of the curve—watch the video now and get prep

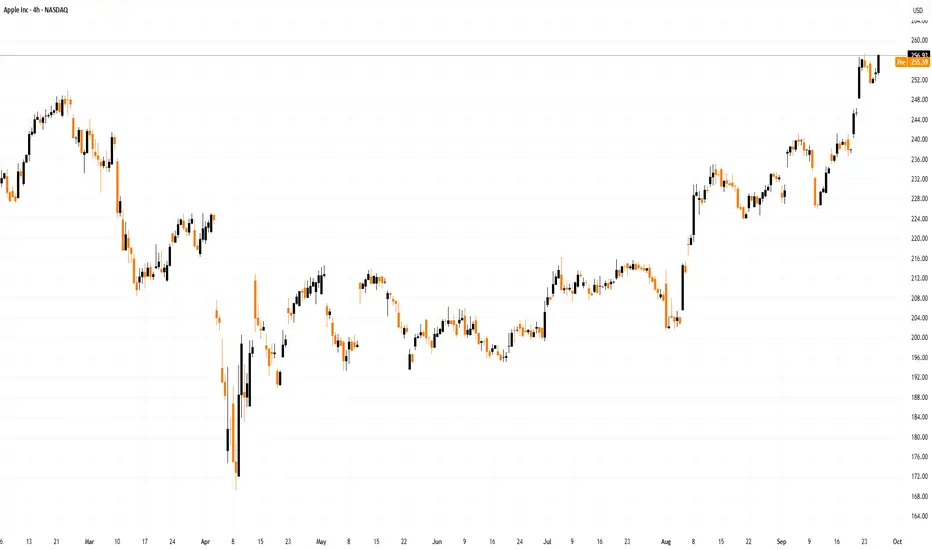
Apple Shares (AAPL) Close to Reaching Record HighApple Shares (AAPL) Close to Reaching Record High
On 10 September, we noted that following the launch of new products — including the iPhone 17 — AAPL shares had fallen by approximately 1.5%, as analysts considered the model lacked the breakthrough appeal necessary to drive further growth.
Howeve
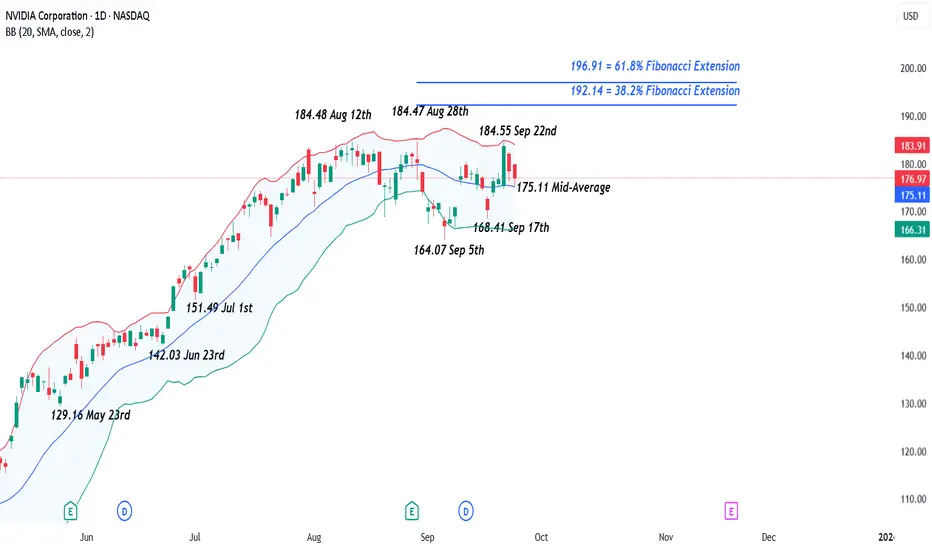
NVIDIA – Bumping Up Against Record HighsNVIDIA’s share price is experiencing an interesting run into the end of September as traders try and work out whether it can extend its run of gains through all time highs sitting just above the 184 level (184.55 Sept 22nd), a line in the sand that has capped the upside since the start of August (mo
Retro Editors' picks 2024Closing our retro EP selection , we present to you the last collection of additional scripts that have earned a spot in our Editors' picks, in this case from 2024.
These retrospective selections reflect our continued commitment to honoring outstanding contributions in our community, regardless of

The Bear Market Isn't Coming? Old BTC Playbook is a TrapFor years, traders have relied on Bitcoin's predictable cycles. We look for the same clues, the same topping signals, and the same patterns. But what if the market has evolved? What if the playbook we've all been studying is now a trap?
This analysis dives deep into key indicators across all three

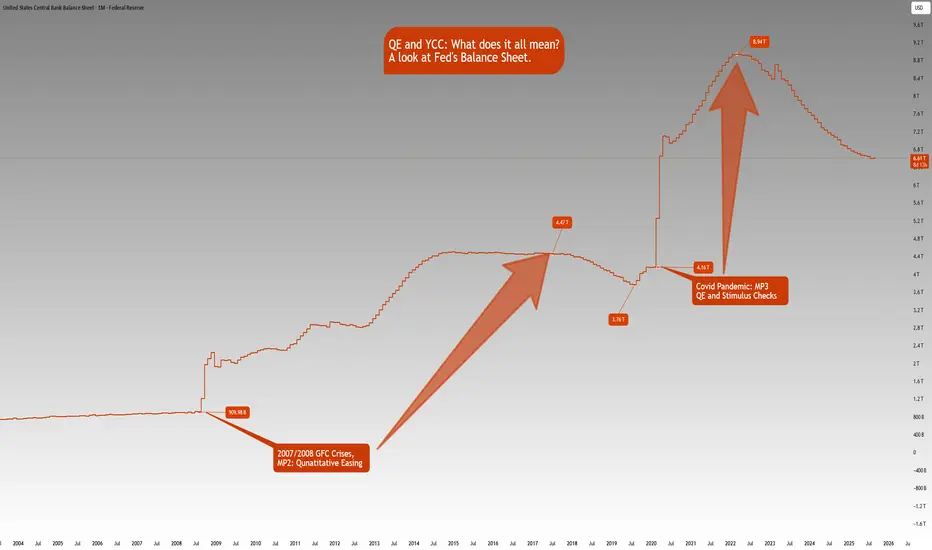
QE and YCC: What does it all mean?ECONOMICS:USCBBS
CBOT:ZB1! CBOT:ZN1! CME_MINI:NQ1!
There is growing market speculation that the Fed may tolerate inflation above 2% for longer, consistent with its Average Inflation Targeting (AIT) framework introduced in 2020.
This also implies that real rates i.e., nominal rates minus
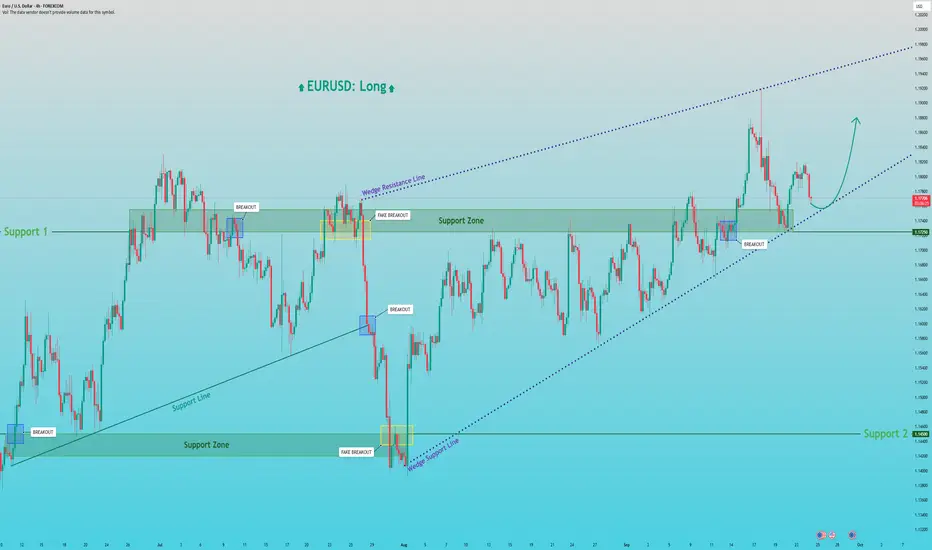
EURUSD: Rally from Wedge Support to 1.1880Hello everyone, here is my breakdown of the current Euro setup.
Market Analysis
A prior uptrend failed, leading to a sharp drop down to the major Support zone 2 around the 1.1450 level. However, strong buying pressure emerged from that low, initiating a powerful reversal and establishing the cu
See all editors' picks ideas
RiskMetrics█ OVERVIEW
This library is a tool for Pine programmers that provides functions for calculating risk-adjusted performance metrics on periodic price returns. The calculations used by this library's functions closely mirror those the Broker Emulator uses to calculate strategy performance metrics (

Simple Decesion Matrix Classification Algorithm [SS]Hello everyone,
It has been a while since I posted an indicator, so thought I would share this project I did for fun.
This indicator is an attempt to develop a pseudo Random Forest classification decision matrix model for Pinescript.
This is not a full, robust Random Forest model by any stretch o

Tick CVD [Kioseff Trading]Hello!
This script "Tick CVD" employs live tick data to calculate CVD and volume delta! No tick chart required.
Features
Live price ticks are recorded
CVD calculated using live ticks
Delta calculated using live ticks
Tick-based HMA, WMA, EMA, or SMA for CVD and price
Key tick levels (S

analytics_tablesLibrary "analytics_tables"
📝 Description
This library provides the implementation of several performance-related statistics and metrics, presented in the form of tables.
The metrics shown in the afforementioned tables where developed during the past years of my in-depth analalysis of various str

Adaptive Trend Classification: Moving Averages [InvestorUnknown]Adaptive Trend Classification: Moving Averages
Overview
The Adaptive Trend Classification (ATC) Moving Averages indicator is a robust and adaptable investing tool designed to provide dynamic signals based on various types of moving averages and their lengths. This indicator incorporates multipl

Statistics • Chi Square • P-value • SignificanceThe Statistics • Chi Square • P-value • Significance publication aims to provide a tool for combining different conditions and checking whether the outcome is significant using the Chi-Square Test and P-value.
🔶 USAGE
The basic principle is to compare two or more groups and check the results

FiniteStateMachine🟩 OVERVIEW
A flexible framework for creating, testing and implementing a Finite State Machine (FSM) in your script. FSMs use rules to control how states change in response to events.
This is the first Finite State Machine library on TradingView and it's quite a different way to think about your

Trading Activity Index (Zeiierman)█ Overview
Trading Activity Index (Zeiierman) is a volume-based market activity meter that transforms dollar-volume into a smooth, normalized “activity index.”
It highlights when market participation is unusually low or high with a dynamic color gradient:
Light Blue → Low Activity (thin p

Expected Value Monte CarloI created this indicator after noticing that there was no Expected Value indicator here on TradingView.
The EVMC provides statistical Expected Value to what might happen in the future regarding the asset you are analyzing.
It uses 2 quantitative methods:
Historical Backtest to ground your anal

Bar Index & TimeLibrary to convert a bar index to a timestamp and vice versa.
Utilizes runtime memory to store the 𝚝𝚒𝚖𝚎 and 𝚝𝚒𝚖𝚎_𝚌𝚕𝚘𝚜𝚎 values of every bar on the chart (and optional future bars), with the ability of storing additional custom values for every chart bar.
█ PREFACE
This library aims to tackle s

See all indicators and strategies
Community trends
Nvidia - The next rally of +33% started!🚀Nvidia ( NASDAQ:NVDA ) just broke out:
🔎Analysis summary:
Over the past couple of months, Nvidia has been rallying an expected +100%. However, just objectively looking at the chart, this rally is not over yet. After the confirmed all time high breakout, Nvidia can rally another +33% until it

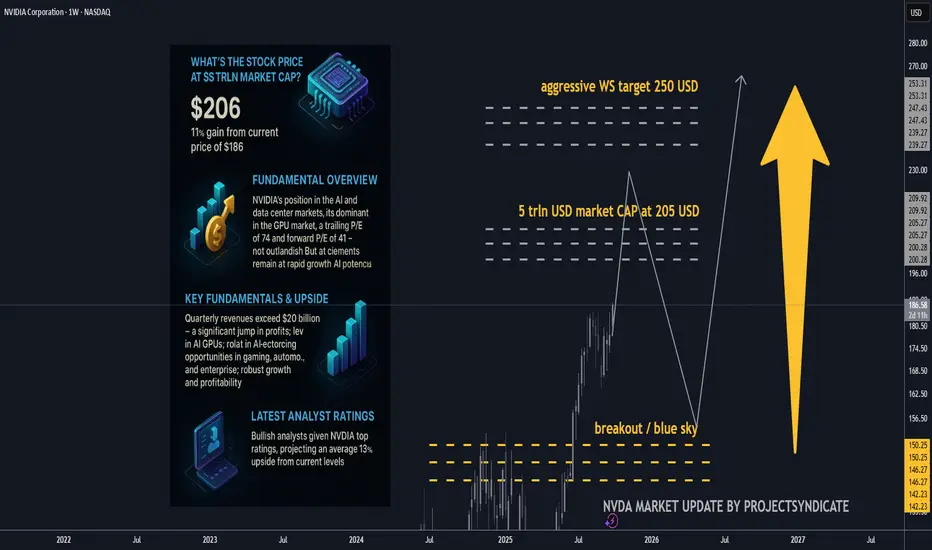
NVDA 5 trln USD market cap up next? Key fundamentals and upside.Is $5T reasonable for NVDA?
• Mechanically, yes: The market only needs ~10% near-term appreciation from today’s levels to print $5T. That’s within one strong quarter or a guidance beat.
• Fundamentally, the math works if (a) FY26–27 revenue tracks the guide/Street trajectory (TTM already $165B with
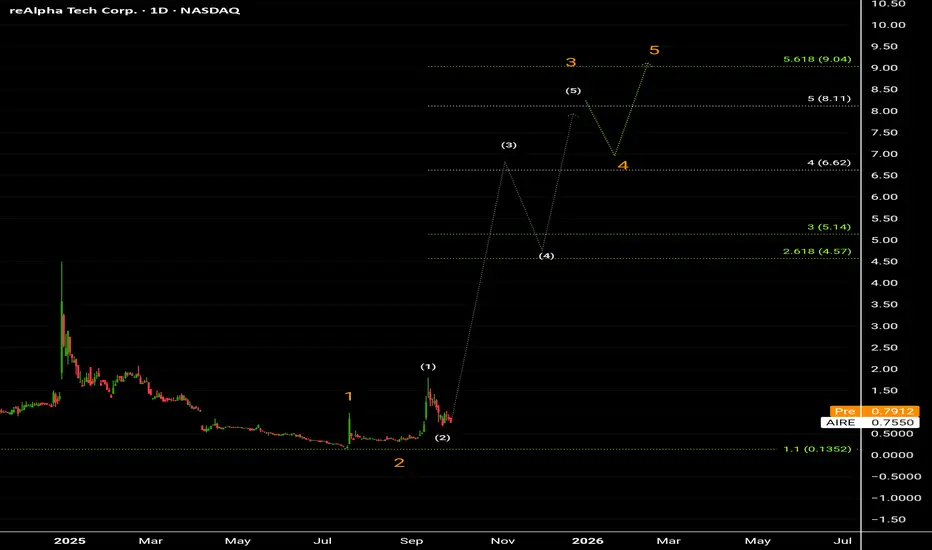
ReAlpha Tech Corp Stock completed wave 2 of W3 and prepared to move up in wave 3 of W3 that could reach up to 6.62$ followed by wave 4 correction, and finishing wave 5 of W3 near 8.11$.
W5 Target price similar to previous Shark Harmonic shap formation near 9.92$.
At present time, and Motive powerful wave is prepare
SMCI ready to test the top of the Triangle at $63.50.Supermicro Computer Inc. (SMCI) has been trading within a 1-year Ascending Triangle but since August 06 it has been 'trapped' within its 1D MA50 (blue trend-line) and 1D MA200 (orange trend-line).
A closing above the 1D MA50, technically confirms the new Bullish Leg, targeting the top of the Ascend


LULU is a BUY BUY+++++!!! $50-$100 bounce coming from here!As I posted a week and a half ago LULU hit strong 2019 support pre covid around $158 and is a BUY+++++++ Apparently Michael Burry's Scion Capital made a purchase last quarter $50 higher than today's price, I would expect to see them add to his position as well as 400,000 calls I read he also purcha

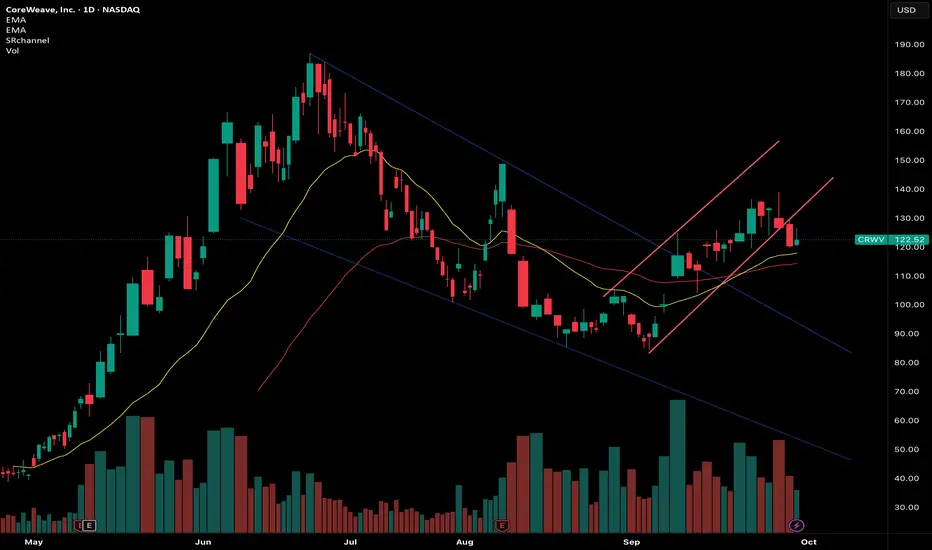
CRWV: Not so fast..We recently broke out of a semi-long term downwards channel, funneling the price movement to the upside which you can see in the smaller channel pictured above.
However, recent price action suggests that we are looking at potential short-term downside, whether its short term or something that turns
CRM Is A Buy Hello,
CRM is running in an ending diagonal, as last phase of correction.
Targets:
1) $300
2) $330
3) $370

NVDA Ready for Takeoff: $200 Target in Sight!
Based on the daily chart of NVIDIA (NVDA) on NASDAQ, here’s a breakdown:
🔎 Technical Analysis
Overall Trend
The stock is in a strong uptrend (rallying from around $120 to the current $186).
Higher lows are forming, and price is pressing against the 185–187 resistance zone, showing strong buying

$DPRO - Dragonfly, Inc - $8.60 Retest - $9.25 PTNASDAQ:DPRO broke out this morning, retesting the $8.60s before consolidating throughout the premarket. Based on current projections, we're targeting a $9.25 Price Target on the trade, look for a re-entry on that lower-level support trend.
This comes after NASDAQ:DPRO announced landing a US Arm

See all stocks ideas
Today
CALMCal-Maine Foods, Inc.
Actual
4.12
USD
Estimate
5.01
USD
Today
AYIAcuity Inc.
Actual
5.20
USD
Estimate
4.83
USD
Today
RPMRPM International Inc.
Actual
1.88
USD
Estimate
1.88
USD
Today
CAGConAgra Brands, Inc.
Actual
0.39
USD
Estimate
0.33
USD
Today
RZLVRezolve AI PLC
Actual
−0.03
USD
Estimate
−0.03
USD
Today
CMTLComtech Telecommunications Corp.
Actual
—
Estimate
−0.75
USD
Today
APOGApogee Enterprises, Inc.
Actual
—
Estimate
0.84
USD
Today
GMGIGolden Matrix Group, Inc.
Actual
—
Estimate
−0.00
USD
See more events
Community trends
BTC is in 'The Final Trap' Before the Crash (Wyckoff Phase C)
In my last post, I announced the end of the bull cycle and shared my game plan for the next two years. I explained WHAT I am doing and WHY from a macroeconomic perspective.
In this post, I will show you HOW I came to these conclusions using technical analysis. This isn't a gut feeling. It is a stru

IS ALT SEASON DEAD? ALTCOIN ANALYSIS REQUEST OCTOBER 2025Family, October is here, and with it comes one of the most important request windows of the year. We are at the closing edge of the 4-year cycle, a stage where altcoins either break into expansion or get left behind in liquidity drains. This makes our selection for this month even more crucial.
📌

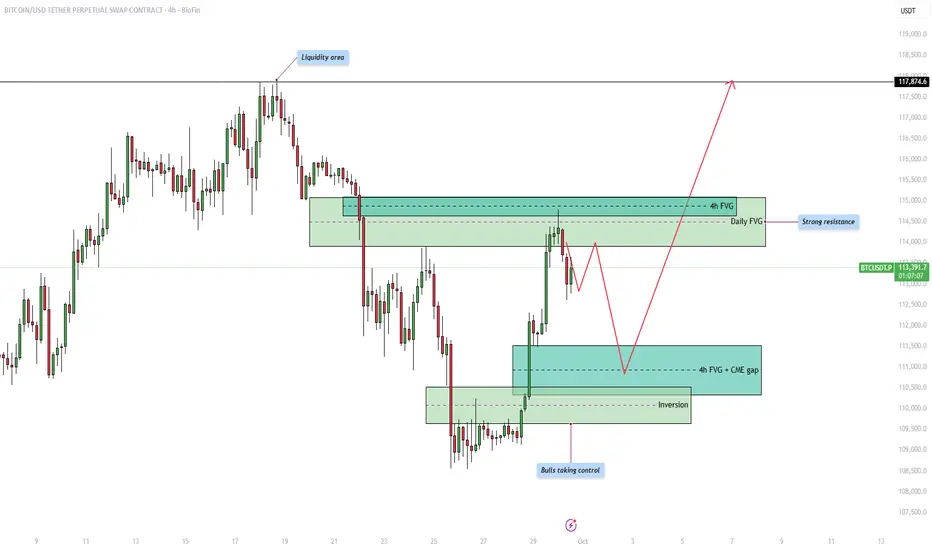
Bitcoin - Shortterm correction in the bullish trend!Introduction
The Bitcoin price action is currently moving within a structured range where both liquidity and fair value gaps (FVGs) are playing an important role in shaping potential market direction. By analyzing the chart, we can identify key areas of liquidity, resistance, and support that trade
BTCUSDT: Potential Reversal at Key Support👋Hello everyone, what do you think about the trend of BINANCE:BTCUSDT ?
Bitcoin is currently undergoing a short-term correction after forming a peak above $114,500. The price is now heading toward a key support zone around $110,000, which is also seen as an important confluence zone.
If Bitcoin

ZEC breakout of multi years resistance !ZEC / USDT
We noticed a Strong move this week
Price broke multi-years resistance line (2024/2022/2020) which is a huge breakout for this coin !
Simple thing , Holding above line = bullish
Invalidation: candle close below it

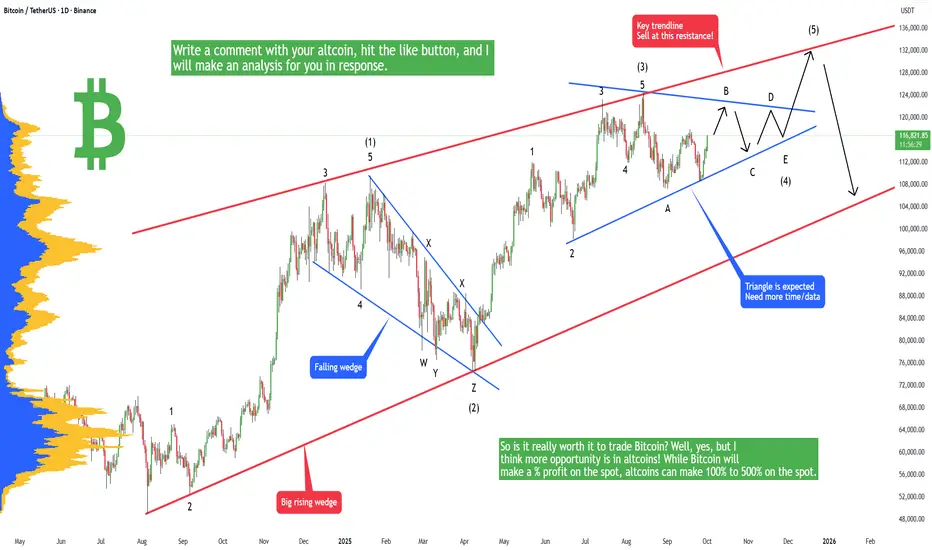
Bitcoin - LifeTime opportunity if you read this!Bitcoin is in the last stage of the current bull market (from 15k to 130k) and you definitely want to know where to sell otherwise you can experience a huge loss in 2026. You don't want to watch your portfolio dropping by 50% to 80%. You probably already know that the market is completely manipulate
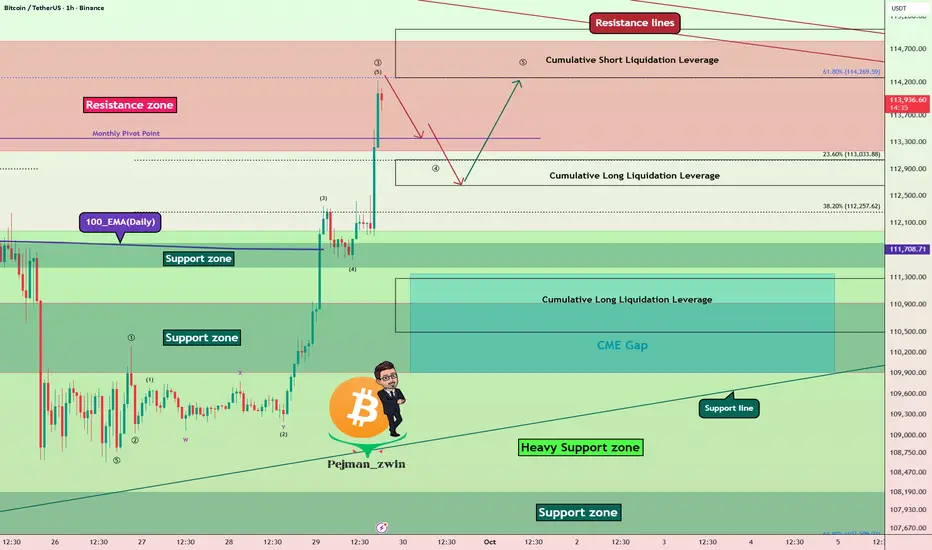
Bitcoin Resistance Zone Battle – ATH or Fakeout?Bitcoin ( BINANCE:BTCUSDT ) has shown strong momentum over the past 5 days , liquidating many traders in both Long and Short positions .
Bitcoin has now entered the Resistance zone($114,820-$113,170) and is moving near the Cumulative Short Liquidation Leverage($115,000-$114,272) and Resi
Price Trend Under Economic News InfluenceHello everyone,
Ethereum is showing important signals on the 4-hour chart as the price recently touched the $4,180 level and started to correct. Several Fair Value Gaps (FVG) have formed densely within the $4,000–$4,100 zone, suggesting that the market may return to this area for balance before de

Bitcoin is bullish now & many Traders don't see it !!!As you can see, the price has formed a triangle over the past 4 months, whose bullish or bearish nature will be determined after its breakout. The corrective Elliott waves(abc) are currently completing the final wave, which indicates that a potential price increase is on the way. The price seems to

BTC/USD (4H timeframe).BTC/USD (4H timeframe) with Ichimoku + support/resistance + trendline.
Currently price is around $113,958.
Based on My chart:
Price broke up from the Ichimoku cloud and is retesting above the $113,000 – $114,000 support zone.
The blue arrow I drew points towards the next resistance.
The target

See all crypto ideas
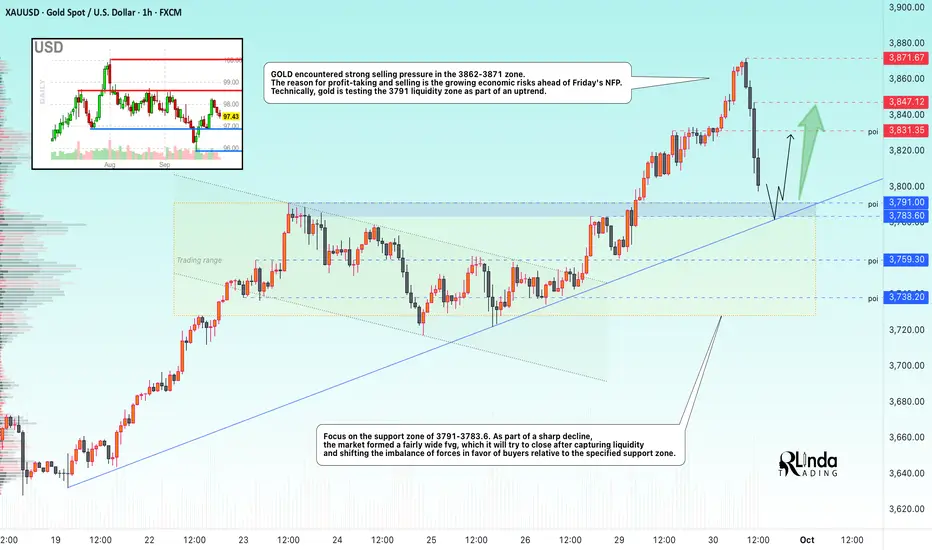
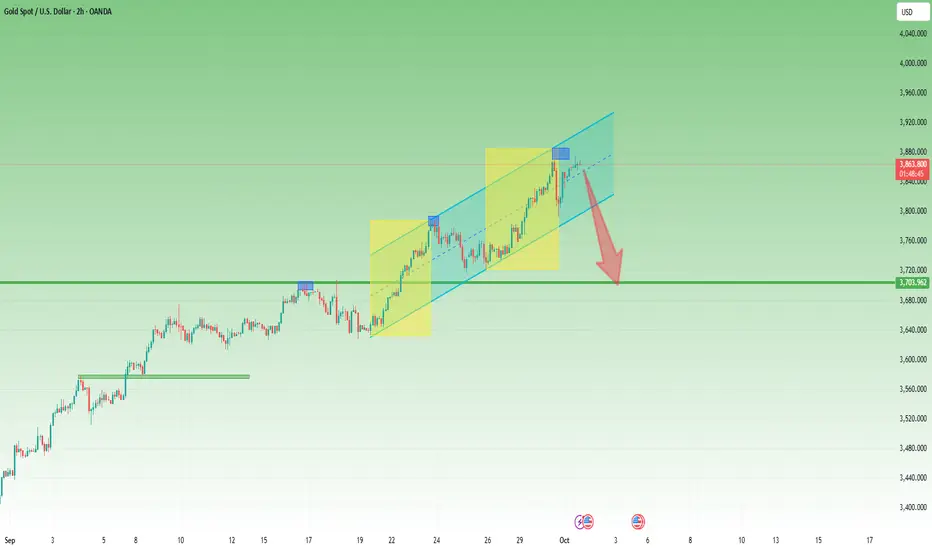
GOLD → Liquidation, but there is still a chance for growth...FX:XAUUSD has reached a new all-time high of 3871.6, marking its best month in 14 years (+12% in September). However, against the backdrop of high risks, the market is experiencing profit-taking and a deep correction. What next?
The high probability of a shutdown from October 1 is weighing on
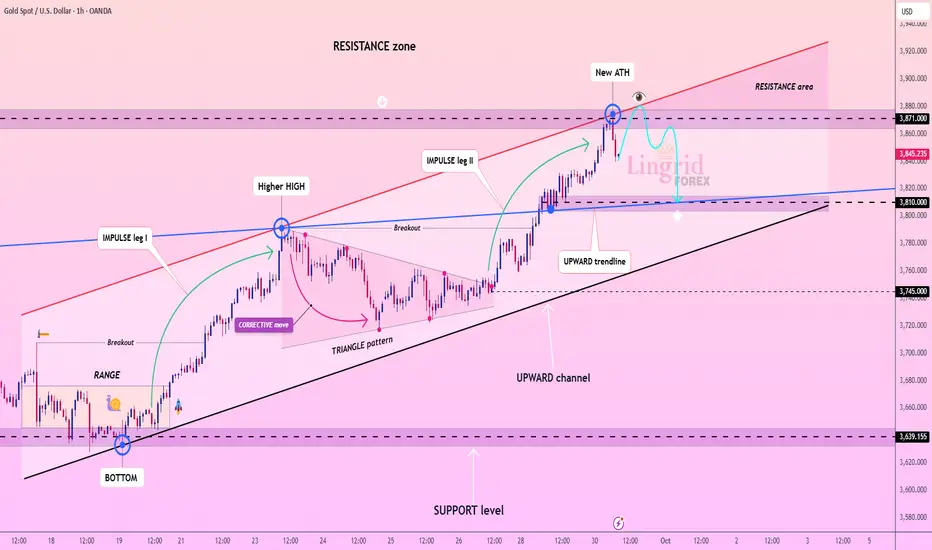
Lingrid | GOLD Price Surge Cooling Short-Term PullbackThe price perfectly fulfilled my previous idea . OANDA:XAUUSD has printed a new ATH near 3,870 after completing two strong impulse legs within the upward channel. Price action is showing signs of exhaustion at the resistance zone, suggesting a short-term retracement phase is underway. A pullback
Gold at PRZ – Crab Pattern in PlayGold ( OANDA:XAUUSD ) started to rise as I mentioned in my previous idea and created a new All-Time High(ATH) again .
How long do you think the trend toward forming a new ATH will continue?
Gold is currently trading near the Potential Reversal Zone(PRZ) and Resistance lines .
In theory,

XAU/USD | Gold Rally Continues – Can It Push Toward $4K?By analyzing the gold chart on the 1-hour timeframe, we can see that after reaching the $3,784 supply zone, the price faced selling pressure and corrected down to $3,754. But with the start of the new week, gold continued its rally, hitting a new high at $3,831.
As I mentioned in previous analy

GOLD 4H CHART ROUTE MAP UPDATEHey Everyone,
Another PIPTASTIC day on the charts with our 4H chart also playing out as analysed.
Yesterday we completed our 1H chart idea and today we complete our 4H chart idea. After completing 3778 target, we had ema5 cross and lock gaps open above at 3811 and 3845 - Both of these gaps are no

Gold Continues to Show Strength👋Hello everyone, what do you think about the current trend of OANDA:XAUUSD ?
Yesterday, the market received an important piece of news: the JOLTS data showed 7.23 million job openings in the U.S., surpassing the forecast of 7.19 million and slightly higher than the previous figure of 7.21 million

Gold Bullish Setup Towards 3910 ATHThis chart shows the XAU/USD (Gold vs US Dollar) 1-hour timeframe analysis. Price is currently trading around 3863, following a strong bullish trend supported by an upward trendline. The market recently bounced from the support area and continues to push higher, confirming buyer strength.
Key level

3830: The Line Between Bullish Control and a Waterfall Drop1. Recap of Yesterday’s Key Move
Yesterday was a decisive day for Gold traders, and it perfectly confirmed what I have been pointing out since Monday: at these elevated levels, Gold is extremely vulnerable.
After printing yet another All-Time High overnight, the yellow metal sold off aggressively f
Gold Watching 3,780 as Fed Drama & Geopolitics Boost DemandHey Traders, in today's session we are watching XAUUSD closely as price pulls back toward the 3,780 support zone. The broader trend remains bullish, and this retracement could offer a potential buying opportunity if buyers defend this level.
Market Structure: Gold has been steadily climbing, and th

Silver Market Once in a Lifetime Breakout: 120/140 USD PT📌 Base case unchanged: I’m still targeting $125–$150 within 12–24 months. The next leg of the bull run should accelerate after the all-time-high (~$49–$50) breaks and sticks. Spot is circling the mid-$40s (recent highs ~$46–$47), so the setup is in place. 💎✨
🎯 Bottom line
Silver’s structural def

See all futures ideas
EURUSDHello Traders! 👋
What are your thoughts on EURUSD?
EUR/USD continues to trade within a rising channel structure. Following the recent pullback, price reacted positively upon reaching the identified support zone.
At this stage, we expect some short-term consolidation around current levels. However

EUR/USD - U.S Government Shutdown ? 📊 Setup:
EUR/USD has successfully broken out of the descending channel on the H1 timeframe. Price is holding above the breakout level, supported by the Ichimoku cloud and a nearby demand zone. With potential U.S. government shutdown news weighing on the dollar, EUR/USD shows strong upside potential.

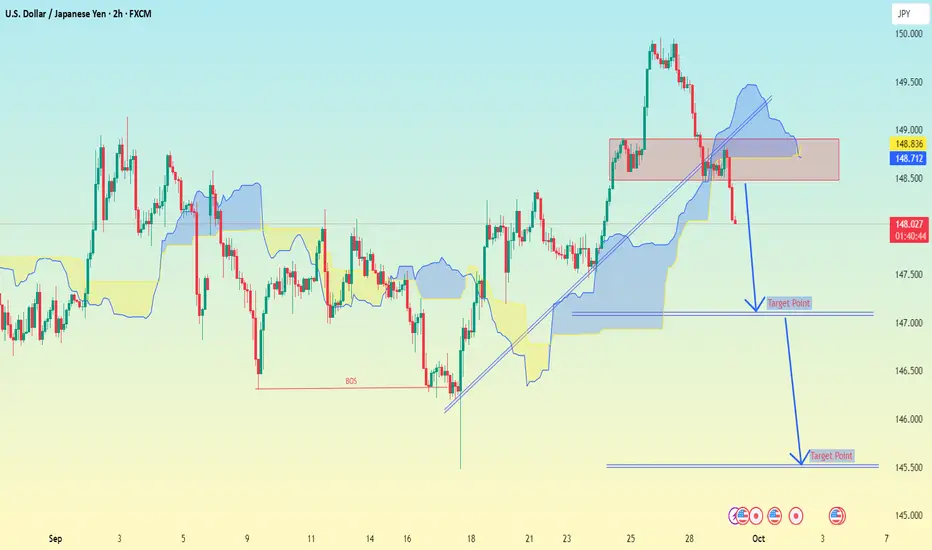
USD/JPY (2H timeframe) with Ichimoku..USD/JPY (2H timeframe) with Ichimoku + support/resistance + trendline.
Price is now around 148.04 after rejecting from the red resistance zone.
📊 Analysis:
Price broke the uptrend line.
Strong rejection from 148.80 – 149.00 resistance zone.
Bearish structure forming with downside targets marked
EUR/USD | Euro Faces Pressure – Key Supply Zone at 1.1736–1.1762By analyzing the EUR/USD chart on the 2-hour timeframe, we can see that the price is currently trading around 1.172. I expect to see more downside movement soon.
The key supply zone is between 1.17360–1.17620, and if the price retests this area, we should watch closely for reactions. The possible d

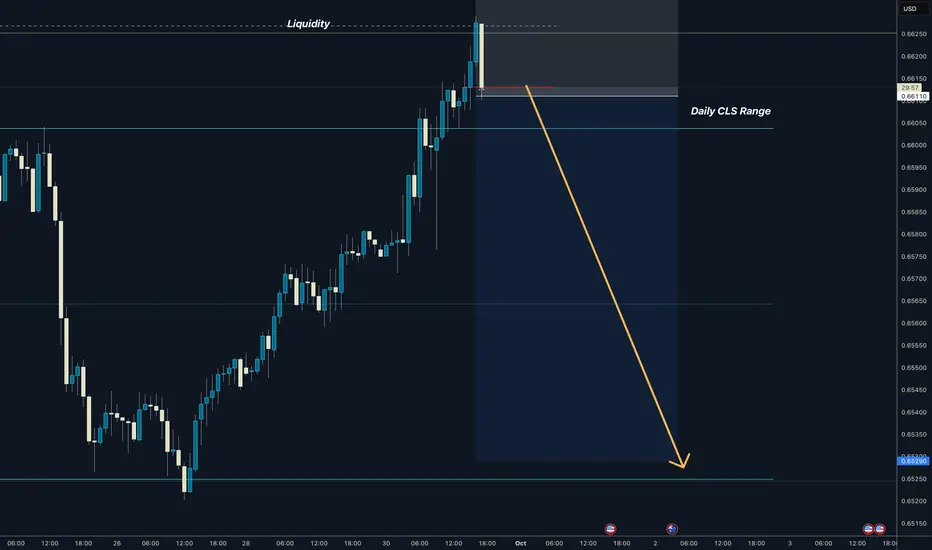
AUDUSD I Daily CLS range I Manipulation I ShortDaily CLS range manipulated.
Change in order flow created
I see it going down here - Trading model 1
Bigger picture
DXY is bullish now.
Good Luck
David Perk aka Dave Fx Hunter
GBPNZD Could Possibly Start a Bearish Move from 2.3250GBPNZD Could Possibly Start a Bearish Move from 2.3250
From our previous analysis, GBPNZD tested the daily structure zone near 2.3200 and reacted strongly the last time. The pair has since dropped nearly 500 pips by reaching 2.2700
The price tested once again at 2.3200 - 2.3250. There is a high p

EURUSD Short: Continuation Within the Downward WedgeHello, traders! The prior market structure for EURUSD was a bullish ascending channel, which failed and led to a breakdown. This reversal has established the current bearish market phase, which has taken the form of a downward wedge. This pattern has been guiding the price auction lower through a se

AUDNZD Reached Strong ResistancePrice on AUDNZD has been rallying aggressively, but the move now looks overextended as it drives straight into a major resistance zone, an area where sellers have stepped in before.
If buyers fail to break through and price rejects here, that’s the signal sellers are defending strongly, meaning a

Lingrid | EURUSD Previous Day High Resistance Short OpportunityFX:EURUSD is recovering from the recent bottom near 1.1645 after support zone rejection. Price action is moving towards the resistance area around 1.1760, aligned with the upward trendline and previous day high. A rejection at this zone could send the pair back toward 1.1680 support. Broader struct

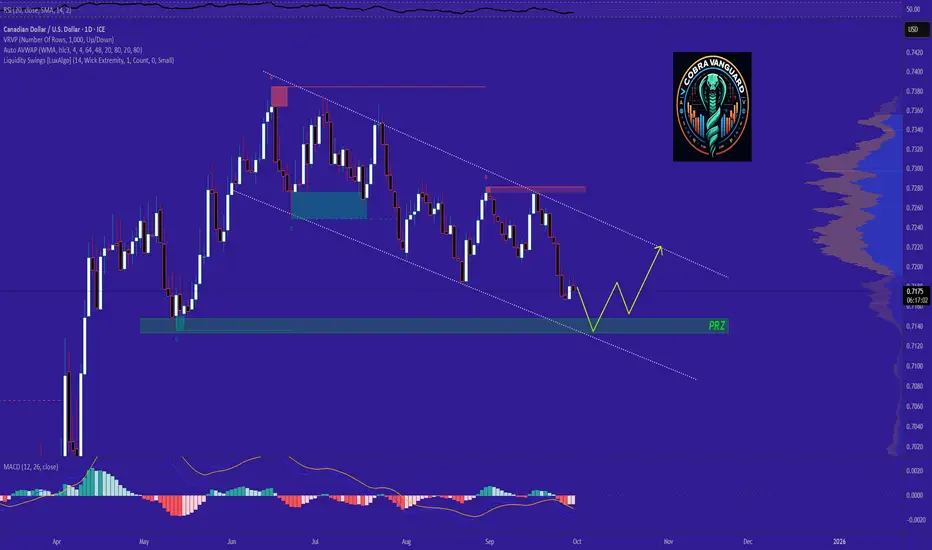
CADUSD → Bearish 𝐏𝐫𝐞𝐬𝐬𝐮𝐫𝐞 !!!As you can see, the price could drop to the bottom of the descending channel and then turn bullish. The PRZ (Potential Reversal Zone) is a good area for an upward move.
See all forex ideas
| - | - | - | - | - | - | - | ||
| - | - | - | - | - | - | - | ||
| - | - | - | - | - | - | - | ||
| - | - | - | - | - | - | - | ||
| - | - | - | - | - | - | - | ||
| - | - | - | - | - | - | - | ||
| - | - | - | - | - | - | - | ||
| - | - | - | - | - | - | - |
Trade directly on the supercharts through our supported, fully-verified and user-reviewed brokers.


