Bear market has startedThe End of the Bull Cycle. Why I'm Selling Everything and Won't Buy Again Until September 2026.
For the last year and a half, I have said that we are in a bull market. I never once changed my opinion. But all things come to an end. The time has come.
September 13, 2025, the date I have been ment

The best trades require research, then commitment.
Get started for free$0 forever, no credit card needed

Scott "Kidd" PoteetThe unlikely astronaut

Where the world does markets
Join 100 million traders and investors taking the future into their own hands.
Major indices

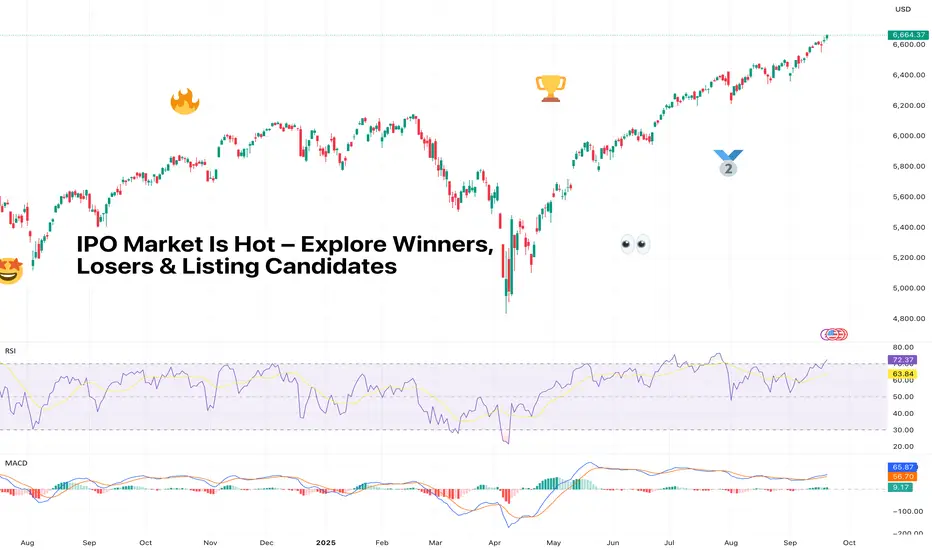
IPO Market Is Hot – Explore Winners, Losers & Listing CandidatesThe IPO market has woken up from its multi-year nap and is now in beast mode. But as always, Wall Street’s hottest party comes with an entrance fee and a dose of uncertainty – opaque prices, sketchy balance sheets, and a whole lot of FOMO.
So who’s winning, who’s losing, and who’s still waiting in
INDV - Helping Trump Fight The Drug War In The US and Overseas.Thought this was a good example of the kind of stock I like to trade.
Not all of these have to be true to make it tradable. Just things I like to see.
Up over 100% over the last 12 months
Nice and steady price gains continuing to make higher highs
Had a good bump on earnings
Has had a recent

Nvidia Returns to Yearly Highs on Temporary Boost in ConfidenceNvidia’s stock started the week with a gain of more than 4%, maintaining a steady bullish bias after it was announced that the company will invest over $100 billion in OpenAI to support the development of artificial intelligence infrastructure. As part of the agreement, Nvidia is expected to receive

Supreme Court ruling could lift gold further Gold has climbed $410 over the past four weeks, reaching ~$3,750 today after an additional ~$60 gain.
The combination of political risk, questions over central bank independence, and robust technical momentum has positioned gold as one of the best performing assets.
The Supreme Court has appare

NZDUSD to find buyers at previous swing low?NZDUSD - 24h expiry
The selloff is close to an exhaustion count on the intraday chart.
We expect a reversal in this move.
Risk/Reward would be poor to call a buy from current levels.
A move through 0.5875 will confirm the bullish momentum.
The measured move target is 0.5900.
We look to Buy at

ANFIBO | BTCUSD Analysis – Weekly Trading PlanHi guys! It's me, Anfibo. My plan last week gave us a good profit selling from 118,000 USD to 115,000 USD.
And over the past weekend, BITSTAMP:BTCUSD consolidated in a sideways range, consistently holding above key support. However, with the opening of the new week’s Daily candle, the market deci

NIKE BREAKDOWN (NKE)...POTENTIAL LONG OPPORTUNITYHey hey Tradingview family!!! Joseph here AKA JosePips! Just wanted to come on this week and do a breakdown on the company Nike & what I see technically potentially happening next on this stock! In this video you will get a in depth breakdown of
1. Overall price action structure/context
2. Momentu

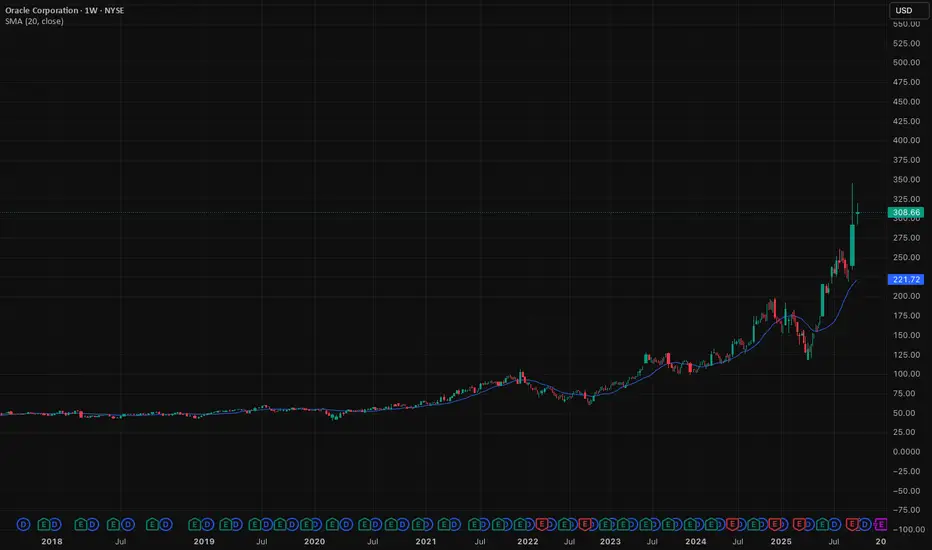
Oracle's surge is a bull market warningOracle has become the latest torch bearer of this market’s fever. A sharp, double-digit jump in days. Not because of numbers on a balance sheet, but because of mood. Sentiment is running wild, and traders are piling in.
These are the signs of caution experienced traders take during bull markets.
T
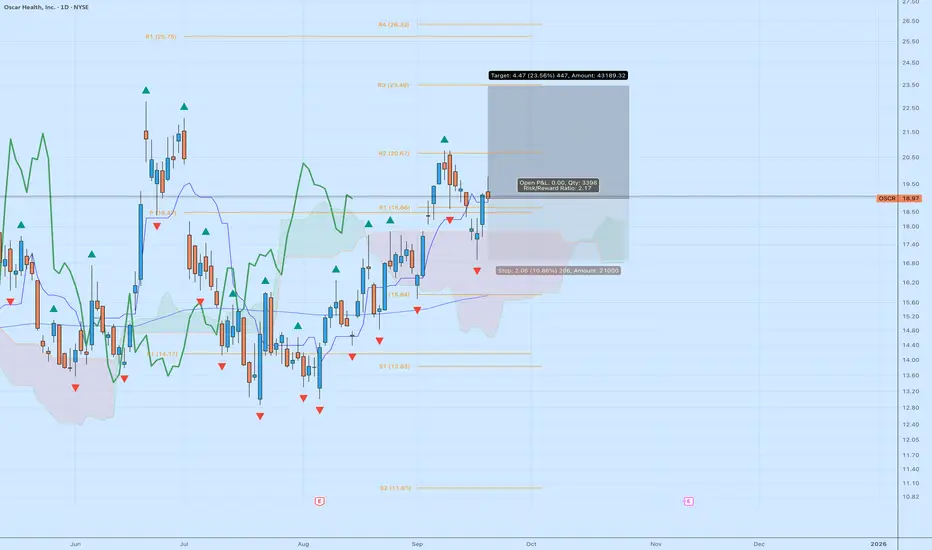
Oscar Health (OSCR) – Risk/Reward Setup Worth WatchingI’m tracking a long setup on NYSE:OSCR after a strong recovery trend that has been quietly building since the summer. It’s carving out a technical structure that offers a clean risk/reward.
Company Context
Oscar Health is a tech-driven health insurance company that’s been rebuilding its story i
See all editors' picks ideas
FiniteStateMachine🟩 OVERVIEW
A flexible framework for creating, testing and implementing a Finite State Machine (FSM) in your script. FSMs use rules to control how states change in response to events.
This is the first Finite State Machine library on TradingView and it's quite a different way to think about your

Trading Activity Index (Zeiierman)█ Overview
Trading Activity Index (Zeiierman) is a volume-based market activity meter that transforms dollar-volume into a smooth, normalized “activity index.”
It highlights when market participation is unusually low or high with a dynamic color gradient:
Light Blue → Low Activity (thin p

Expected Value Monte CarloI created this indicator after noticing that there was no Expected Value indicator here on TradingView.
The EVMC provides statistical Expected Value to what might happen in the future regarding the asset you are analyzing.
It uses 2 quantitative methods:
Historical Backtest to ground your anal

Bar Index & TimeLibrary to convert a bar index to a timestamp and vice versa.
Utilizes runtime memory to store the 𝚝𝚒𝚖𝚎 and 𝚝𝚒𝚖𝚎_𝚌𝚕𝚘𝚜𝚎 values of every bar on the chart (and optional future bars), with the ability of storing additional custom values for every chart bar.
█ PREFACE
This library aims to tackle s

Liquidity Void Detector (Zeiierman)█ Overview
Liquidity Void Detector (Zeiierman) is an oscillator highlighting inefficient price displacements under low participation. It measures the most recent price move (standardized return) and amplifies it only when volume is below its own trend.
Positive readings ⇒ strong up-move

DeltaFlow Volume Profile [BigBeluga]🔵 OVERVIEW
The DeltaFlow Volume Profile builds a compact volume profile next to price and enriches every bin with flow context : bullish vs. bearish participation (%), a per-bin Delta % , an optional Delta Heat Map , and a PoC band with the bin’s absolute volume. This lets you see not just

Volume by Time [LuxAlgo]The Volume by Time indicator collects volume data for every point in time over the day and displays the average volume of the specific dataset collected at each respective bar.
The indicator overlays the current volume and the historical average to allow for better comparisons.
🔶 USAGE
Thr

FlowScope [Hapharmonic]FlowScope: Uncover the Market's True Intent 🔬
Ever wished you could look inside the candles and see where the real action is happening? FlowScope is your microscope for the market's flow, designed to give you a powerful edge by revealing the volume distribution that price action alone can't sh

VWAP Price ChannelVWAP Price Channel cuts the crust off of a traditional price channel (Donchian Channel) by anchoring VWAPs at the highs and lows. By doing this, the flat levels, characteristic of traditional Donchian Channels, are no more!
Author's Note: This indicator is formed with no inherent use, and serves

Fibonacci Sequence Circles [BigBeluga]🔵 Overview
The Fibonacci Sequence Circles is a unique and visually intuitive indicator designed for the TradingView platform. It combines the principles of the Fibonacci sequence with geometric circles to help traders identify potential support and resistance levels, as well as price expansio

See all indicators and strategies
Community trends
Cava Group - Opportunity?Cava Group presents an opportunity. Sitting at the intersection of fast casual dining and the growing demand for healthier food, this is an interesting restaurant chain to keep an eye on. Especially after a 62% drop in price, perhaps a well deserved reset of expectation after revenue has slowed down

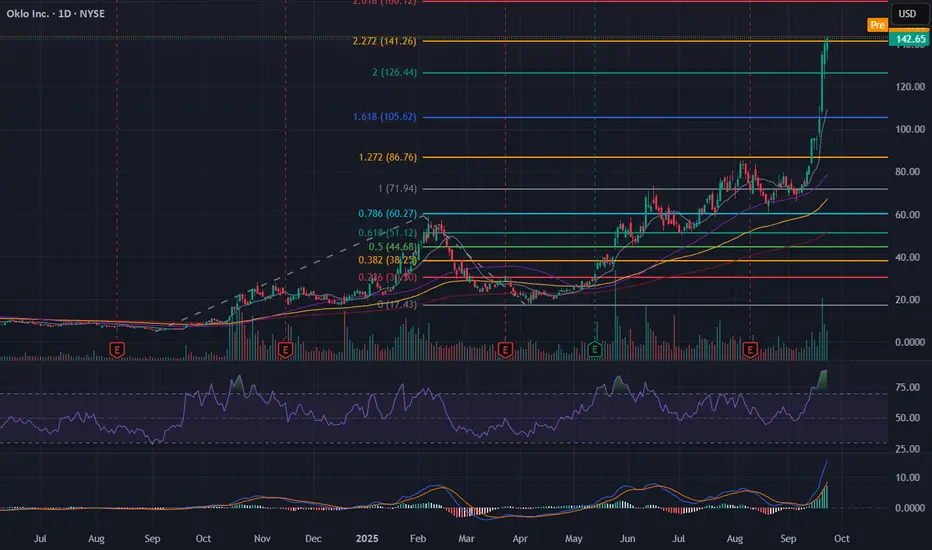
$OKLO - Overvalued?Oklo aims to develop small nuclear power plants and sell electricity under long-term power purchase agreements. The equity is priced ahead of the business: there is no operating revenue before first plant is online.
Business model:
- Revenue is expected to come from selling power under multi-year
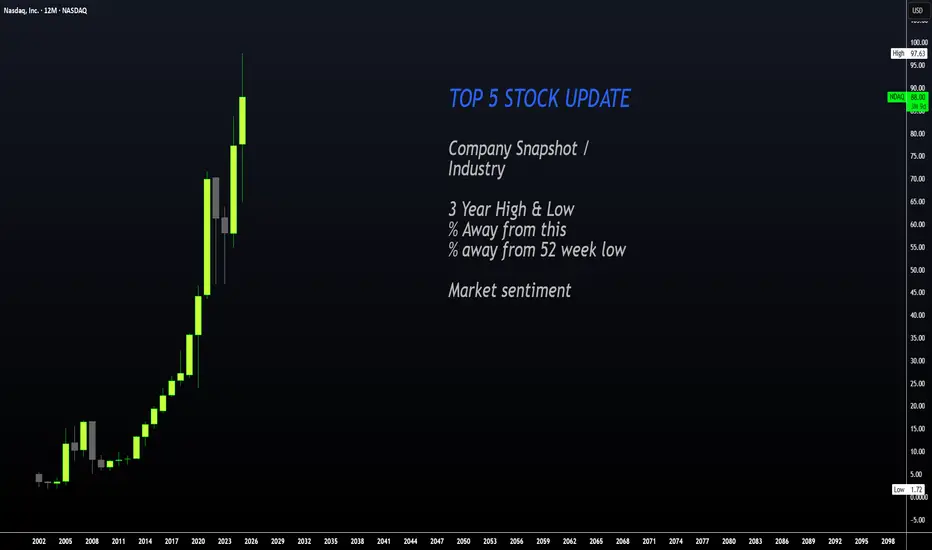
STOCKS Trading at 52 WEEK LOW - WatchlistHello Stonks Watchers 👀📈
Stocks that are hot on my watchlist right now for a possible buy , or a buy soon include:
1️⃣ Merck & Co. (MRK)
NYSE:MRK
Sector: Health Care
Last price: $81.51. 52-week low: $73.31.
% above 52-week low: 11.19%
Analysts are split: several bulls point to Keytruda
A great move for NIO IncNio has show some strength in the past days however it was not powerful enough. Nio according to my analyses will see a short as seen on the chart before making a greater move to the upside if we see a higher low formed and break of structure.
This is not a financial advice, just my opinion. Tell m

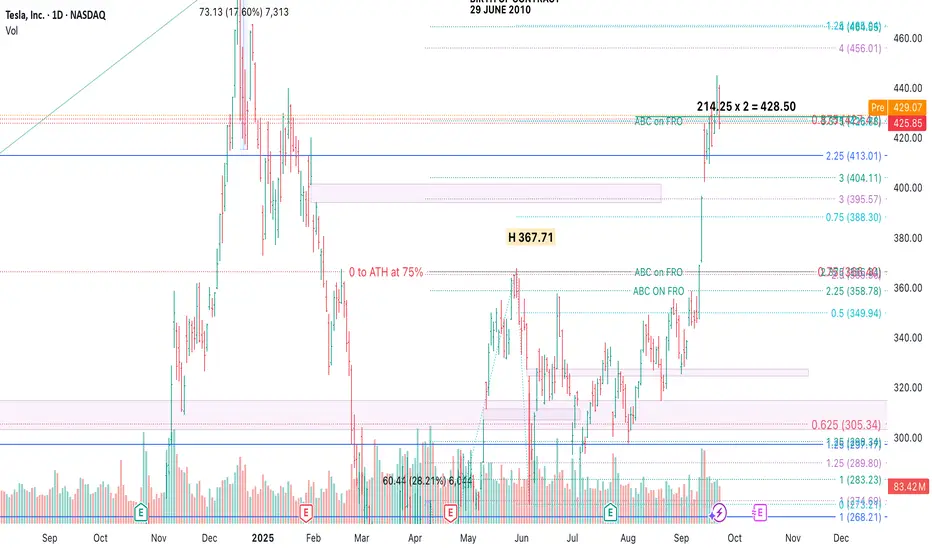
TSLA – Time & Price Relationships with ABC SetupThis chart highlights Tesla's price action through a potential ABC pattern, measured time cycles, and trend angles. The move from the April 2025 low to the recent September 2025 high spans 110 calendar days, mirroring a prior 110-day downswing — indicating possible time balance. Volume expansion sup
WDC is a SELL!!!Looking at the fundamentals this stocks earnings have slightly declined the last 11 years and yet it's back to the same point is was then. A volatile chart of ups and back downs, overbought here on all indicators I follow. First target is $71.45

Ferrari (RACE) Catalyst Scorecard AND 2026 OutlookFerrari (RACE) Catalyst Scorecard AND 2026 Outlook
________________________________________
1. 🏎 New Model Launches & Portfolio (9/10)
Ferrari’s 2023–26 lineup is packed with high-end launches. Recent additions include the Roma Spider, SF90 XX, 296 Challenge, and 499P Modificata. Demand for the

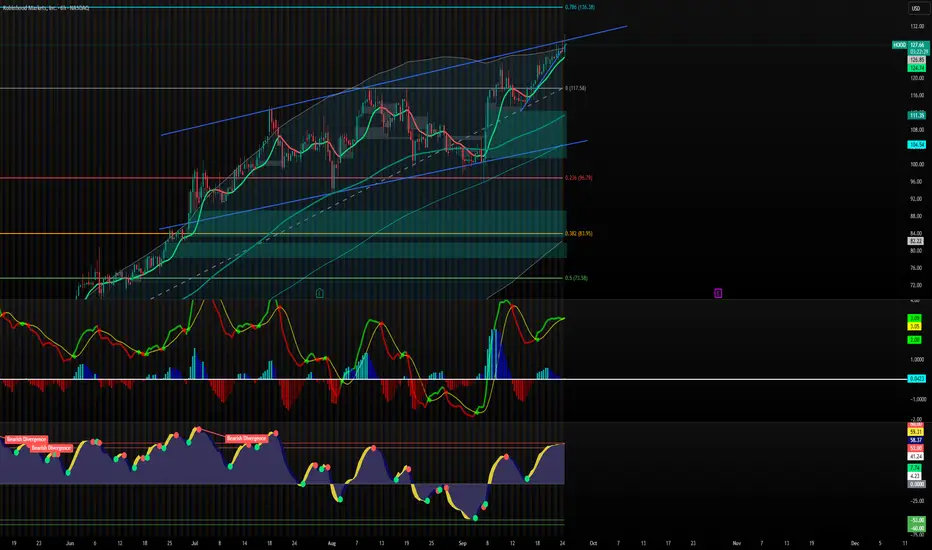
HOOD - Will it have a pullback ? Chart Breakdown
1. Price Action & Trend
Current price: ~128.19
The stock is moving inside a rising wedge channel (two converging upward blue lines).
Price is testing the upper resistance of the wedge — often a spot where momentum can stall or reverse.
Strong uptrend since late August, but this stee
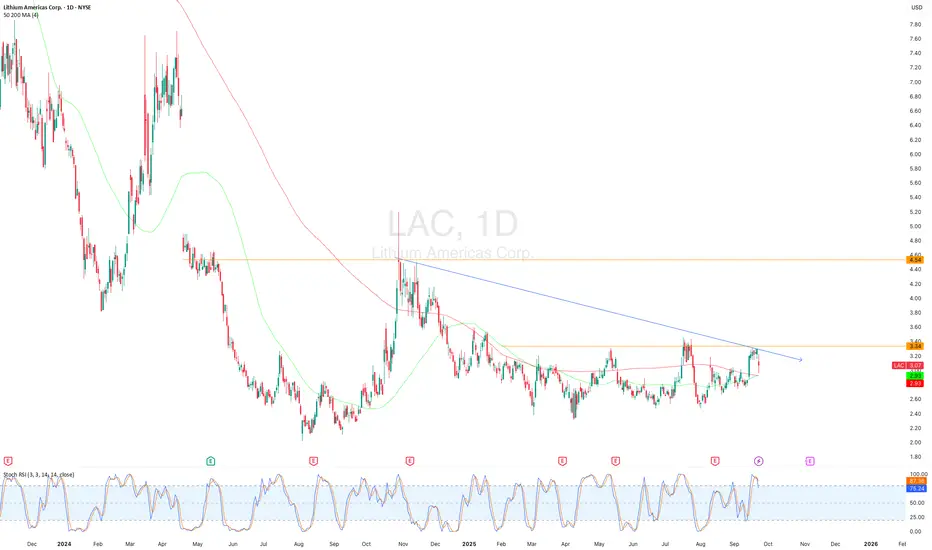
Watching $LAC Breakout: Gov’t Support Could Fuel Run HigherI’m bullish on $LAC. I've successfully traded this during the time of EV Hype and with some recent news development, this can get some tractions again. Here’s why I think this setup has teeth:
🔍 News Trigger
The U.S. government is negotiating an equity stake in Lithium Americas while it restructur
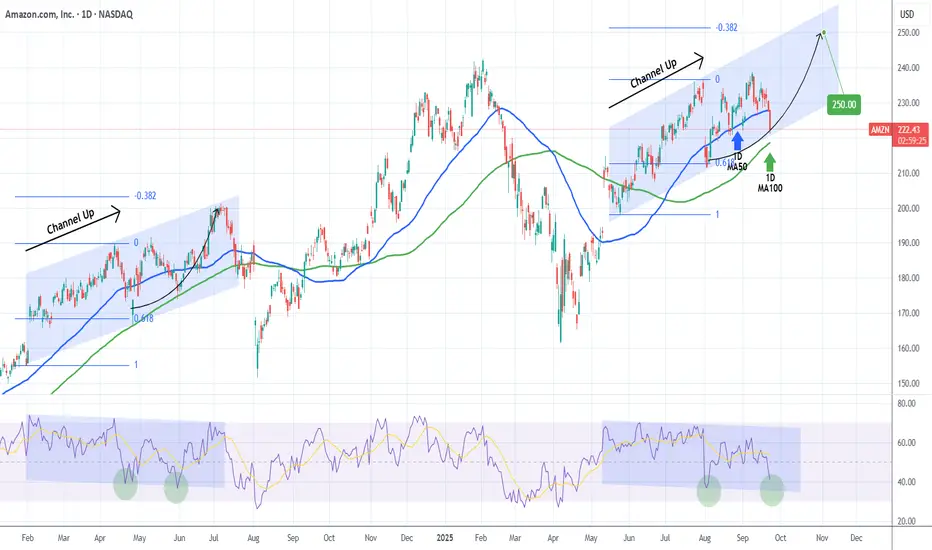
AMAZON Has it found a bottom?Amazon Inc. (AMZN) has been trading within a 4-month Channel Up and is currently pulling back on a Bearish Leg. The 1D MA100 (green trend-line) is just below and last time a similar Channel Up found support on it (May 31 2024), it rebounded for a -0.382 Fibonacci extension top.
As you can see, both
See all stocks ideas
Today
UECUranium Energy Corp.
Actual
−0.06
USD
Estimate
−0.04
USD
Today
THOThor Industries, Inc.
Actual
2.36
USD
Estimate
1.28
USD
Today
BNEDBarnes & Noble Education, Inc
Actual
—
Estimate
—
Today
DTSSDatasea Inc.
Actual
—
Estimate
—
Today
PZGParamount Gold Nevada Corp.
Actual
—
Estimate
−0.02
USD
Today
APOGApogee Enterprises, Inc.
Actual
—
Estimate
0.84
USD
Today
GMGIGolden Matrix Group, Inc.
Actual
—
Estimate
−0.00
USD
Today
CMTLComtech Telecommunications Corp.
Actual
—
Estimate
−0.75
USD
See more events
Community trends
Bear market has startedThe End of the Bull Cycle. Why I'm Selling Everything and Won't Buy Again Until September 2026.
For the last year and a half, I have said that we are in a bull market. I never once changed my opinion. But all things come to an end. The time has come.
September 13, 2025, the date I have been ment
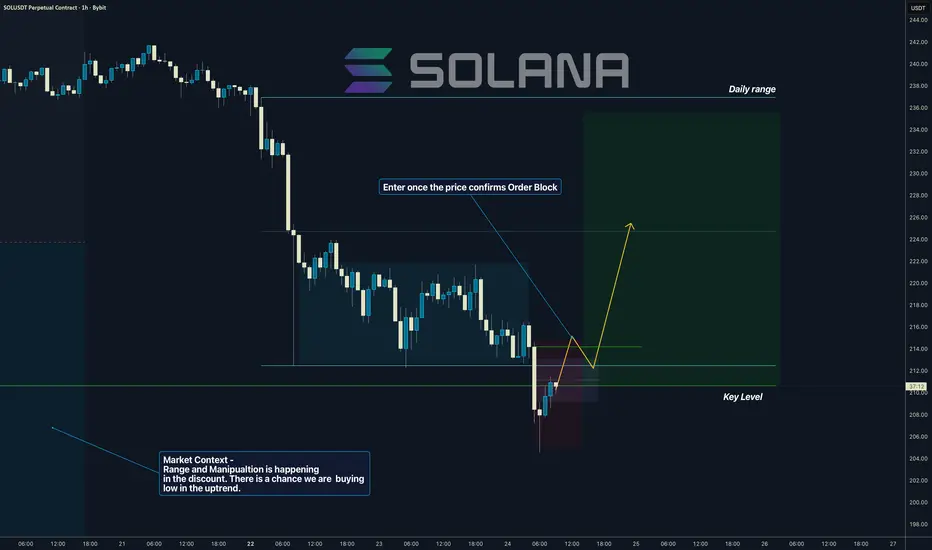
Solana I Daily Range I the discount - Manipulation phaseHi Traders, Solana is in the discount territory. Which means we are below a 50% of the latest up swing which is giving us nice trader probability for the patter.
📍
I have explained Premium / Discounts in this thread below
Price has created nice range which is being manipulated at this moment. In
Bitcoin (BTC/USDT): Uptrend ReinforcedHello everyone, after a brief pullback around 113,000 USD, Bitcoin has maintained its strength as it remains above the Ichimoku cloud – a clear signal that the uptrend has not weakened. The support zones at 111,000 USD and 110,000 USD are acting as crucial foundations, and if they hold, BTC could ea

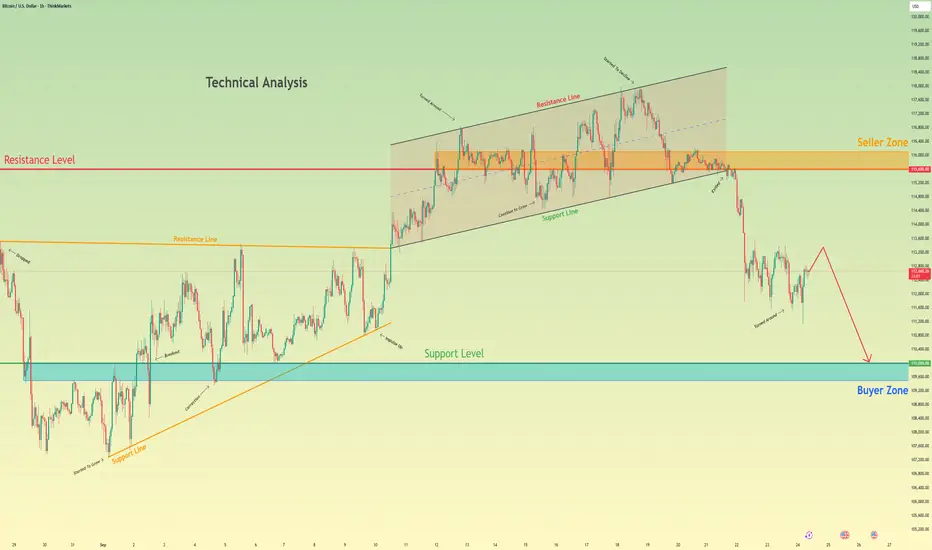
BTC Breakdown: Watching 112.6K-113.5K for Rejection Toward 109kHello guys!
Trend Structure:
The price was moving in a clear ascending channel, but recently broke down below the lower boundary with strong bearish momentum. This confirms a structural shift from bullish to bearish sentiment.
Current Price Action:
After the breakdown, BTC attempted a relief rally

Bitcoin Analysis: Key Level to WatchPrice sold off aggressively, and now it sits within a key reaction area.
We can see price just tapped into the 0.5 and 0.618 Fibonacci retracement level of the last leg up. This is the golden pocket, a place where markets tend to react often.
Now look closely: price is showing early signs of reject
Can Pi Network(PI) Bounce +15% From PRZ?In recent days, Pi Network ( OKX:PIUSDT ) has dropped more than -40% , raising the big question: Is Pi still a project we can rely on, or is momentum fading away?
Main Reasons Behind the Drop:
1-Mass token unlocks in September → Huge increase in supply created heavy selling pressure.
2-Ris

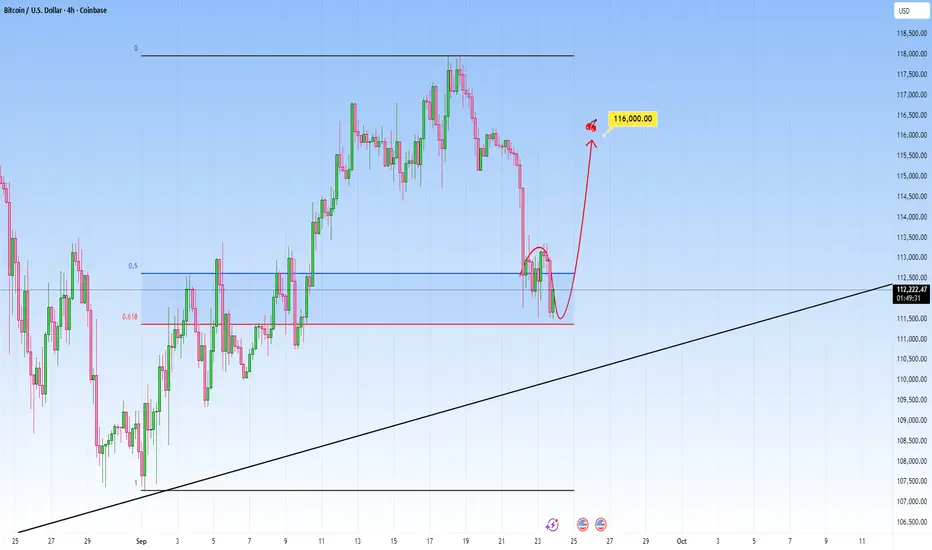
BTCUSD: Rally Back to 116000 ResistanceHello everyone, here is my breakdown of the current Bitcoin setup.
Market Analysis
The market for Bitcoin has seen a structural shift after breaking down from its prior Upward Channel. This event signaled a loss of bullish momentum and led to a sharp decline down to the major horizontal Support

Bitcoin analysis + Undead (UDS) coin +1000% in the next weeks!I would like to share with you this very promising altcoin, Undead UDS. I believe this coin will make 1000% profit in the next few weeks, so there is a huge opportunity to buy this altcoin. From a technical point of view this coin is very strong because we see an ascending structure (base), and soon

Ethereum: Bounce From Support, Eyes on $4,740Ethereum: Bounce From Support, Eyes on $4,740
Ethereum has bounced from the $4,050–$4,100 support zone.
If momentum continues, the next targets are $4,335 and $4,495, with the main resistance at $4,740.
As long as ETH holds above the support, the outlook is bullish with potential continuation

Bitcoin can Continue to Decline to Support LevelHello traders, I want share with you my opinion about Bitcoin. The market structure for Bitcoin has recently shifted to a bearish bias following a significant breakdown from its prior upward channel. After a complex consolidation within a triangle, the price of BTC made a final push to the highs nea
See all crypto ideas
Lingrid | GOLD Rally Targeting $3800 Resistance Level ?The price perfectly fulfilled my previous idea . OANDA:XAUUSD is pressing higher after breaking out of its consolidation channel and reclaiming the 3750 level. The market structure is supported by an upward trendline with successive higher highs confirming bullish momentum. As long as price holds

"XAUUSD Bullish Setup Toward 3800–3810"This chart shows the XAU/USD (Gold vs US Dollar) 1-hour analysis.
Price is currently trading around 3769 after a bullish move.
A support trend line is holding price momentum, suggesting buyers are still active above this level.
Immediate support is seen near 3753, while the trendline also aligns

Gold Bull Markets Long Term Overview and 2025 Market UpdateGold Bull Markets Long Term Overview and 2025 Market Update
________________________________________
• This cycle is different: record central-bank buying + renewed ETF inflows + lower real rates = powerful tailwind.
• Price: Gold notched fresh ATHs this month (up to $3,790.82). 2025 is shaping up

XAU/USD | GOLD Breaking Records – $4K Target Loading…!By analyzing the TVC:GOLD chart on the 1-hour timeframe, we can see that nothing seems to be stopping its series of new record highs — it almost feels like the $4,000 target isn’t too far away! Every small correction in gold is simply gathering more liquidity and demand to push toward higher lev

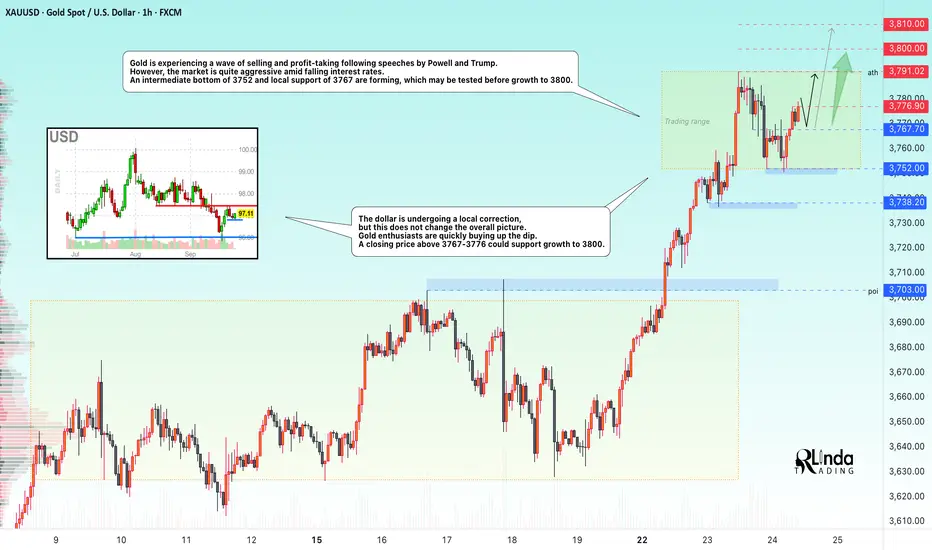
GOLD → Intermediate bottom. Consolidation before growth FX:XAUUSD is being sold off and declining amid profit-taking following speeches by Powell and Trump. However, the market is quite aggressive amid falling interest rates. After forming an interim bottom, the market quickly bought back the decline.
Gold is correcting after record growth, awaitin
Gold Continues to Probe for New Highs.👋Hello everyone, what do you think about the trend of OANDA:XAUUSD ?
Gold continued its upward momentum on Tuesday, reaching a new record high near 3800 USD. Persistent geopolitical tensions, the Federal Reserve's dovish stance, and signs of weakness in major economies in Europe and the U.S. see

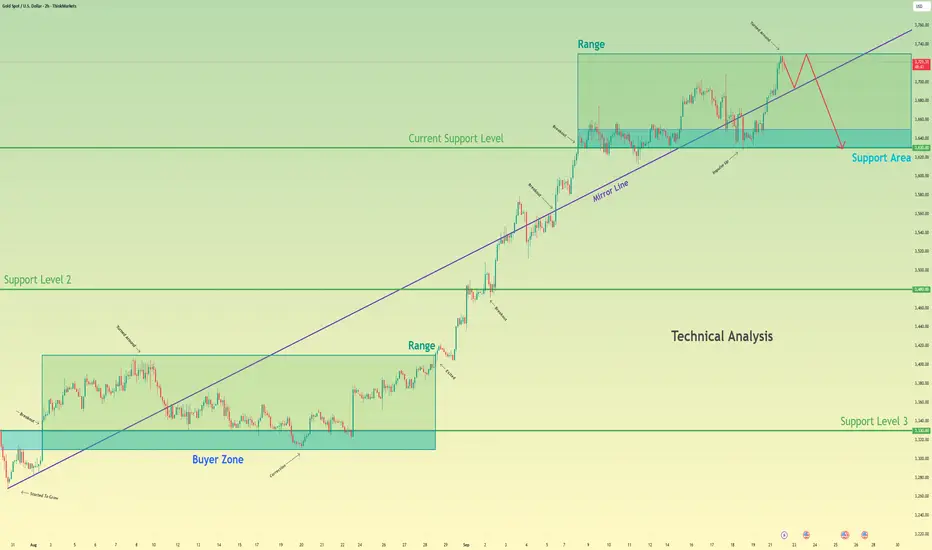
Gold can Complete its Topping Pattern and FallHello traders, I want share with you my opinion about Gold. The market has been developing a complex consolidation structure after its initial uptrend failed to sustain momentum. After breaking out of a first range, the bullish impulse failed, leading to a breakdown below the major ascending mirror
Gold 30Min Engaged ( Bullish Reversal Entry Detected )Time Frame: 30-Minute Warfare
Entry Protocol: Only after volume-verified breakout
🩸Bullish Reversal - 3750
➗ Hanzo Protocol: Volume-Tiered Entry Authority
➕ Zone Activated: Dynamic market pressure detected.
The level isn’t just price — it’s a memory of where they moved size.
Volume is rising benea
XAUUSD Long: Bullish Momentum to ContinueHello, traders! The price auction for XAUUSD has been in a strong bullish phase, confirmed by the establishment of a well-defined ascending channel. This uptrend was initiated after a breakout from lower levels and has shown significant strength by pushing through multiple prior resistance areas, in

GOLD 1H CHART ROUTE MAP UPDATEHey Everyone,
Another great day in the markets with our chart idea playing out to perfection!
Yesterday, after hitting 3692 and 3717 with cross-and-lock confirmation, we got another cross and lock above 3717, leaving 3742 open. That level was hit perfectly today, followed by another cross and lock

See all futures ideas
USD/JPY - Bullish Channel, Next Targeting 148.95 (23.09.2025)#USDJPY #Forex #Trading #TechnicalAnalysis
USD/JPY is trading within a Bullish Channel Pattern on the 30M chart, holding above the rising trendline support. The pair is bouncing from the support zone (147.50 – 147.70), signaling potential upside continuation.
🔹 Market Structure:
Bullish channel i

NZD/CAD: Time to Recover?!NZDCAD approached an important daily horizontal structure support level.
The subsequent test of this level halted the bearish momentum.
Furthermore, the market formed an inverted head and shoulders pattern on the 4-hour timeframe, subsequently breaching its neckline, thereby providing a clear bull

EUR/USD: Bullish Momentum Continues ? 👋Hello everyone, what do you think about the trend of FX:EURUSD ?
Today, EUR/USD continues to solidify its bullish momentum as it breaks through the key resistance level of 1.1800. This upward movement occurs amid a lack of stability in the US Dollar, declining US Treasury yields, and ongoing sp

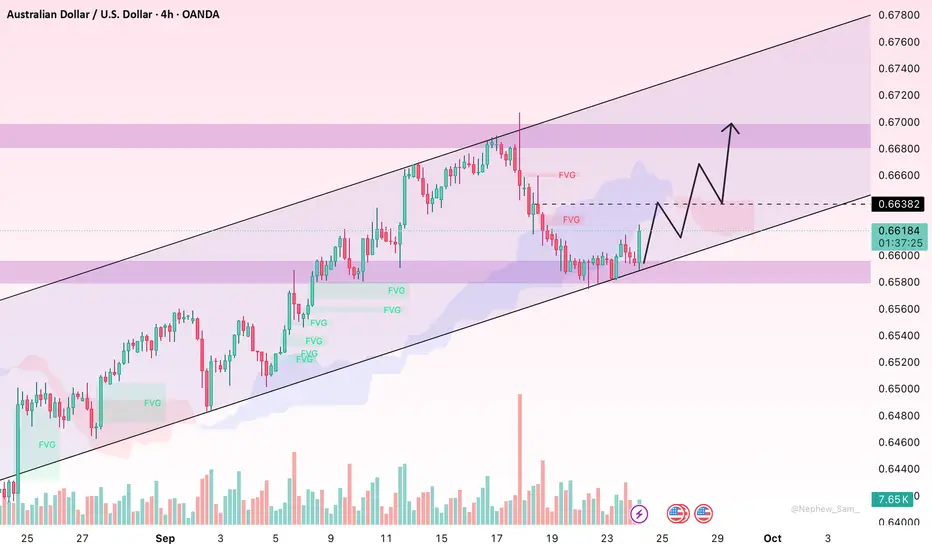
AUD/USD: Mild Uptrend and Key Levels to WatchHello everyone,
AUD/USD is currently maintaining a mild uptrend after breaking above 0.6590 and holding steady above 0.6600. On the chart, Fair Value Gaps (FVGs) appear as imbalances in price, which could act as areas where the market may revisit before resuming the trend.
From a technical standp
EURUSD Pullback Toward 1.17400 as DXY Struggles Below 99Hey Traders, in today's trading session we are monitoring EURUSD for a buying opportunity around the 1.17400 zone. The pair is trading in an uptrend, with price currently correcting toward this key support/resistance level.
Structure: The broader bias remains bullish, but price is pulling back afte

GBPCHF: Time For Another Upward MovementGBPCHF: Time For Another Upward Movement
The pair is trading inside a descending channel, respecting both support and resistance levels. Price recently bounced from the channel support, showing signs of a possible short-term recovery.
If buyers remain in control, the first target is around 1.0767

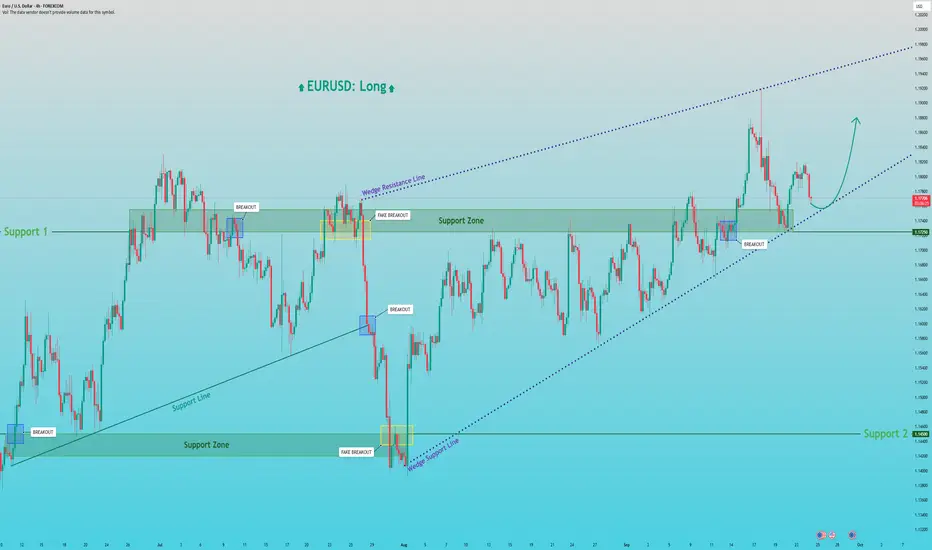
EURUSD: Rally from Wedge Support to 1.1880Hello everyone, here is my breakdown of the current Euro setup.
Market Analysis
A prior uptrend failed, leading to a sharp drop down to the major Support zone 2 around the 1.1450 level. However, strong buying pressure emerged from that low, initiating a powerful reversal and establishing the cu
24.09.25 Morning ForecastPairs on Watch -
FX:AUDJPY
FX:EURAUD
FX:NZDUSD
A short overview of the instruments I am looking at for today, multi-timeframe analysis down to what I will be looking at for an entry. Enjoy!

EUR/USD is poised for a significant moveHey everyone, it's Ken here!
Looking at the EUR/USD chart on the H2 timeframe, I have to say, things are looking pretty solid. The price is moving around, but notice how it's climbing slowly and steadily. This tells me the buyers are getting active and feeling bullish.
That said, I'm not jumping i

EURUSD: Ready to Break HigherHello traders, EURUSD is currently supported by both fundamentals and technicals.
Fundamentals:
The Eurozone PMI for September hit a 16-month high, signaling that the economy remains in expansion mode. Meanwhile, the USD is weakening as the Fed shows caution toward cutting interest rates. These

See all forex ideas
| - | - | - | - | - | - | - | ||
| - | - | - | - | - | - | - | ||
| - | - | - | - | - | - | - | ||
| - | - | - | - | - | - | - | ||
| - | - | - | - | - | - | - | ||
| - | - | - | - | - | - | - | ||
| - | - | - | - | - | - | - | ||
| - | - | - | - | - | - | - |
Trade directly on the supercharts through our supported, fully-verified and user-reviewed brokers.


