Investing in Bonds in the Global MarketIntroduction
In the ever-evolving landscape of global finance, bonds remain one of the most stable and reliable investment instruments. While equity markets often capture headlines with their volatility and potential for massive returns, the bond market — valued at over $130 trillion globally — forms the bedrock of the world’s financial system. Bonds provide essential capital for governments and corporations while offering investors predictable income streams and portfolio diversification.
Investing in bonds in the global market involves understanding the different types of bonds available, their risk-return characteristics, how interest rate movements influence them, and the factors shaping the global fixed-income environment. This essay explores the nature of global bond investing, its benefits, challenges, strategies, and the evolving dynamics in an interconnected global economy.
1. Understanding Bonds and Their Global Role
A bond is a debt security issued by a borrower — typically a government, municipality, or corporation — to raise funds from investors. In exchange, the issuer agrees to pay periodic interest (known as the coupon) and return the principal on maturity. In essence, bond investors are lenders rather than owners, unlike equity investors who hold a stake in a company.
The global bond market is divided broadly into:
Sovereign Bonds – Issued by national governments (e.g., U.S. Treasuries, German Bunds, Japanese Government Bonds).
Corporate Bonds – Issued by private or public corporations to finance operations or expansions.
Municipal Bonds – Issued by states, cities, or other local governments (mostly in the U.S.).
Supranational Bonds – Issued by international institutions like the World Bank or the European Investment Bank.
Global investors allocate funds to these instruments across various geographies to diversify risk and capture stable returns.
2. The Structure and Dynamics of the Global Bond Market
The global bond market is larger than the global stock market and plays a critical role in facilitating liquidity and funding across economies. It operates through both primary markets (where new bonds are issued) and secondary markets (where investors trade existing bonds).
The U.S. dominates the bond market, followed by the Eurozone, Japan, and China. Emerging markets have also become increasingly active players, issuing bonds denominated in both local and foreign currencies to attract international investors.
Key indicators in the bond market include:
Yield to Maturity (YTM): The total return expected if the bond is held to maturity.
Credit Rating: An assessment of the issuer’s creditworthiness, provided by agencies like Moody’s, S&P, and Fitch.
Duration and Convexity: Measures that indicate the bond’s sensitivity to interest rate changes.
These metrics help investors assess potential risks and rewards in a global portfolio.
3. Benefits of Investing in Global Bonds
a. Diversification
Investing in global bonds provides geographic diversification. Since interest rates, inflation, and economic cycles vary across countries, exposure to multiple bond markets reduces the portfolio’s overall volatility.
b. Stability and Predictable Income
Unlike equities, bonds provide fixed coupon payments, offering a predictable income stream. This stability attracts conservative investors, such as pension funds and retirees.
c. Risk Management
Bonds, especially government and high-grade corporate bonds, often act as a hedge during equity market downturns. When stock markets fall, investors typically move toward safer assets, driving bond prices higher.
d. Access to Foreign Currencies
Investing in foreign bonds can provide exposure to different currencies, offering potential gains from favorable exchange rate movements.
e. Inflation Protection
Certain bonds, such as inflation-indexed securities (like U.S. TIPS or U.K. Index-linked Gilts), adjust their principal and interest payments based on inflation, preserving real returns.
4. Risks in Global Bond Investing
While bonds are often viewed as safer than equities, they are not risk-free. Investing globally introduces additional layers of complexity.
a. Interest Rate Risk
Bond prices and interest rates move inversely. When global central banks raise rates, existing bonds with lower yields lose value. Hence, global investors must monitor monetary policies across major economies.
b. Credit Risk
There is a risk that the bond issuer may default on payments. Emerging-market bonds and corporate bonds typically carry higher credit risk compared to sovereign bonds of developed nations.
c. Currency Risk
Investing in bonds denominated in foreign currencies exposes investors to exchange rate fluctuations. For instance, if the U.S. dollar strengthens, returns from euro-denominated bonds may diminish for dollar-based investors.
d. Liquidity Risk
Certain bonds, especially those from smaller issuers or emerging markets, may have limited trading activity, making it difficult to sell them quickly without a price concession.
e. Geopolitical and Economic Risk
Global events such as wars, trade tensions, sanctions, and political instability can disrupt bond markets, particularly in developing regions.
5. Types of Global Bonds
a. Government Bonds
Issued by sovereign states, these bonds are considered the safest investments. Examples include:
U.S. Treasury Bonds – Global benchmark for risk-free rates.
German Bunds – The eurozone’s standard for stability.
Japanese Government Bonds (JGBs) – Used by investors seeking ultra-low yields but high safety.
b. Corporate Bonds
Issued by companies to raise capital. They offer higher yields than government bonds but with added credit risk. Global giants like Apple, Toyota, or Shell issue bonds accessible to global investors.
c. Emerging Market Bonds
Issued by developing economies (e.g., Brazil, India, South Africa). These bonds offer higher yields due to elevated risk but can be rewarding in periods of global growth.
d. Eurobonds
Issued in a currency different from the issuer’s home currency. For example, a Japanese company might issue dollar-denominated bonds in Europe. These instruments enhance global liquidity.
e. Green and Sustainable Bonds
An emerging category where proceeds are used for environmental or social projects. These have gained significant traction as investors prioritize ESG (Environmental, Social, and Governance) criteria.
6. Factors Influencing Global Bond Markets
a. Central Bank Policies
Interest rate decisions by central banks such as the U.S. Federal Reserve, European Central Bank, and Bank of Japan significantly impact bond yields globally. Quantitative easing and tightening cycles influence global liquidity and investor sentiment.
b. Inflation Trends
Rising inflation erodes real returns on fixed-income investments, leading investors to demand higher yields. Conversely, low inflation boosts bond prices.
c. Fiscal Deficits and Public Debt
Countries with large fiscal deficits may need to issue more bonds, influencing supply and yield levels. Investors also consider debt sustainability when investing globally.
d. Global Capital Flows
Institutional investors and sovereign wealth funds allocate massive capital across borders, affecting demand and yield spreads among regions.
e. Geopolitical and Economic Stability
Stable economies attract more bond investors. Events like Brexit, wars, or trade conflicts can trigger capital flight or yield volatility.
7. Strategies for Global Bond Investing
a. Active vs. Passive Investing
Active managers analyze global economic trends, interest rate expectations, and credit cycles to select bonds that may outperform. Passive investors, on the other hand, prefer bond index funds or ETFs that track global benchmarks such as the Bloomberg Global Aggregate Bond Index.
b. Currency Hedging
To mitigate currency risk, investors often use hedging tools like forward contracts or currency-hedged ETFs. This helps stabilize returns in home-currency terms.
c. Duration Management
Investors adjust portfolio duration based on interest rate outlooks. When rates are expected to rise, shorter-duration bonds are preferred to minimize price losses.
d. Credit Spread Analysis
Monitoring credit spreads — the yield difference between corporate and government bonds — helps investors gauge market sentiment and risk appetite.
e. Diversification Across Regions
Allocating investments across developed and emerging markets balances risk and return potential. For instance, combining U.S. Treasuries with Indian or Brazilian bonds can enhance yield without extreme exposure.
8. Role of Technology and Innovation
Technological innovation has transformed global bond investing. Electronic trading platforms have improved liquidity and transparency, while data analytics and artificial intelligence help investors identify opportunities faster.
Moreover, tokenized bonds — digital versions of traditional bonds traded on blockchain platforms — are emerging, promising greater accessibility and efficiency in global debt markets.
9. The Future of Global Bond Investing
The future of global bond markets will be shaped by several key trends:
Sustainability Focus: Growing demand for green and ESG-compliant bonds.
Digitalization: Blockchain-based issuance and trading to reduce costs.
Emerging Market Growth: As developing nations expand, their bond markets will attract more global investors.
Interest Rate Normalization: Following years of low or negative rates, the post-2020 era may witness gradual normalization, impacting bond valuations.
Geopolitical Realignment: Shifts in global power structures and currency preferences (e.g., de-dollarization trends) will influence international bond flows.
10. Conclusion
Investing in bonds in the global market offers investors a unique blend of safety, income stability, and diversification. While equities may deliver higher returns, bonds provide the essential balance in a diversified portfolio, helping manage risk and protect capital during volatile times.
However, success in global bond investing requires understanding complex factors — interest rate movements, currency dynamics, credit risks, and geopolitical developments. With proper strategy, diversification, and risk management, investors can harness the immense opportunities in the global bond market while safeguarding their wealth.
In an interconnected world, bonds remain not just a tool for income generation but a cornerstone of global financial stability. As economies evolve, technologies advance, and sustainability takes center stage, global bond investing will continue to adapt — offering investors both security and growth in an uncertain yet opportunity-rich financial landscape.
Chart Patterns

Risk in Global Market TradingIntroduction
Global market trading has revolutionized the way capital flows across borders, offering investors opportunities to diversify portfolios and seek higher returns. However, with these opportunities comes a complex landscape of risk. In today’s interconnected world, financial markets are influenced not only by domestic economic indicators but also by global monetary policies, geopolitical developments, and systemic events that can ripple across economies within minutes. Understanding risk in global market trading is, therefore, not merely a technical skill—it is a strategic necessity for investors, policymakers, and institutions alike.
Risk in global markets can manifest in numerous forms: market volatility, currency fluctuations, liquidity constraints, credit defaults, geopolitical instability, and systemic failures. Each type of risk interacts with others in dynamic and often unpredictable ways. This essay explores the multifaceted nature of risk in global market trading, the major types of risks faced by traders and investors, methods of risk assessment and mitigation, and the evolving landscape of risk management in the age of technology and globalization.
1. Understanding the Concept of Risk in Global Trading
In finance, risk refers to the potential for loss due to uncertainty about future outcomes. In global trading, risks are magnified because of exposure to multiple markets, asset classes, and currencies. These risks can stem from both systematic factors—such as global recessions, inflationary pressures, or changes in monetary policy—and unsystematic factors like firm-level management inefficiencies or localized political issues.
Risk is inherent to every trading decision. Global market participants—from institutional investors and hedge funds to retail traders—must therefore adopt robust risk management frameworks to identify, quantify, and manage potential losses. The challenge lies not only in measuring risk but also in anticipating the speed and scale at which it can materialize in interconnected markets.
2. Major Types of Risks in Global Market Trading
a) Market Risk
Market risk, also known as systematic risk, refers to the potential loss arising from adverse movements in market prices, including equity prices, interest rates, and commodity values. In global markets, volatility is driven by a complex interplay of macroeconomic trends, investor sentiment, and technological innovation. For instance, the 2008 financial crisis demonstrated how global equity markets can collapse simultaneously due to interconnected leverage structures and liquidity shortages.
Market risk can be categorized into:
Equity risk: arising from fluctuations in stock prices.
Interest rate risk: caused by unexpected changes in central bank rates or bond yields.
Commodity price risk: influenced by supply-demand dynamics, trade policies, and energy market disruptions.
Effective hedging through derivatives such as options and futures contracts is a key strategy to mitigate market risk in global trading.
b) Currency (Exchange Rate) Risk
In global trading, currency risk—or foreign exchange risk—is one of the most significant factors affecting profitability. Traders dealing in multiple currencies face potential losses due to fluctuations in exchange rates. For example, an Indian investor holding U.S. stocks may see returns decline if the U.S. dollar depreciates against the Indian rupee, even if the stock prices themselves rise.
Exchange rate risk arises from three primary exposures:
Transaction exposure: when settlements in foreign currencies are affected by exchange rate changes.
Translation exposure: when multinational companies consolidate financial statements from subsidiaries in different currencies.
Economic exposure: reflecting the broader impact of exchange rate movements on a firm’s competitiveness and cash flows.
Traders often use forward contracts, currency swaps, or natural hedging (offsetting currency inflows and outflows) to manage foreign exchange risks effectively.
c) Credit Risk
Credit risk arises when a counterparty fails to fulfill its contractual obligations—such as in derivative transactions, margin trading, or securities lending. In global markets, the interdependence of institutions amplifies this risk. The collapse of Lehman Brothers in 2008 is a stark reminder of how the default of one major entity can trigger widespread systemic consequences.
Credit risk management involves assessing counterparties’ creditworthiness, setting exposure limits, and using credit derivatives such as credit default swaps (CDS) to hedge against potential losses.
d) Liquidity Risk
Liquidity risk occurs when traders are unable to buy or sell assets quickly enough to prevent or minimize losses. In times of financial stress, even highly rated assets can become illiquid, leading to sharp declines in prices. The global financial crisis demonstrated how liquidity dry-ups can paralyze entire markets.
There are two types of liquidity risk:
Market liquidity risk: when there are not enough buyers or sellers.
Funding liquidity risk: when an institution cannot meet short-term obligations due to cash flow shortages.
To mitigate liquidity risk, traders maintain diversified portfolios, establish credit lines, and implement stress-testing mechanisms that simulate liquidity crunches.
e) Political and Geopolitical Risk
Global trading is highly sensitive to political developments, regulatory changes, and international conflicts. Geopolitical risk encompasses factors such as wars, sanctions, trade disputes, and regime changes that can disrupt financial flows and investor confidence. For example, the Russia-Ukraine conflict significantly impacted energy markets, commodities, and foreign exchange rates worldwide.
Political risk also includes changes in taxation policies, foreign investment restrictions, or sudden nationalization of assets. Investors often mitigate these risks through geographical diversification, political risk insurance, and by closely monitoring global news and policy trends.
f) Operational and Technological Risk
Operational risk arises from failures in internal processes, systems, or human errors. In global markets that rely heavily on high-frequency trading (HFT) and algorithmic systems, technological failures can cause severe disruptions. Cybersecurity threats—such as hacking of trading platforms or data breaches—pose additional layers of operational risk.
To manage these risks, institutions invest in robust IT infrastructure, enforce compliance protocols, and develop contingency plans to ensure business continuity in the event of system failures or cyber incidents.
g) Systemic and Contagion Risk
Systemic risk refers to the potential collapse of an entire financial system due to the failure of interconnected participants. The globalization of finance has heightened this risk, as crises in one region can rapidly spread to others—a phenomenon known as contagion. The Asian Financial Crisis (1997) and the Global Financial Crisis (2008) illustrated how cross-border linkages in banking and capital markets can amplify local shocks into global turmoil.
Central banks and regulators attempt to contain systemic risk through macroprudential policies, capital adequacy requirements, and coordinated international responses.
3. Measuring and Managing Risk in Global Markets
Effective risk management relies on both quantitative analysis and strategic oversight. Some of the key methods include:
a) Value at Risk (VaR)
Value at Risk estimates the maximum potential loss of a portfolio over a specific time period with a given confidence level. It is a standard tool for quantifying market risk.
b) Stress Testing and Scenario Analysis
These techniques simulate extreme market conditions (e.g., a global recession, oil shock, or currency collapse) to assess how portfolios would perform under stress.
c) Diversification
Diversifying assets across geographies, industries, and currencies reduces exposure to any single source of risk.
d) Hedging with Derivatives
Options, futures, swaps, and other derivatives allow traders to offset potential losses from adverse price movements.
e) Risk-Adjusted Performance Metrics
Metrics such as the Sharpe ratio and Treynor ratio help traders evaluate returns relative to the level of risk undertaken.
f) Regulatory and Compliance Frameworks
Global financial institutions are governed by frameworks like Basel III (for banks) and MiFID II (for European markets), which set standards for risk management, leverage, and transparency.
4. The Role of Technology in Risk Management
Technological advancements have transformed risk management in global trading. Artificial intelligence (AI), machine learning (ML), and big data analytics enable real-time risk monitoring and predictive modeling. Algorithms can detect patterns of volatility, forecast potential price shocks, and execute hedging strategies within milliseconds.
Blockchain technology enhances transparency and reduces counterparty risks by providing immutable transaction records. Meanwhile, RegTech (Regulatory Technology) automates compliance processes, ensuring that firms adhere to global regulations efficiently.
However, technology itself introduces new risks—such as model risk (errors in algorithmic assumptions) and cyber risk—which require ongoing vigilance.
5. The Interconnected Nature of Global Risk
Global markets do not operate in isolation. An event in one market—such as a policy shift by the U.S. Federal Reserve or a slowdown in China’s economy—can influence currencies, commodities, and equities worldwide. The COVID-19 pandemic was a striking example of how health crises can evolve into financial crises, disrupting global supply chains and triggering market panic.
Therefore, traders and investors must adopt a holistic approach to risk, recognizing the interdependence of financial systems. Global coordination among regulators and central banks, along with international cooperation through institutions like the IMF and World Bank, is essential for maintaining stability.
6. Emerging Risks in the Modern Trading Landscape
The future of global trading brings new categories of risks:
Climate risk: Extreme weather events and regulatory shifts toward green energy affect asset valuations and commodity prices.
Cyber risk: Increasing digitalization exposes markets to hacking and data theft.
AI and algorithmic trading risk: Autonomous trading systems can cause flash crashes if algorithms malfunction.
Regulatory divergence: As nations adopt differing post-crisis regulations, cross-border compliance becomes complex.
Social and reputational risk: Public sentiment, ESG (Environmental, Social, and Governance) issues, and social media trends increasingly influence market behavior.
7. Strategies for Effective Global Risk Governance
An effective risk governance framework integrates strategic oversight with operational discipline:
Establish clear risk appetite and tolerance limits.
Develop independent risk management functions to oversee exposures.
Foster a risk-aware culture across all levels of an organization.
Continuously update risk models based on evolving market data.
Enhance communication and transparency between traders, regulators, and investors.
Conclusion
Risk in global market trading is both inevitable and indispensable. Without risk, there would be no return; yet unmanaged risk can lead to catastrophic losses. As globalization deepens and markets become more interlinked, traders face a web of challenges—from market volatility and currency fluctuations to technological vulnerabilities and systemic contagion.
The key to thriving in this environment lies in understanding, measuring, and managing these risks with precision and foresight. By combining advanced analytics, diversified strategies, strong governance, and adaptive technologies, market participants can navigate uncertainty and harness global opportunities while safeguarding their capital. In essence, successful global trading is not about avoiding risk—but mastering it.

Quantitative and Algorithmic Trading in the Global MarketIntroduction
In the ever-evolving world of financial markets, quantitative and algorithmic trading have emerged as the twin engines powering modern investment and trading strategies. They represent the fusion of finance, mathematics, statistics, and computer science to create data-driven, rule-based systems capable of executing trades with precision and speed beyond human capability. Over the past three decades, these methods have transformed global trading dynamics — reshaping liquidity, price discovery, and even the structure of exchanges. Quantitative and algorithmic trading now dominate trading volumes in equities, forex, commodities, and derivatives markets worldwide.
This essay explores the concepts, strategies, technologies, advantages, and risks associated with quantitative and algorithmic trading, as well as their impact on global financial markets.
Understanding Quantitative and Algorithmic Trading
Quantitative trading refers to the use of mathematical and statistical models to identify trading opportunities. It relies heavily on quantitative analysis, which involves collecting large sets of historical and real-time market data, identifying patterns, and forecasting potential price movements. Quantitative traders, often called “quants,” use sophisticated models to test hypotheses and develop systematic strategies for profit generation.
Algorithmic trading (Algo trading), on the other hand, is the practical implementation of these quantitative models through computer algorithms that automatically execute trades. It involves predefined instructions that specify when, how, and how much to trade, based on parameters such as timing, price, volume, and market conditions.
In simple terms, quantitative trading focuses on the “why” — the logic and mathematical framework — while algorithmic trading handles the “how” — the automation and execution of the strategy.
Historical Evolution
The roots of quantitative trading can be traced back to the 1970s when computers were first used for portfolio optimization and risk management. Pioneers like Edward Thorp, the author of Beat the Market, applied probability theory to stock trading and option pricing, laying the foundation for quant finance.
The 1980s and 1990s witnessed the rise of electronic trading platforms, which enabled automated order matching. Firms like Renaissance Technologies and D.E. Shaw built statistical arbitrage models that consistently delivered high returns using advanced mathematics.
By the 2000s, algorithmic trading became mainstream, aided by technological progress, faster data transmission, and regulatory changes such as the U.S. SEC’s approval of electronic communication networks (ECNs). High-Frequency Trading (HFT) — the fastest form of algorithmic trading — emerged, executing thousands of orders in milliseconds. Today, more than 70% of equity trades in developed markets like the U.S. and Europe are executed algorithmically.
Core Components of Quantitative and Algorithmic Trading
Data Acquisition and Management
Data is the lifeblood of quantitative trading. Traders collect massive datasets — historical prices, order book information, news sentiment, economic indicators, and alternative data such as satellite images or social media trends. This data is cleaned, normalized, and stored for analysis using advanced databases and cloud computing systems.
Model Development and Backtesting
Quant models are developed using statistical and machine learning techniques to forecast price movements or detect inefficiencies. Backtesting evaluates these models on historical data to verify performance and robustness before deployment in live markets.
Execution Algorithms
Algorithms are designed to execute trades efficiently while minimizing market impact and transaction costs. Common execution algorithms include Volume Weighted Average Price (VWAP), Time Weighted Average Price (TWAP), and Percentage of Volume (POV).
Risk Management Systems
Every quantitative model includes strict risk controls — such as stop-loss mechanisms, position limits, and exposure checks — to protect against unforeseen market events and model failures.
Infrastructure and Technology
Cutting-edge hardware, low-latency networks, and co-location services (placing trading servers near exchange data centers) are essential for high-frequency and algorithmic trading. Millisecond delays can mean the difference between profit and loss.
Types of Quantitative and Algorithmic Strategies
Statistical Arbitrage
This involves exploiting short-term price inefficiencies between related securities. For instance, pairs trading identifies two correlated assets — when their price relationship diverges, one is bought and the other is sold short, expecting reversion to the mean.
Trend-Following Models
These algorithms capitalize on persistent market trends using indicators like moving averages or momentum oscillators. When the price breaks above a defined resistance, a buy signal is triggered.
Mean Reversion Strategies
Based on the idea that prices tend to revert to their long-term average, these models look for overbought or oversold conditions.
Market Making Algorithms
Market makers continuously quote buy and sell prices, earning the bid-ask spread while providing liquidity. Algorithms dynamically adjust quotes based on volatility and order flow.
High-Frequency Trading (HFT)
HFT strategies execute thousands of trades per second to exploit micro-inefficiencies. Techniques include latency arbitrage and order anticipation.
Machine Learning-Based Strategies
Modern quants increasingly use artificial intelligence and deep learning models to analyze nonlinear patterns in large datasets, from news sentiment to macroeconomic variables.
Event-Driven Trading
Algorithms react to real-time events such as earnings announcements, mergers, or geopolitical developments. For example, a positive earnings surprise may trigger a buy signal.
Index Arbitrage and ETF Strategies
These exploit price differences between index futures, exchange-traded funds, and their underlying constituents.
Quantitative and Algorithmic Trading in Major Global Markets
United States
The U.S. is the global hub of algorithmic trading, accounting for the majority of automated volume. Major exchanges like NASDAQ and NYSE provide low-latency access, and firms such as Citadel Securities, Renaissance Technologies, and Jane Street dominate market making and quant strategies.
Europe
European markets, regulated under MiFID II, emphasize transparency and fairness in algorithmic trading. London remains a major center for hedge funds and algorithmic firms.
Asia-Pacific
Algorithmic trading is rapidly expanding in markets like Japan, Singapore, Hong Kong, and India. In India, the National Stock Exchange (NSE) supports co-location and direct market access, making it one of the fastest-growing algorithmic ecosystems.
Emerging Markets
Countries such as Brazil, South Africa, and the Middle East are adopting algorithmic platforms, although liquidity and infrastructure remain developmental challenges.
Benefits of Quantitative and Algorithmic Trading
Speed and Efficiency
Algorithms execute orders within microseconds, allowing traders to capture fleeting market opportunities impossible for humans to detect manually.
Reduced Human Bias
Trading decisions are based on predefined logic rather than emotion, minimizing psychological biases such as fear and greed.
Lower Transaction Costs
Smart order routing and optimal execution algorithms reduce slippage and market impact, enhancing profitability.
Liquidity Enhancement
Market-making algorithms continuously provide buy and sell orders, improving liquidity and narrowing bid-ask spreads.
Scalability
A single algorithm can manage thousands of securities across global markets simultaneously, offering unmatched scalability.
Backtesting and Optimization
Quantitative systems can be tested extensively on historical data, refining strategies before real-world application.
Risks and Challenges
Despite their advantages, quantitative and algorithmic trading come with significant risks:
Model Risk
Models are based on assumptions that may fail under changing market conditions. A small coding error or mis-specified model can cause massive losses.
Overfitting and Data Snooping
Over-optimization of models on historical data can produce unrealistic results that fail in live trading.
Liquidity and Flash Crashes
Excessive algorithmic activity can amplify volatility. The 2010 U.S. “Flash Crash” highlighted how algorithmic feedback loops could trigger rapid market collapses.
Regulatory Risk
Regulators globally are tightening oversight of algorithmic trading to prevent manipulation and ensure fairness. Compliance costs and monitoring requirements are rising.
Technology Failures
System outages, latency issues, or cyberattacks can disrupt trading and cause severe financial losses.
Competition and Market Saturation
As more participants adopt similar strategies, profit margins shrink, and edge becomes increasingly difficult to maintain.
Regulatory Framework and Global Standards
Regulators worldwide are implementing rules to govern algorithmic and high-frequency trading.
In the United States, the SEC and CFTC monitor automated trading for fairness, requiring disclosure of algorithms and pre-trade risk checks.
In Europe, MiFID II mandates firms to test algorithms, maintain kill-switch mechanisms, and provide detailed audit trails.
In India, SEBI regulates algorithmic trading by requiring pre-approval, audit certification, and real-time risk management systems.
These measures aim to balance innovation with market integrity and investor protection.
Technological Advancements Driving the Future
The next phase of quantitative and algorithmic trading will be shaped by technologies such as:
Artificial Intelligence and Deep Learning – Algorithms that learn autonomously from new data, improving accuracy over time.
Natural Language Processing (NLP) – Automated interpretation of news, tweets, and reports to derive trading signals.
Quantum Computing – Offering unprecedented processing power for portfolio optimization and complex simulations.
Blockchain Integration – Enhancing transparency, settlement efficiency, and security in algorithmic transactions.
Cloud Computing and Big Data – Allowing scalable data storage and computation across global markets in real time.
Impact on Global Market Dynamics
Quantitative and algorithmic trading have profoundly reshaped market structure. They have enhanced liquidity, tightened spreads, and accelerated price discovery. However, they also contribute to short-term volatility and market fragmentation across multiple venues.
Institutional investors now compete with sophisticated algorithms, while retail traders benefit indirectly through lower costs and better execution. Exchanges have evolved to accommodate high-speed connectivity, and data analytics has become a core asset for every financial institution. The global market, once driven by intuition and human judgment, is now governed largely by algorithms and machine intelligence.
Conclusion
Quantitative and algorithmic trading represent the pinnacle of financial innovation, combining mathematics, computation, and automation to redefine how markets operate. They have democratized access to efficient trading tools while challenging traditional notions of value, speed, and human decision-making.
Yet, with great power comes great responsibility — ensuring transparency, ethical deployment, and robust regulation will determine the sustainable future of algorithmic trading. As artificial intelligence and data science advance further, quantitative trading will continue to evolve, shaping global markets that are faster, smarter, and more interconnected than ever before.
Master Correlation Strategies in Financial MarketsIntroduction
In the dynamic world of financial trading and global markets, mastering correlation strategies is a cornerstone of risk management, portfolio diversification, and strategic profit-making. Correlation — the statistical relationship between two or more assets — reveals how price movements are interconnected. Understanding these relationships enables traders, investors, and portfolio managers to forecast market behavior, hedge risks, and enhance returns. In an era dominated by algorithmic trading, quantitative analysis, and global interdependence, mastering correlation strategies has become an indispensable skill for professionals in finance.
1. The Concept of Correlation in Financial Markets
Correlation measures the degree to which two securities move in relation to one another. It is expressed as a correlation coefficient ranging from -1 to +1:
+1 (Perfect Positive Correlation): The two assets move in the same direction. For example, the S&P 500 Index and a major U.S. technology ETF often exhibit a high positive correlation.
-1 (Perfect Negative Correlation): The two assets move in opposite directions. For instance, gold and the U.S. dollar often show a negative correlation.
0 (No Correlation): The movements of the two assets are unrelated.
By analyzing correlations, traders can understand how assets behave under varying market conditions — bullish, bearish, or volatile.
2. Importance of Correlation in Trading and Investment
Mastering correlation allows investors to build robust portfolios that can withstand market shocks. The importance of correlation can be summarized as follows:
Risk Management:
Correlation analysis helps identify how portfolio components interact. High correlations among holdings increase risk exposure, while low correlations enhance stability.
Diversification:
Diversification reduces unsystematic risk. By combining assets that are not highly correlated, investors minimize losses if one segment of the portfolio declines.
Hedging:
Traders can use negatively correlated assets as hedges. For example, when equity markets fall, investors may shift funds to bonds or gold.
Macro Market Analysis:
Correlation helps identify inter-market relationships — such as between currencies, commodities, and equities — offering insights into global economic trends.
Algorithmic Strategy Development:
Quantitative traders use correlation matrices to design algorithmic models that exploit patterns and mean-reversion opportunities between correlated assets.
3. Types of Correlation in Financial Markets
There are multiple forms of correlation that traders must understand:
Static Correlation:
The traditional correlation coefficient that remains constant over a fixed time period.
Dynamic or Rolling Correlation:
Correlations are not stable; they change over time due to macroeconomic events, liquidity shifts, and investor sentiment. Rolling correlation examines relationships across moving time windows (e.g., 30-day or 90-day).
Cross-Asset Correlation:
Measures how different asset classes — such as equities, bonds, and commodities — interact. For example, bond yields often have an inverse correlation with stock prices.
Intermarket Correlation:
Tracks relationships across international markets. For example, the performance of the U.S. dollar influences emerging market equities and commodities.
Sectoral Correlation:
Within equities, correlations can vary by sector. Technology and consumer discretionary sectors may rise together during economic booms but diverge in recessions.
Lagged Correlation:
Sometimes one asset’s price movement precedes another. For instance, movements in crude oil prices often precede those in airline stocks due to cost impacts.
4. Building Correlation-Based Strategies
Mastering correlation requires applying the concept in strategic, data-driven ways. Below are several powerful correlation-based trading and investment approaches.
A. Pair Trading (Statistical Arbitrage)
Pair trading is one of the most common correlation strategies. It involves identifying two historically correlated assets. When their correlation temporarily diverges — one asset becomes undervalued while the other is overvalued — traders short the outperforming asset and go long on the underperforming one, betting that prices will converge again.
Example:
Suppose Coca-Cola (KO) and PepsiCo (PEP) typically move together.
If KO rises 5% while PEP remains flat, traders might buy PEP and short KO, expecting their prices to realign.
This strategy is market-neutral, meaning profits can be generated regardless of market direction, as long as the correlation reverts.
B. Cross-Asset Hedging
Traders often hedge exposure by using correlated assets. For instance:
A trader long on the NASDAQ 100 might short S&P 500 futures to offset systemic risk.
Commodity traders hedge oil exposure through correlated instruments like energy-sector ETFs or refining stocks.
This technique reduces portfolio volatility by offsetting correlated risks.
C. Intermarket Analysis
Correlation helps traders interpret how different markets influence each other. Examples:
A strengthening U.S. dollar often leads to falling commodity prices.
Rising Treasury yields may indicate future stock market corrections.
Increasing oil prices can signal inflationary pressures affecting currency values.
By monitoring these correlations, traders anticipate market moves before they occur.
D. Portfolio Diversification Optimization
Portfolio managers use correlation matrices to identify assets that provide maximum diversification benefits.
For instance, combining U.S. equities with gold, real estate, and bonds reduces overall portfolio variance because these assets have historically low or negative correlations with one another.
E. Volatility and Correlation Trading
In derivative markets, correlation strategies are applied using correlation swaps or dispersion trades:
A correlation swap allows traders to speculate directly on the average correlation between assets in an index.
Dispersion trading involves buying options on individual stocks while selling options on an index, profiting from the difference between implied and realized correlation.
These advanced techniques are primarily used by institutional traders and hedge funds.
5. Tools and Methods to Measure Correlation
Mastering correlation requires analytical tools and quantitative methods:
Correlation Coefficient (Pearson’s r):
A standard measure ranging from -1 to +1, used to identify the strength and direction of a linear relationship.
Spearman Rank Correlation:
Measures monotonic relationships (useful when data is not normally distributed).
Rolling Correlation Analysis:
Using statistical software or trading platforms, traders compute rolling correlations to observe how relationships evolve.
Heatmaps and Correlation Matrices:
Visual tools that show correlations between multiple assets simultaneously, allowing easy identification of diversification opportunities.
Regression Analysis:
Used to model dependencies and predict how one asset’s returns affect another’s.
Machine Learning Techniques:
Advanced models like Principal Component Analysis (PCA) or clustering algorithms help detect non-linear correlations across large datasets.
6. Challenges in Applying Correlation Strategies
While correlation is a powerful concept, it is not without limitations:
Correlation is Not Causation:
A high correlation doesn’t necessarily imply one asset influences another. Spurious correlations may lead to false signals.
Dynamic Market Behavior:
Correlations fluctuate due to macroeconomic shifts, policy changes, or crises. For example, during global recessions, correlations across assets tend to rise sharply, reducing diversification benefits.
Tail Risk and Black Swan Events:
Extreme market events often break historical correlations. During the 2008 financial crisis, previously uncorrelated assets suddenly moved together.
Overfitting in Quant Models:
Excessive reliance on historical data can lead to models that fail under real-world conditions.
Liquidity and Execution Risks:
In pair or correlation trades, slippage and liquidity constraints can erode profitability.
7. Correlation Dynamics in Different Market Environments
Understanding how correlations evolve under various conditions is key to mastering this strategy.
Bull Markets:
Equity correlations tend to decrease as investors pursue diverse risk assets.
Diversification benefits are more visible, and pair trading strategies perform well.
Bear Markets:
Correlations across asset classes often increase as investors move to safe havens.
Portfolio diversification becomes less effective, and hedging becomes essential.
Volatile or Uncertain Markets:
Dynamic correlation tracking helps traders detect sudden changes in market relationships.
Correlation-based hedging and volatility arbitrage strategies become valuable.
8. Role of Correlation in Algorithmic and Quantitative Trading
Quantitative funds and algorithmic trading systems rely heavily on correlation analysis:
High-Frequency Trading (HFT): Algorithms detect microsecond-level correlation changes to exploit arbitrage opportunities.
Machine Learning Models: Predictive models use multi-asset correlation patterns to forecast market direction.
Portfolio Optimization Algorithms: Quant funds use correlation matrices to rebalance holdings dynamically.
Correlation Arbitrage: Institutional players identify mispriced assets using multi-dimensional correlation structures.
9. Case Studies: Correlation in Action
A. Gold and U.S. Dollar
Historically, gold and the U.S. dollar exhibit strong inverse correlation. When the dollar weakens due to inflation or monetary easing, gold tends to rise as investors seek protection against currency devaluation.
B. Crude Oil and Equity Markets
Oil prices often move in tandem with equity markets in growth periods but diverge during inflationary shocks or geopolitical disruptions.
C. Bitcoin and Tech Stocks
Recent data show Bitcoin increasingly correlated with technology equities, reflecting its risk-on asset behavior in global liquidity cycles.
10. The Future of Correlation Strategies
The future of correlation strategies is shaped by technology, globalization, and behavioral finance.
Machine learning, big data analytics, and artificial intelligence are enabling real-time correlation tracking across vast datasets, enhancing predictive power. Cross-asset and inter-market relationships are becoming increasingly complex due to algorithmic participation and geopolitical dynamics.
Moreover, deglobalization trends, supply chain shifts, and digital assets are creating new correlation structures that traders must monitor closely. As financial systems evolve, mastering dynamic, adaptive correlation strategies will remain a decisive advantage.
Conclusion
Mastering correlation strategies is not merely a technical skill; it is a comprehensive approach to understanding market interconnectivity, risk, and opportunity. By studying how assets move in relation to one another, traders and investors can craft resilient portfolios, design profitable arbitrage models, and navigate volatility with confidence.
In essence, correlation is the language of relationships within global finance. The true mastery lies in not only recognizing those relationships but also anticipating when they will shift — turning statistical insight into strategic foresight.
Exchange Rate Strategies in the Global Trading MarketIntroduction
Exchange rates—the prices of one country’s currency in terms of another—are at the heart of the global trading system. They play a decisive role in determining international competitiveness, investment flows, and macroeconomic stability. As globalization intensifies, managing exchange rates effectively has become a strategic priority for governments, central banks, and multinational corporations. The strategies adopted to manage exchange rates are known as exchange rate strategies or exchange rate regimes. These strategies influence trade balances, inflation, foreign investment, and the overall growth trajectory of nations. Understanding how these strategies operate and interact within the global trading market is essential to grasping modern international economics.
1. Understanding Exchange Rates
An exchange rate is the value of one currency relative to another. For example, if 1 U.S. dollar equals 83 Indian rupees, the exchange rate is 1 USD = ₹83. Exchange rates fluctuate constantly due to various factors such as interest rates, inflation, trade balances, capital flows, and market speculation.
There are two primary types of exchange rates:
Nominal Exchange Rate – the rate at which one currency can be exchanged for another.
Real Exchange Rate – adjusted for inflation differences between countries, reflecting the true purchasing power of currencies.
Exchange rates affect all major areas of the global economy—from trade and tourism to investment and government policy. Hence, countries design exchange rate strategies to align currency values with economic goals.
2. Types of Exchange Rate Strategies
Exchange rate strategies can broadly be divided into three major regimes: fixed, floating, and hybrid (managed float) systems. Each comes with its own advantages, challenges, and implications for the global market.
A. Fixed Exchange Rate Strategy
A fixed exchange rate system—also called a pegged system—is one in which a country’s currency value is tied to another major currency (such as the U.S. dollar or euro) or to a basket of currencies. Under this strategy, the central bank commits to maintaining the exchange rate at a predetermined level.
Examples:
The Saudi Arabian riyal is pegged to the U.S. dollar.
The Hong Kong dollar has been pegged to the U.S. dollar since 1983.
Advantages:
Promotes stability and predictability in international trade.
Reduces exchange rate risk for exporters and importers.
Helps control inflation by linking the domestic currency to a stable foreign currency.
Disadvantages:
Limits a country’s monetary policy independence.
May lead to currency overvaluation or undervaluation, distorting trade balances.
Requires large foreign exchange reserves to maintain the peg.
A fixed exchange rate is often adopted by countries seeking to build investor confidence or stabilize a volatile economy.
B. Floating Exchange Rate Strategy
In a floating exchange rate system, the value of the currency is determined entirely by market forces—supply and demand in the foreign exchange (forex) market. Governments and central banks may intervene occasionally, but they do not set a specific target rate.
Examples:
The U.S. dollar, euro, British pound, and Japanese yen are floating currencies.
Advantages:
Provides monetary policy flexibility; central banks can adjust interest rates freely.
Automatically adjusts to economic shocks and trade imbalances.
Reduces the need for massive foreign reserves.
Disadvantages:
Creates volatility and uncertainty in exchange rates.
May lead to short-term speculation and rapid currency movements.
Can increase risks for exporters and importers.
Floating exchange rates are best suited for large, diversified, and financially mature economies that can absorb currency fluctuations.
C. Managed Float or Hybrid Exchange Rate Strategy
Most countries today follow a managed float or hybrid strategy, combining elements of both fixed and floating systems. Here, the exchange rate is primarily determined by the market, but the central bank intervenes occasionally to stabilize the currency or guide it toward a preferred level.
Examples:
India follows a managed float system where the Reserve Bank of India (RBI) intervenes to curb excessive volatility.
China manages the yuan’s value within a controlled band around a reference rate.
Advantages:
Offers a balance between stability and flexibility.
Enables selective intervention during volatility.
Protects against speculative attacks.
Disadvantages:
May lead to uncertainty if market participants do not understand the central bank’s policies.
Requires effective management and transparent communication to build credibility.
3. Determinants of Exchange Rate Movements
Exchange rates are influenced by a combination of economic fundamentals and market psychology. The major determinants include:
Interest Rate Differentials – Higher interest rates attract foreign capital, strengthening the currency.
Inflation Rates – Low inflation boosts currency value; high inflation weakens it.
Trade Balances – Countries with trade surpluses usually have stronger currencies.
Political Stability – Stable governments attract foreign investment, enhancing currency strength.
Market Expectations – Traders’ perceptions about future policies and performance drive short-term fluctuations.
Speculation and Capital Flows – Large capital inflows or outflows can cause sharp currency movements.
Understanding these determinants helps policymakers and businesses craft appropriate exchange rate strategies.
4. Role of Central Banks and Monetary Authorities
Central banks are the key architects and executors of exchange rate strategies. Their responsibilities include:
Intervention in Forex Markets: Buying or selling foreign currency to influence the domestic currency’s value.
Setting Interest Rates: Adjusting rates to attract or repel foreign investment.
Maintaining Foreign Reserves: Ensuring adequate reserves for interventions.
Communicating Policy Stance: Providing guidance to stabilize market expectations.
For instance, the U.S. Federal Reserve, European Central Bank (ECB), and Bank of Japan manage their exchange rate impacts indirectly through monetary policy, while emerging markets like India or Brazil often intervene directly.
5. Exchange Rate Strategies and Global Trade
Exchange rate policies profoundly affect global trade patterns:
Export Competitiveness: A weaker currency makes exports cheaper and more competitive, stimulating demand.
Import Costs: A stronger currency reduces import prices, benefiting consumers and lowering inflation.
Trade Balances: Persistent misalignments can lead to deficits or surpluses.
Foreign Investment: Stable and predictable exchange rate systems attract long-term foreign direct investment (FDI).
For example, China’s managed currency policy during its early growth phase kept exports competitively priced, driving its manufacturing boom. Conversely, countries with overvalued currencies often experience declining exports and rising imports, widening trade deficits.
6. Exchange Rate Strategies and Economic Stability
The exchange rate regime influences not just trade, but also economic stability:
Fixed regimes provide stability but may collapse under speculative pressure if reserves are inadequate.
Floating regimes absorb shocks automatically but can amplify volatility.
Hybrid regimes offer flexibility but require strong institutional capacity to manage interventions.
During the Asian Financial Crisis (1997), several economies with semi-fixed systems (like Thailand and Indonesia) faced collapse after speculative attacks, illustrating the risks of maintaining unsustainable pegs. Conversely, countries with flexible systems (like Australia) weathered the crisis better.
7. Exchange Rate Strategies and Global Capital Flows
Global investors constantly evaluate currency risks when making cross-border investments. Exchange rate strategies therefore influence capital flows:
Fixed systems often attract short-term speculative flows, seeking stability.
Floating systems attract long-term investments, offering transparency.
Managed systems strike a balance but must maintain credibility to prevent capital flight.
For instance, when the U.S. Federal Reserve raises interest rates, capital flows out of emerging markets, causing currency depreciation and policy challenges. Managing such spillovers requires coherent exchange rate and monetary coordination.
8. Exchange Rate Strategies and International Cooperation
In today’s interconnected world, exchange rate strategies are not purely domestic choices. They affect trading partners and global markets, necessitating international cooperation through institutions like the International Monetary Fund (IMF), World Bank, and World Trade Organization (WTO).
The IMF monitors global currency movements, advises on sustainable policies, and provides financial assistance during crises. The G20 also coordinates policies to prevent “currency wars,” where nations competitively devalue currencies to boost exports.
9. Challenges in Modern Exchange Rate Management
Despite technological advances and policy coordination, several challenges persist:
Globalization of Finance: Rapid capital flows make exchange rates volatile.
Speculative Attacks: Investors can quickly move billions, pressuring currencies.
Geopolitical Uncertainty: Wars, sanctions, and political events cause abrupt shifts.
Digital Currencies: The rise of cryptocurrencies and central bank digital currencies (CBDCs) complicates traditional currency management.
Balancing Growth and Stability: Policymakers often face trade-offs between stimulating growth and maintaining currency stability.
10. Future of Exchange Rate Strategies
The future of exchange rate management will be shaped by technological, geopolitical, and environmental changes:
Digital Transformation: Blockchain-based payment systems and CBDCs may reduce dependency on the U.S. dollar and alter traditional exchange mechanisms.
Regional Currency Integration: Efforts like the Eurozone or proposed Asian Currency Unit may promote regional stability.
Sustainable Finance: As economies transition to green energy, exchange rate policies will adapt to new trade dynamics.
Data-Driven Policy: Artificial intelligence and real-time analytics will enhance central banks’ ability to predict and manage currency movements.
Overall, the future points toward greater flexibility, digital integration, and international cooperation.
Conclusion
Exchange rate strategies form the backbone of the global trading market. Whether fixed, floating, or managed, these strategies determine how nations engage in trade, manage capital flows, and maintain economic stability. Each approach carries distinct trade-offs—between stability and flexibility, autonomy and discipline. In a world increasingly connected by finance and technology, the effectiveness of an exchange rate strategy depends not merely on policy design but on institutional credibility, international coordination, and adaptive management. As global trade evolves, so too must the strategies that govern the value of money itself—ensuring that currencies continue to facilitate, rather than hinder, the smooth functioning of the global economy.
700% XRP Trade — The Exact Strategy I UsedThe XRP Trade That Made 700% — Full ICT Breakdown!
In this video, I break down my 700% XRP trade that I called out on the channel — exactly how I entered, why I entered, and how I managed the position.
I also explain why you don’t need to overcomplicate trading by drilling down to the 15-minute or 5-minute charts — sometimes, the cleanest ICT setups are right on the higher timeframes.
If you’ve been struggling to find consistency, this video will show you how powerful HTF liquidity plays can be when combined with patience and clear structure.
📈 Covered in the video:
Full breakdown of my XRP 700% trade
The exact HTF setup I used
How I manage risk and secure profits
Why ICT trading doesn’t need to be complicated

Global Market Crises, Emerging Market, and Systemic InvisibilityIntroduction
The global financial landscape is an intricate web of interdependence, where economies—both developed and emerging—are bound together through trade, capital flows, and investment channels. When a crisis erupts in one segment of this system, the ripple effects can destabilize the entire network. Global market crises, therefore, are not isolated events but collective shocks that reveal deep structural vulnerabilities in international finance. Emerging markets, which often serve as both beneficiaries and victims of globalization, find themselves particularly exposed to such turmoil. An underlying aspect of these crises is systemic invisibility—the inability to perceive, predict, or regulate risks that accumulate beneath the surface of financial and economic systems.
This essay explores the nature of global market crises, the role and vulnerability of emerging markets, and the concept of systemic invisibility that exacerbates instability. It discusses historical precedents, theoretical insights, and modern implications for a world driven by financial integration.
1. Understanding Global Market Crises
A global market crisis refers to a widespread and synchronized downturn in financial markets that transcends national boundaries. These crises typically involve severe declines in asset prices, widespread credit contractions, capital flight, and loss of investor confidence. The interconnectedness of global finance—through trade, investment, and technology—means that localized shocks can escalate into systemic failures.
Causes of Global Market Crises
Financial Deregulation and Excessive Leverage:
The liberalization of financial markets since the 1980s encouraged speculative investments and excessive risk-taking. When leverage ratios increase beyond sustainable levels, minor market corrections can lead to massive defaults.
Asset Bubbles and Speculative Behavior:
Asset bubbles—such as those seen in housing or stock markets—form when asset prices deviate significantly from their intrinsic value. The bursting of these bubbles often triggers market collapses, as witnessed during the 2008 Global Financial Crisis.
Monetary Policy and Liquidity Traps:
Loose monetary policies can flood markets with cheap credit, inflating bubbles in emerging economies. Conversely, abrupt tightening of monetary conditions, as seen during the U.S. Federal Reserve’s rate hikes, can lead to capital outflows from developing nations.
Technological and Algorithmic Amplification:
High-frequency trading, algorithmic systems, and digital currencies have introduced new layers of complexity. While enhancing efficiency, they also amplify volatility, making markets more prone to sudden crashes.
Geopolitical Risks and Global Shocks:
Conflicts, pandemics, and trade wars—such as the COVID-19 pandemic and Russia-Ukraine conflict—exert profound impacts on commodity markets, supply chains, and investor sentiment, triggering widespread economic disruptions.
2. The Role and Vulnerability of Emerging Markets
Emerging markets (EMs) are countries transitioning from developing to developed status, characterized by rapid industrialization, growing financial systems, and expanding middle classes. While they present attractive investment opportunities due to high growth potential, they are also more susceptible to global volatility.
Economic and Financial Linkages
Emerging markets are deeply integrated into the global economy through trade, foreign direct investment (FDI), and portfolio flows. They rely heavily on exports, often of commodities, and on foreign capital to finance infrastructure and industrial growth. This dependency makes them sensitive to global demand shifts and interest rate changes in advanced economies.
Types of Vulnerabilities
Currency Instability:
When global investors retreat from riskier assets, EM currencies often depreciate sharply, increasing the cost of foreign-denominated debt. The Asian Financial Crisis (1997–98) is a classic example, where speculative attacks on currencies led to economic collapses across Southeast Asia.
Debt Dependency:
Many emerging economies accumulate external debt to fund development projects. When global liquidity tightens, servicing this debt becomes difficult, leading to sovereign defaults—seen in countries like Argentina, Sri Lanka, and Zambia.
Commodity Dependence:
Export revenues in countries like Brazil, South Africa, and Indonesia are tied to commodity prices. Global crises that reduce demand or disrupt trade channels directly hit fiscal stability.
Capital Flight and Investor Panic:
In times of global uncertainty, investors withdraw funds from emerging markets and move to “safe havens” like U.S. Treasury bonds or gold. This sudden stop in capital inflows can paralyze domestic economies.
Weak Regulatory Frameworks:
Emerging markets often lack robust financial oversight and institutional capacity, making them more exposed to systemic risks and contagion effects.
3. Systemic Invisibility: The Hidden Dimension of Global Crises
“Systemic invisibility” refers to the hidden accumulation of risks and imbalances within the global financial system that remain unnoticed until they culminate in a crisis. It represents the gap between perceived stability and underlying fragility.
Dimensions of Systemic Invisibility
Hidden Leverage and Shadow Banking:
The rise of non-bank financial institutions (NBFIs), such as hedge funds, private equity, and shadow lenders, has created a vast web of credit intermediation outside traditional regulatory frameworks. Risks hidden in these opaque structures can destabilize markets without warning.
Data Blind Spots and Complexity:
The scale and complexity of global finance make it nearly impossible to capture real-time systemic exposures. Cross-border derivatives and off-balance-sheet transactions obscure the true level of financial risk.
Policy Illusion and Delayed Recognition:
Policymakers often fail to detect systemic risks due to political incentives, limited data transparency, or overreliance on outdated models. For example, before 2008, regulators believed that financial innovation had made markets more efficient and stable—until the crisis revealed the opposite.
Market Psychology and Herd Behavior:
Investor sentiment can create a collective illusion of stability. When confidence erodes, the same herd behavior amplifies panic, leading to cascading collapses.
Technological Obscurity:
The digitalization of finance through cryptocurrencies, decentralized finance (DeFi), and AI-driven trading has introduced new forms of invisibility. Risks embedded in decentralized systems can spread rapidly across borders without regulatory control.
Consequences of Systemic Invisibility
Systemic invisibility contributes to delayed crisis response, ineffective regulation, and disproportionate impacts on vulnerable economies. It erodes trust in financial institutions, amplifies inequality, and undermines global governance mechanisms. Most critically, it blinds both policymakers and investors to the real nature of interconnected risks.
4. Historical Lessons: Crisis Patterns and Emerging Markets
A historical overview demonstrates how global crises repeatedly expose systemic invisibility and emerging market vulnerabilities:
The Latin American Debt Crisis (1980s):
Fueled by cheap credit from Western banks, Latin American nations borrowed heavily in the 1970s. When U.S. interest rates rose, debt-servicing costs exploded, leading to widespread defaults. The crisis revealed the hidden fragility of debt-driven growth models.
The Asian Financial Crisis (1997–98):
Overleveraged banking systems, fixed exchange rates, and speculative capital inflows created a bubble of false stability. Once investor confidence evaporated, currencies and stock markets collapsed, illustrating how systemic invisibility masked risks until it was too late.
The Global Financial Crisis (2008):
The collapse of the U.S. subprime mortgage market exposed interconnected risks in global finance. Complex derivatives (like CDOs) spread hidden exposures worldwide. Emerging markets initially seemed insulated but soon faced capital reversals and export contractions.
The COVID-19 Pandemic (2020):
The pandemic triggered an unprecedented global market shock, highlighting how health crises can morph into financial ones. Liquidity freezes and capital flight hit emerging economies, while global supply chain dependencies revealed systemic blind spots.
5. Interconnectedness and Contagion Dynamics
In the modern financial ecosystem, crises spread through contagion—the transmission of shocks across markets and borders. Emerging markets, often at the periphery of global capital networks, become the first casualties when systemic stress arises.
Channels of Contagion
Financial Channel:
Global investors adjust portfolios simultaneously, leading to asset selloffs and currency depreciation in EMs.
Trade Channel:
A slowdown in global demand reduces exports, weakening current accounts and employment.
Confidence Channel:
Perceived risk in one region can lead to capital withdrawals elsewhere, regardless of fundamentals.
Policy Channel:
Central banks in emerging economies often follow global monetary trends. When the U.S. Federal Reserve raises rates, EMs face inflationary pressures and capital flight, limiting policy autonomy.
6. Addressing Systemic Invisibility and Strengthening Resilience
Building resilience against global market crises requires addressing the hidden vulnerabilities that perpetuate systemic invisibility. Key strategies include:
Enhanced Financial Transparency:
Global institutions like the IMF, World Bank, and Financial Stability Board (FSB) must strengthen surveillance of cross-border capital flows, derivatives, and shadow banking activities.
Macroprudential Regulation:
Countries should adopt countercyclical capital buffers, debt limits, and liquidity requirements to contain leverage buildup.
Diversified Economic Structures:
Emerging markets should diversify exports and reduce dependency on commodity cycles and external financing.
Digital Risk Oversight:
Regulators must develop frameworks to monitor fintech, crypto assets, and algorithmic trading systems that contribute to hidden risks.
Regional Safety Nets:
Mechanisms such as swap lines, contingent reserve arrangements, and regional development banks can provide liquidity support during crises.
Global Cooperation:
Crises are inherently transnational; therefore, coordination among central banks, international institutions, and governments is essential for pre-emptive action.
7. The Future of Emerging Markets in a Fragmented World
As the global economy becomes increasingly multipolar—with power shifting toward Asia, Africa, and Latin America—emerging markets will play a greater role in shaping financial stability. However, systemic invisibility will continue to pose risks, especially in a world characterized by digital finance, geopolitical fragmentation, and climate-related shocks.
The future will depend on how effectively emerging economies balance openness with resilience. The ability to identify and manage hidden systemic risks will determine whether globalization continues to be a driver of shared prosperity or a source of recurring crises.
Conclusion
Global market crises reveal the inherent fragility of an interconnected financial system. Emerging markets, though engines of growth, remain vulnerable to external shocks due to structural dependencies and limited regulatory capacity. The concept of systemic invisibility captures the unseen dimensions of modern finance—the risks buried beneath data opacity, technological complexity, and institutional inertia.
To prevent future crises, the world must embrace transparency, cooperation, and adaptive regulation. Only by making the invisible visible can policymakers, investors, and societies navigate the uncertainties of a globalized financial order. The stability of emerging markets—and indeed, the global economy—depends on illuminating the hidden forces that shape systemic risk.
How the Metals Market Works in the Global MarketIntroduction
Metals are among the most fundamental commodities driving global economic development. From steel used in infrastructure to copper in electronics and gold in finance, metals form the backbone of modern civilization. The global metals market is a vast and interconnected network that facilitates the extraction, processing, trading, and consumption of metallic resources. It is influenced by multiple forces—economic cycles, industrial demand, geopolitical dynamics, technology, and environmental regulations. Understanding how the metals market works is essential for policymakers, investors, manufacturers, and consumers alike, as metal prices often serve as barometers for economic health and industrial activity worldwide.
1. Classification of Metals in the Global Market
The global metals market is broadly divided into three main categories:
Precious Metals:
These include gold, silver, platinum, and palladium. They are rare, have high economic value, and are used as investment assets and in luxury goods. Gold is a global safe-haven asset, often rising during periods of market uncertainty.
Base Metals:
These include copper, aluminum, nickel, zinc, lead, and tin. They are essential for industrial use — particularly in construction, manufacturing, and energy sectors. Base metals are more abundant and less expensive than precious metals but are critical indicators of industrial health.
Ferrous Metals:
Iron and steel dominate this category. They are used heavily in construction, transportation, machinery, and manufacturing. The steel industry, in particular, is a key driver of economic development, especially in emerging markets.
2. Structure of the Global Metals Market
The metals market operates through a complex chain involving:
Mining and Extraction:
This is the first stage, where raw metal ores are extracted from the earth. Countries such as China, Australia, Brazil, Russia, and South Africa are among the largest producers of metal ores.
Refining and Processing:
The extracted ores are refined and processed into usable forms such as bars, ingots, or sheets. For example, bauxite is refined into alumina, which is then smelted into aluminum.
Distribution and Manufacturing:
The refined metals are sold to industries such as automotive, construction, electronics, aerospace, and renewable energy sectors.
Trading and Investment:
Metals are traded on global commodity exchanges such as the London Metal Exchange (LME), New York Mercantile Exchange (NYMEX), and Shanghai Futures Exchange (SHFE). Investors and producers use these markets for hedging, speculation, and price discovery.
Recycling and Circular Economy:
The metals market is increasingly focusing on recycling due to environmental concerns. Recycled metals significantly reduce production costs and carbon emissions compared to mining raw ores.
3. Major Global Metal Exchanges
The key platforms for global metal trading are:
London Metal Exchange (LME):
The world’s largest and most influential metal exchange, LME sets benchmark prices for base metals like copper, aluminum, nickel, zinc, lead, and tin. It operates through futures and options contracts, allowing participants to hedge against price volatility.
New York Mercantile Exchange (NYMEX):
A division of CME Group, NYMEX deals in precious metals such as gold and silver, as well as energy products. It is crucial for North American markets.
Shanghai Futures Exchange (SHFE):
China, being the largest consumer of metals, established SHFE to provide price discovery and risk management domestically. It trades metals like copper, aluminum, and zinc.
Tokyo Commodity Exchange (TOCOM):
It handles trading in gold, silver, platinum, and palladium, serving the Asian region’s financial and industrial sectors.
These exchanges not only facilitate physical delivery of metals but also serve as global pricing benchmarks, influencing spot and contract prices across the world.
4. Price Formation in the Metals Market
Metal prices are determined by the interplay of supply, demand, and speculative forces. Several key factors influence price movements:
Supply-Side Factors:
Mining output: Disruptions such as strikes, natural disasters, or political instability in mining countries can reduce supply.
Production costs: Energy prices, labor costs, and technology affect the cost of metal production.
Inventory levels: Stockpiles held by producers or governments can affect perceived scarcity.
Recycling rates: Increased recycling can reduce demand for newly mined metals.
Demand-Side Factors:
Industrial demand: Metals are crucial for construction, manufacturing, and technology sectors.
Economic growth: Expanding economies, particularly in developing countries, drive demand for metals.
Technological innovation: The rise of electric vehicles, renewable energy, and digital electronics has boosted demand for metals like lithium, nickel, and copper.
Financial and Speculative Factors:
Currency movements: Metals are typically priced in U.S. dollars. A weaker dollar makes metals cheaper for holders of other currencies, boosting demand.
Interest rates and inflation: Metals like gold serve as inflation hedges, attracting investment when inflation rises.
Market speculation: Hedge funds and institutional investors influence short-term price volatility through futures trading.
5. Key Players in the Metals Market
The global metals market involves a wide array of participants:
Mining Companies:
These include major global producers like BHP Group, Rio Tinto, Vale, Glencore, and Anglo American. They control significant portions of global supply and influence market dynamics.
Smelters and Refiners:
Companies like Norsk Hydro (aluminum), Jinchuan Group (nickel), and Aurubis (copper) process raw ores into refined metals.
Industrial Consumers:
Manufacturers in construction, automotive, aerospace, and electronics sectors form the demand side of the market.
Traders and Brokers:
Commodity trading houses like Trafigura, Glencore, and Vitol connect producers and consumers, managing logistics, hedging, and financing.
Investors and Speculators:
Institutional investors, hedge funds, and retail traders participate through futures, ETFs, and options, adding liquidity to the market.
Governments and Regulatory Bodies:
Governments influence the market through mining policies, export controls, tariffs, and environmental regulations. For example, China’s restrictions on rare earth exports have major implications for global industries.
6. Role of Metals in the Global Economy
Metals serve multiple economic roles beyond their industrial value:
Economic Indicator:
Prices of base metals like copper are often viewed as leading indicators of global economic health. When industrial demand rises, metal prices usually follow.
Store of Value:
Precious metals like gold act as safe-haven assets during financial instability, providing a hedge against inflation and currency depreciation.
Strategic Resources:
Metals like lithium, cobalt, and rare earth elements are essential for modern technologies, including electric vehicles, batteries, and renewable energy systems. This makes them strategic assets in global geopolitics.
Trade and Investment:
Metals contribute significantly to export revenues for resource-rich countries such as Australia, Chile, Peru, and Russia. They are also major inputs in global investment portfolios and commodity indexes.
7. Technological and Environmental Influences
The metals market is evolving under the influence of technology and environmental priorities:
Digital Transformation:
Digital trading platforms, algorithmic trading, and blockchain are improving transparency and efficiency in metal transactions.
Green Transition:
The global shift toward renewable energy and electric mobility is reshaping metal demand. Copper, lithium, nickel, and cobalt have become “green metals” due to their essential role in batteries, electric grids, and solar technologies.
Sustainability and ESG:
Investors are prioritizing environmental, social, and governance (ESG) criteria. Mining companies are under pressure to reduce carbon emissions, manage waste responsibly, and ensure ethical sourcing.
Recycling Revolution:
Secondary production, or recycling, now accounts for a growing share of global metal supply. For example, recycled aluminum uses 95% less energy than producing new metal from ore.
8. Challenges in the Global Metals Market
The metals market faces numerous challenges:
Price Volatility:
Rapid changes in demand, speculative trading, and geopolitical tensions lead to frequent price swings.
Geopolitical Risks:
Trade wars, sanctions, and export restrictions disrupt supply chains. For instance, Russia’s invasion of Ukraine affected global supplies of aluminum, nickel, and palladium.
Environmental Regulations:
Stricter emission norms and land-use policies increase production costs and reduce mining profitability.
Resource Nationalism:
Countries with rich mineral resources sometimes impose higher royalties or nationalize operations, affecting global supply stability.
Supply Chain Disruptions:
Events like the COVID-19 pandemic revealed vulnerabilities in global logistics and mining operations.
Technological Shifts:
While green technologies increase demand for some metals, they may reduce demand for others—for example, less steel may be needed in lightweight electric vehicles.
9. The Future of the Metals Market
The coming decades will see the metals market transform in response to industrial, environmental, and geopolitical shifts:
Decarbonization and Energy Transition:
Global climate goals will drive massive demand for metals used in renewable energy and electric vehicles. The International Energy Agency predicts that by 2040, demand for lithium could increase by over 400%, and for copper by 40%.
Technological Innovation:
Advances in mining automation, AI, and material science will enhance efficiency and reduce costs.
Regional Shifts:
Asia, particularly China and India, will continue to dominate consumption, while Africa may emerge as a new hub for mining investment.
Financialization:
Metals will continue to be attractive investment assets, integrated into ETFs, commodity funds, and central bank reserves.
Circular Economy:
Recycling and urban mining (recovering metals from electronic waste) will become key to ensuring resource sustainability.
Conclusion
The global metals market is a dynamic ecosystem that links natural resources with industrial growth, financial systems, and geopolitical power. It functions through complex interactions among miners, traders, consumers, and investors—each shaping prices, supply, and demand. As the world transitions toward cleaner energy, sustainable production, and digital economies, metals will remain indispensable. Understanding how this market operates not only provides insight into global trade mechanisms but also highlights the fundamental relationship between natural resources and the progress of human civilization.

Sovereign Debt Explained in the Global MarketIntroduction
Sovereign debt, also known as government debt or public debt, represents the money that a national government borrows to finance its expenditures and obligations. It is one of the most significant pillars of the global financial system, influencing everything from international trade and exchange rates to global market stability and development. Governments borrow to cover budget deficits, fund infrastructure, respond to crises, or stimulate economic growth. The management, structure, and sustainability of sovereign debt play a crucial role in determining a country's economic credibility and its integration into the global market.
In today’s interconnected world, sovereign debt is not an isolated national issue—it has far-reaching implications across borders. When a country defaults or faces a debt crisis, the ripple effects can be felt throughout the international financial system. Therefore, understanding sovereign debt in the context of the global market is essential to comprehend global economic dynamics, investor confidence, and long-term growth prospects.
1. Concept and Nature of Sovereign Debt
Sovereign debt is the total amount of money a government owes to external and internal creditors. It can take the form of bonds, loans, or other financial instruments issued by the government to domestic investors or foreign entities. Governments typically issue sovereign bonds—long-term or short-term securities that promise repayment of principal plus interest—to finance their fiscal needs.
There are two main categories of sovereign debt:
Domestic Debt:
Borrowed in the country’s own currency and often from local financial institutions or citizens. Domestic debt reduces exposure to foreign exchange risks but can crowd out private investment if excessive.
External Debt:
Borrowed from foreign creditors, including international organizations, foreign governments, and investors. It is often denominated in foreign currencies such as the U.S. dollar, euro, or yen. External debt exposes a country to exchange rate risks and global financial fluctuations.
Sovereign debt differs from corporate or personal debt because governments have unique powers—they can print money, tax citizens, and control monetary policy. However, these powers are not limitless, and excessive borrowing can lead to inflation, devaluation, or default.
2. Importance of Sovereign Debt in the Global Market
Sovereign debt plays several crucial roles in the global financial system:
Financing Government Expenditure:
Governments use debt to fund projects that stimulate economic growth—such as infrastructure, education, defense, and social welfare. This borrowing supports public services and long-term development.
Macroeconomic Stability and Fiscal Policy:
Borrowing helps smooth economic cycles. During recessions, governments may borrow more to stimulate demand and reduce unemployment. During booms, they may pay down debt to avoid overheating the economy.
Benchmark for Global Financial Markets:
Sovereign bonds, especially those issued by stable economies (like U.S. Treasury bonds), act as benchmarks for global interest rates. Investors worldwide use these as reference points to assess risk premiums on other assets.
Investment and Safe Haven Asset:
Many institutional investors, including central banks and pension funds, hold sovereign bonds as low-risk investments. U.S., Japanese, and German government bonds are considered “safe haven” assets during global uncertainty.
Indicator of Economic Health:
The level and sustainability of sovereign debt indicate a country’s fiscal health. A high debt-to-GDP ratio may raise concerns about solvency, while moderate debt can signal sound economic management.
3. Globalization and the Expansion of Sovereign Debt Markets
The globalization of finance has transformed sovereign debt markets dramatically. In the 20th and 21st centuries, capital mobility increased, allowing investors to buy foreign government bonds easily. Emerging markets also gained access to international borrowing, leading to a global expansion of sovereign debt.
Some key drivers of this trend include:
Financial Liberalization: Many developing countries opened their capital markets, allowing foreign investors to purchase local government bonds.
Technological Advancements: Digital trading platforms and global financial networks facilitated cross-border investment.
Global Savings Glut: High savings in developed nations, such as Japan and China, increased the demand for sovereign debt from other countries.
Monetary Policy in Advanced Economies: Low interest rates in developed countries pushed investors to seek higher yields in emerging markets, expanding their sovereign bond markets.
As a result, sovereign debt has become deeply intertwined with global capital flows. Investors in one country routinely hold the debt of others, linking their financial fortunes. This interdependence strengthens global economic cooperation but also amplifies systemic risks.
4. Determinants of Sovereign Debt Sustainability
The sustainability of sovereign debt depends on whether a government can service its obligations without resorting to excessive borrowing or risking default. Key determinants include:
Debt-to-GDP Ratio:
A widely used measure of a country’s debt burden. A high ratio may indicate financial strain, but the threshold varies across countries depending on growth rates and interest costs.
Interest Rate and Growth Differential:
If economic growth exceeds the interest rate on debt, the debt ratio tends to stabilize or decline over time. Conversely, if interest rates rise faster than growth, debt can become unsustainable.
Fiscal Balance:
Governments with persistent fiscal deficits (spending exceeding revenue) may accumulate unsustainable debt levels.
Exchange Rate Stability:
For countries with large external debt denominated in foreign currencies, exchange rate depreciation can inflate the debt burden.
Investor Confidence:
Global investors’ perception of a country’s economic management directly affects borrowing costs. Confidence can be influenced by political stability, monetary policy, and institutional credibility.
Debt Structure and Maturity Profile:
Short-term or variable-rate debt poses higher rollover and interest rate risks than long-term, fixed-rate debt.
5. Sovereign Debt Crises: Causes and Consequences
Sovereign debt crises occur when governments cannot meet their debt obligations, either through repayment or servicing interest. Such crises can arise due to poor fiscal management, external shocks, or global financial contagion.
Major Causes:
Excessive borrowing during boom periods followed by economic downturns.
Currency mismatches between debt and revenue.
Sudden stops in capital inflows or rising global interest rates.
Political instability and policy mismanagement.
Consequences:
Default and Restructuring: Governments may renegotiate terms with creditors or suspend payments temporarily.
Economic Recession: Austerity measures to reduce debt often suppress growth and increase unemployment.
Inflation and Currency Collapse: If debt is monetized (financed by printing money), it can lead to hyperinflation.
Loss of Credibility: A country’s access to international markets diminishes, raising borrowing costs for years.
Historical Examples:
Latin American Debt Crisis (1980s): Triggered by rising U.S. interest rates and oil price shocks.
Asian Financial Crisis (1997): Currency collapses led to debt defaults in several Asian economies.
Greek Debt Crisis (2010s): Excessive government spending and structural inefficiencies led to massive bailouts from the EU and IMF.
Argentina (multiple defaults): Chronic fiscal mismanagement and political instability have caused repeated sovereign defaults.
6. Role of International Institutions in Sovereign Debt Management
Institutions such as the International Monetary Fund (IMF), World Bank, and regional development banks play vital roles in managing sovereign debt crises and promoting fiscal stability.
IMF: Provides financial assistance and policy advice to countries facing balance-of-payments or debt crises. Its programs often come with fiscal and structural reform conditions.
World Bank: Focuses on long-term development financing and helps countries design sustainable debt management strategies.
Paris Club and London Club: Groups of official and private creditors that coordinate debt restructuring efforts for distressed sovereign borrowers.
Credit Rating Agencies (CRAs): Agencies like Moody’s, S&P, and Fitch assess sovereign creditworthiness, influencing borrowing costs in the global market.
These institutions aim to ensure that countries maintain fiscal discipline while providing relief during crises. However, critics argue that their policies sometimes prioritize creditor interests over social welfare, especially through austerity measures.
7. Sovereign Debt and Emerging Markets
Emerging markets have become significant participants in the global sovereign debt landscape. Countries like India, Brazil, Indonesia, and South Africa issue bonds in both domestic and international markets. While this enhances their access to capital, it also exposes them to global volatility.
Challenges Faced by Emerging Economies:
Currency risk due to foreign-denominated debt.
Limited investor confidence compared to developed nations.
Higher borrowing costs and vulnerability to global interest rate changes.
Political and policy uncertainties affecting credit ratings.
Despite these challenges, emerging market sovereign bonds attract global investors seeking higher yields, contributing to portfolio diversification.
8. The Future of Sovereign Debt in the Global Market
As the global economy evolves, the nature of sovereign debt is also transforming. Several trends are shaping its future:
Rising Global Debt Levels:
The COVID-19 pandemic and subsequent fiscal stimulus programs have driven global public debt to record highs, surpassing 100% of global GDP in many advanced economies.
Green and Sustainable Bonds:
Many governments now issue green bonds to finance environmentally sustainable projects. These instruments align debt issuance with climate goals and attract ESG-focused investors.
Digitalization and Transparency:
Blockchain technology and digital platforms are enhancing debt transparency, improving trust and efficiency in bond markets.
Geopolitical Shifts:
Rivalries among major economies, such as the U.S. and China, are influencing global debt markets through changes in capital flows and currency alignments.
Debt Relief and Restructuring Mechanisms:
Post-pandemic, international cooperation has increased to support low-income countries through debt relief initiatives like the G20 Common Framework.
Conclusion
Sovereign debt is both a tool of economic development and a potential source of financial instability. In the global market, it functions as a key instrument for investment, fiscal policy, and international cooperation. Properly managed, it enables nations to build infrastructure, stimulate growth, and enhance welfare. Mismanaged, it can trigger crises that ripple across the world economy.
The challenge for policymakers is to maintain a balance—borrowing enough to foster development while ensuring sustainability and market confidence. As the global financial landscape evolves, transparency, innovation, and prudent fiscal governance will determine how effectively sovereign debt continues to serve as a cornerstone of the global economy.

Global Trade ImbalanceIntroduction
Global trade imbalance refers to the persistent and significant differences between the value of goods and services a country exports and the value it imports. In simpler terms, when a nation consistently sells more to the world than it buys, it runs a trade surplus; when it buys more than it sells, it runs a trade deficit. These imbalances, while normal in the short term, can become problematic when they persist for long periods, leading to financial strain, currency distortions, and geopolitical tensions. The global economy thrives on trade interdependence, but when trade becomes unbalanced, it can trigger systemic vulnerabilities affecting growth, employment, and global financial stability.
The issue of global trade imbalance has been a central concern for economists and policymakers, especially since the late 20th century when globalization accelerated. Imbalances between major economies—such as the United States, China, Germany, and Japan—have influenced exchange rates, monetary policy, and even global political relationships. Understanding the roots, consequences, and possible solutions to global trade imbalance is essential for ensuring a more equitable and sustainable international economic system.
Concept of Global Trade Imbalance
Trade imbalance occurs when a nation’s imports and exports of goods and services are not equal. This is reflected in a country’s current account balance, a key component of the balance of payments.
A trade surplus means the country exports more than it imports, indicating that it earns foreign currency and increases reserves.
A trade deficit means the country imports more than it exports, leading to borrowing or depletion of reserves to pay for the difference.
In theory, trade imbalances are not inherently harmful. They can arise from differences in saving and investment behaviors, production capabilities, or consumption preferences. However, when these imbalances are large and persistent, they can lead to unsustainable debt levels or distortions in global demand and supply patterns. For example, if one country continually accumulates surpluses while another accumulates deficits, the result can be a dangerous buildup of global financial risk.
Historical Background
Trade imbalances have existed since the early days of international commerce. During the mercantilist period (16th–18th centuries), European powers sought to achieve trade surpluses to accumulate precious metals, which were viewed as the source of national wealth. This philosophy led to colonization, trade monopolies, and conflicts among nations.
In the post–World War II era, under the Bretton Woods system, global trade imbalances were moderated by fixed exchange rates and international coordination. However, after the collapse of Bretton Woods in the early 1970s, flexible exchange rates led to renewed volatility and imbalances.
The late 20th century witnessed the rise of the U.S. trade deficit and China’s trade surplus. As globalization deepened, manufacturing shifted to Asia, while consumption and financial markets concentrated in the United States and Europe. This created a pattern where developing countries became exporters of goods and savings, while developed nations became consumers and debtors.
Causes of Global Trade Imbalance
Global trade imbalances arise from a complex interaction of structural, economic, and policy factors. Some of the most important causes include:
1. Differences in Savings and Investment Rates
A fundamental driver of trade imbalance is the difference between national savings and investment. Economies that save more than they invest (like China and Germany) tend to run trade surpluses, while those that invest more than they save (like the United States) run trade deficits. The U.S., with its consumption-driven economy, borrows from global markets to finance its deficit, while surplus countries lend to it through foreign investments.
2. Exchange Rate Policies
Exchange rate manipulation or misalignment is another major factor. Some countries, particularly export-driven economies, maintain undervalued currencies to make their exports cheaper and imports more expensive, thereby ensuring persistent surpluses. For example, China was often accused of keeping the yuan artificially low during the 2000s to boost its exports.
3. Globalization and Production Shifts
The global redistribution of manufacturing due to globalization has widened trade gaps. As multinational corporations relocated production to low-cost countries, developing nations became export hubs, while advanced economies turned into consumption centers. This structural shift contributed to chronic trade surpluses in Asia and deficits in the West.
4. Oil Prices and Resource Dependence
Oil-exporting countries often run large surpluses when oil prices are high, while oil-importing nations face widening deficits. The cyclical nature of commodity prices thus influences the global trade balance and contributes to imbalances between resource-rich and resource-poor economies.
5. Fiscal and Monetary Policies
Expansionary fiscal policies, such as government spending and tax cuts, tend to increase domestic consumption and imports, thereby worsening the trade balance. Similarly, loose monetary policies that lower interest rates can weaken a country’s currency, stimulating exports but increasing inflationary pressure. In contrast, tight fiscal policies can generate surpluses by reducing domestic demand.
6. Structural Economic Differences
Countries at different stages of development naturally exhibit trade imbalances. Developing economies often import capital goods and technology for industrialization, leading to temporary deficits, while mature economies export high-value goods and services.
7. Protectionism and Trade Barriers
Tariffs, subsidies, and non-tariff barriers can distort the natural flow of trade. For instance, when a nation imposes tariffs on imports, it reduces demand for foreign goods, potentially leading to retaliatory measures and global imbalances.
Major Examples of Global Trade Imbalance
1. United States
The U.S. has run persistent trade deficits since the 1980s. Its economy depends heavily on imported consumer goods, energy, and technology, while the dollar’s reserve currency status allows it to finance deficits easily. The deficit peaked at over $900 billion in recent years, with China, Mexico, and the European Union being its largest trading partners. The U.S. deficit reflects both domestic overconsumption and global confidence in the dollar.
2. China
China’s rapid industrialization and export-led growth model have resulted in massive trade surpluses. From the early 2000s onward, China became the “factory of the world,” exporting manufactured goods globally. Although its surplus has moderated in recent years due to rising domestic demand, it remains a key contributor to global imbalance.
3. Germany and Eurozone
Germany’s strong industrial base and restrained domestic consumption have led to sustained surpluses. Within the Eurozone, southern economies like Greece, Italy, and Spain have faced chronic deficits, creating intra-European trade imbalances that contributed to the Eurozone debt crisis.
4. Oil Exporting Countries
Middle Eastern nations such as Saudi Arabia and the UAE often enjoy large trade surpluses during periods of high oil prices. However, when oil prices decline, these surpluses can rapidly turn into deficits, revealing the volatility of resource-dependent economies.
Consequences of Global Trade Imbalance
1. Financial Instability
Large and persistent trade imbalances can trigger global financial crises. For example, the 2008 Global Financial Crisis was partly fueled by excessive capital inflows from surplus countries to deficit economies, creating asset bubbles and unsustainable debt.
2. Currency Volatility
Trade imbalances exert pressure on exchange rates. Deficit countries often see their currencies depreciate, increasing import costs and inflation, while surplus nations face appreciation pressures, which may reduce export competitiveness.
3. Employment and Industrial Shifts
Trade deficits can lead to deindustrialization and job losses in manufacturing sectors, as witnessed in the U.S. and parts of Europe. Conversely, surplus countries experience industrial expansion but may suffer from domestic demand stagnation.
4. Geopolitical Tensions
Persistent trade imbalances can escalate into political conflicts. The U.S.-China trade war, initiated in 2018, was largely driven by America’s frustration with its widening deficit and perceived unfair trade practices by China.
5. Global Inequality
Trade imbalances often reflect and reinforce economic inequalities. Surplus nations accumulate wealth and foreign reserves, while deficit countries face debt accumulation and slower growth. This asymmetry undermines global economic stability and fairness.
Efforts to Correct Trade Imbalances
Addressing global trade imbalances requires coordinated international action and sound domestic policies. Several strategies have been attempted or proposed:
1. Exchange Rate Adjustments
Allowing currencies to adjust freely can help correct imbalances naturally. A stronger currency in surplus countries makes their exports more expensive and imports cheaper, reducing surpluses, while a weaker currency in deficit countries can boost exports.
2. Structural Reforms
Rebalancing domestic economies is crucial. Surplus nations like China and Germany need to boost domestic consumption and reduce dependence on exports, while deficit countries like the U.S. should promote savings and production.
3. Fiscal and Monetary Discipline
Responsible fiscal management can help reduce deficits. Limiting excessive government borrowing, encouraging investment in productive sectors, and maintaining moderate interest rates can support a healthier trade balance.
4. Trade Agreements and Cooperation
International organizations such as the World Trade Organization (WTO), IMF, and G20 play vital roles in promoting balanced trade. Through cooperation, they aim to reduce protectionism, ensure fair competition, and facilitate dispute resolution.
5. Promoting Innovation and Competitiveness
Enhancing technological capabilities, infrastructure, and human capital can help deficit countries produce higher-value goods and reduce reliance on imports.
The Future of Global Trade Imbalances
The global trade landscape is rapidly changing due to digitalization, automation, and shifting supply chains. The COVID-19 pandemic and geopolitical realignments have prompted many nations to rethink dependence on global trade. Decoupling trends between the U.S. and China, regional trade agreements, and nearshoring strategies may alter traditional imbalance patterns.
Moreover, green transitions and the shift toward renewable energy will reduce oil-related trade surpluses while creating new ones in critical minerals and clean technologies. As global financial systems evolve, addressing imbalances will require integrating sustainability, digital finance, and inclusive growth into trade policy.
Conclusion
Global trade imbalance remains one of the most pressing economic challenges of the 21st century. While some degree of imbalance is natural and reflects comparative advantage, persistent and extreme disparities can threaten economic stability, fuel political tensions, and distort global growth. Addressing these issues demands a coordinated international response focused on fairness, transparency, and sustainability.
A balanced global trade system not only promotes shared prosperity but also strengthens the resilience of the international economy against future crises. Ultimately, achieving equilibrium in global trade is not merely about balancing numbers—it is about building a more stable, equitable, and cooperative world economy.

Global Market Shifting: Changing Dynamics of the World EconomyIntroduction
The global market is not static—it is an ever-evolving ecosystem influenced by a combination of economic, technological, political, and environmental factors. Over the past few decades, globalization, digital transformation, trade liberalization, and geopolitical realignments have drastically reshaped how countries, corporations, and consumers interact. However, recent developments—ranging from supply chain disruptions to shifts in trade alliances—indicate that the global market is undergoing one of the most significant transformations in modern history.
The term “global market shifting” refers to these dynamic changes in global trade patterns, production structures, capital flows, and investment priorities. These shifts redefine global competitiveness, redistribute economic power, and create new winners and losers on the world stage. Understanding these trends is crucial for policymakers, investors, and businesses aiming to adapt to this new economic landscape.
1. The Evolution of the Global Market
The global market has gone through several distinct phases of transformation:
Post-World War II Era (1945–1970s):
This period was dominated by Western economies—particularly the United States—and characterized by industrial expansion, reconstruction in Europe and Japan, and the creation of global institutions like the International Monetary Fund (IMF), the World Bank, and the General Agreement on Tariffs and Trade (GATT), which later evolved into the World Trade Organization (WTO).
Globalization Era (1980s–2000s):
The fall of the Soviet Union, China’s economic opening, and the spread of neoliberal policies marked the rise of global capitalism. Supply chains became international, capital flowed freely, and developing nations began integrating into global markets.
Digital and Knowledge Economy Era (2000s–2010s):
The rise of the internet and digital technology transformed production and consumption patterns. E-commerce, automation, and data-driven decision-making became central to market growth.
Current Transformation Era (2020s–present):
The world is now experiencing a shift from globalization to “regionalization” and “strategic competition.” Global trade is being redefined by geopolitics, sustainability, and technological sovereignty.
2. Drivers of Global Market Shifts
The global market does not shift randomly. It evolves in response to powerful structural forces. The major drivers include:
a. Technological Disruption
Artificial intelligence, automation, blockchain, and advanced manufacturing are revolutionizing industries. These technologies are not just improving productivity—they are redefining competitive advantage.
AI and machine learning have automated decision-making in finance, logistics, and marketing.
Robotics and 3D printing are reshoring production back to developed economies, reducing dependence on low-cost labor markets.
Blockchain is enhancing transparency in supply chains and global trade settlements.
The result is a shift from labor-intensive globalization to technology-intensive globalization.
b. Geopolitical Realignments
Rising tensions between major powers—especially between the United States and China—are fragmenting global markets. Trade wars, sanctions, and the race for technological dominance have led to “decoupling” in critical sectors like semiconductors, energy, and telecommunications.
Countries are now diversifying supply chains to reduce dependency on single regions. For example, the “China+1” strategy encourages manufacturers to expand into India, Vietnam, and Indonesia.
c. Supply Chain Reconfiguration
The COVID-19 pandemic exposed vulnerabilities in global supply chains. Lockdowns, border closures, and shipping delays revealed the risks of overreliance on centralized manufacturing hubs.
Post-pandemic, many companies are moving towards “nearshoring” (bringing production closer to home) and “friend-shoring” (partnering with politically aligned countries). This marks a departure from the hyper-globalized supply chain model of the 1990s and 2000s.
d. Energy Transition and Climate Policy
The global push for green energy and decarbonization is reshaping investment priorities. Fossil fuel industries are declining, while renewable energy, electric vehicles, and carbon markets are expanding rapidly.
Countries rich in rare earth elements and critical minerals—such as lithium, cobalt, and nickel—are gaining new economic importance. This transition is not just about environmental policy; it represents a structural reorientation of global capital.
e. Shifting Consumer Demographics and Preferences
Emerging markets, particularly in Asia and Africa, are becoming major consumer bases. The global middle class is expected to exceed 5 billion people by 2030, most of whom will live in developing countries.
At the same time, consumers in advanced economies are prioritizing sustainability, digital convenience, and ethical production, forcing companies to adapt their strategies accordingly.
3. Regional Dynamics of the Shift
a. The Rise of Asia
Asia has become the epicenter of global economic growth.
China remains a manufacturing powerhouse but is now transitioning toward innovation-driven and service-oriented industries.
India is emerging as a global hub for digital services, clean energy, and manufacturing diversification.
Southeast Asia benefits from investment diversification, especially as companies move supply chains out of China.
Collectively, Asian economies are projected to contribute over 60% of global GDP growth by 2030.
b. North America’s Resurgence
The United States, Canada, and Mexico are revitalizing regional trade through agreements like the USMCA. The U.S. is also investing heavily in semiconductor manufacturing, renewable energy, and AI technologies to maintain its leadership.
Reshoring and nearshoring initiatives are restoring industrial capacity in North America, particularly in strategic sectors like defense, energy, and technology.
c. Europe’s Green and Digital Transition
Europe is leading the world in sustainable policy frameworks such as the European Green Deal and Carbon Border Adjustment Mechanism (CBAM). However, Europe faces challenges from energy dependence and slow economic growth.
To stay competitive, the EU is focusing on digital sovereignty, reducing reliance on U.S. and Chinese tech giants, and investing in green infrastructure.
d. Africa and Latin America: Emerging Frontiers
Africa and Latin America are gaining attention as new centers of growth. Africa’s population boom, natural resource wealth, and improving digital connectivity position it as a future manufacturing and consumer hub.
Latin America, with countries like Brazil and Chile leading in renewable energy and agriculture, is becoming vital in global sustainability chains.
4. The Role of Digitalization
Digitalization is at the core of market transformation.
E-commerce, fintech, digital currencies, and remote work have globalized economic participation in unprecedented ways. Platforms such as Amazon, Alibaba, and MercadoLibre have reshaped retail, while financial technology has expanded access to credit and payment systems.
Moreover, the data economy is now a key source of value creation. Nations are competing for control over data infrastructure, cybersecurity, and cloud computing. The emergence of digital currencies, including central bank digital currencies (CBDCs), may redefine how global payments and trade settlements operate.
5. Shifting Trade and Investment Patterns
Trade flows are no longer dominated by the same old players. Several trends are noteworthy:
Regional trade blocs are becoming stronger. For instance, the Regional Comprehensive Economic Partnership (RCEP) and the African Continental Free Trade Area (AfCFTA) are integrating regional economies.
South-South trade—commerce among developing countries—is expanding rapidly, reducing dependence on Western markets.
Foreign Direct Investment (FDI) is moving toward technology, renewable energy, and infrastructure sectors, away from traditional manufacturing.
Investors are also focusing on Environmental, Social, and Governance (ESG) factors, influencing how capital is allocated globally.
6. Challenges in the Global Market Shift
The transformation of the global market is not without challenges:
Economic Inequality:
The benefits of globalization have not been evenly distributed. Advanced economies have reaped most technological gains, while developing countries struggle with skill gaps and infrastructure deficits.
Protectionism and Trade Barriers:
Many countries are adopting protectionist measures to safeguard domestic industries, potentially fragmenting the global economy.
Technological Divide:
Access to digital infrastructure varies widely, especially between developed and developing countries, creating a new kind of inequality.
Geopolitical Risks:
Conflicts, sanctions, and trade wars can destabilize international cooperation, increasing uncertainty for businesses and investors.
Environmental Constraints:
As climate change accelerates, resource scarcity and extreme weather events may disrupt supply chains and threaten food and energy security.
7. Opportunities Emerging from the Shift
Despite the challenges, the global market shift presents vast opportunities:
Innovation in Technology:
AI, green tech, and biotechnology are creating entirely new industries and employment opportunities.
Regional Collaboration:
Regional trade blocs allow smaller economies to enhance their competitiveness and reduce vulnerability to global shocks.
Sustainable Finance:
Investments in renewable energy and ESG initiatives are expected to exceed trillions of dollars in the coming decade.
Digital Inclusion:
Expanding internet access in developing regions is creating new consumer markets and entrepreneurial opportunities.
8. The Future of the Global Market
Looking ahead, the global market will likely be defined by multipolarity—a system where no single country dominates. Instead, regional power centers like the U.S., China, the EU, India, and ASEAN will coexist, each with distinct economic models and technological strengths.
Trade will become more regional and digital, with sustainability and resilience as guiding principles. Automation and AI will continue to drive productivity, but governments will need to manage their social impacts through education and inclusive policies.
Furthermore, the green transition will become the new engine of growth. The competition for clean energy leadership—especially in hydrogen, solar, and electric vehicles—will shape the economic hierarchy of the 21st century.
Conclusion
The shifting global market marks the beginning of a new economic era—one defined by technological innovation, environmental consciousness, and geopolitical complexity. While globalization is not ending, it is being redefined. The new paradigm emphasizes resilience over efficiency, regional balance over concentration, and sustainability over short-term profit.
Adapting to these shifts requires foresight, flexibility, and collaboration among governments, businesses, and individuals. Those who understand and anticipate these global changes will not only survive but thrive in the evolving marketplace.
In essence, the global market shift is not merely a challenge—it is a transformative opportunity to rebuild a more inclusive, sustainable, and technologically advanced world economy.
Globalization and DeglobalizationIntroduction
Globalization has been one of the most defining forces of the modern era. It refers to the process by which businesses, cultures, technologies, and governments across the world become interconnected and interdependent. From the late 20th century onwards, globalization accelerated rapidly due to advances in communication, transportation, and digital technologies. This process transformed the global economy into an integrated system, allowing for free trade, capital flows, and cultural exchange on an unprecedented scale.
However, the 21st century has also witnessed the emergence of an opposite trend — deglobalization. This refers to the gradual slowing down, reversal, or reconfiguration of globalization. Rising nationalism, trade wars, pandemics like COVID-19, and geopolitical tensions have encouraged countries to reconsider global interdependence. Understanding both globalization and deglobalization is crucial to comprehend how today’s world economy and politics are evolving.
Concept of Globalization
Globalization can be defined as the increasing integration and interdependence of national economies and societies through the cross-border flow of goods, services, technology, capital, and information. It breaks down barriers between countries, fostering economic cooperation and cultural exchange.
The phenomenon of globalization is not new — it began centuries ago with trade routes such as the Silk Road, connecting Asia and Europe. However, the modern wave of globalization began in the late 20th century, following the end of World War II, the creation of international institutions like the IMF, World Bank, and WTO, and the liberalization of markets worldwide.
Drivers of Globalization
Technological Advancements
Innovations in communication (like the internet, smartphones, and social media) and transportation (such as air travel and container shipping) have dramatically reduced costs and time barriers, making the world more connected.
Trade Liberalization
Free trade agreements (FTAs), the reduction of tariffs, and the establishment of the World Trade Organization (WTO) have encouraged global trade, allowing goods and services to move freely across borders.
Foreign Direct Investment (FDI)
Multinational corporations (MNCs) have expanded operations across countries, investing in developing nations and creating global production chains.
Outsourcing and Offshoring
Companies increasingly locate production in countries with cheaper labor or better resources. For example, manufacturing moved to China and India became a hub for IT services.
Financial Integration
Capital markets have become interconnected, enabling investments and capital to move globally with ease.
Cultural Exchange
The spread of media, tourism, and migration has led to a blending of cultures, making the world more cosmopolitan.
Dimensions of Globalization
Globalization has multiple dimensions:
Economic Globalization – Integration of national economies through trade, investment, and capital flow.
Political Globalization – Growing influence of international organizations and global governance structures such as the UN, WTO, IMF, and World Bank.
Cultural Globalization – The spread of ideas, languages, and lifestyles, often leading to cultural homogenization.
Technological Globalization – Rapid global diffusion of technologies, especially in communication and automation.
Environmental Globalization – Global cooperation in addressing issues like climate change and sustainability.
Positive Impacts of Globalization
Economic Growth
Globalization has led to rapid growth in many developing countries. By opening markets, nations like China, India, and Vietnam have lifted millions out of poverty.
Access to Technology and Knowledge
It allows developing nations to access advanced technologies and global expertise.
Employment Opportunities
New industries and global supply chains create millions of jobs, especially in emerging markets.
Cultural Exchange and Diversity
Globalization promotes multiculturalism, allowing people to experience different cuisines, fashions, and entertainment.
Global Cooperation
It enhances international cooperation in tackling global issues like pandemics, climate change, and terrorism.
Negative Impacts of Globalization
Economic Inequality
While globalization increases wealth, it often benefits the rich more than the poor, widening the gap between developed and developing nations.
Exploitation of Labor and Resources
Multinational companies may exploit cheap labor in developing countries, leading to poor working conditions and environmental degradation.
Cultural Homogenization
Local cultures and traditions are overshadowed by Western consumer culture.
Job Losses in Developed Nations
Outsourcing and relocation of industries to low-cost regions lead to unemployment in advanced economies.
Environmental Challenges
Increased industrial activity and global transportation contribute to pollution and climate change.
The Emergence of Deglobalization
After decades of rapid integration, the world is now witnessing a phase of deglobalization. Deglobalization refers to the process of reducing interdependence and integration between nations. It does not mean the end of globalization but rather a reconfiguration or slowdown of global integration.
The early 21st century saw signs of this shift, with trade tensions, supply chain disruptions, and rising nationalism. Events like the 2008 global financial crisis, Brexit, the U.S.-China trade war, and the COVID-19 pandemic intensified the trend.
Causes of Deglobalization
Geopolitical Tensions
Rivalries between major powers like the United States and China have disrupted global trade and technology partnerships.
Economic Protectionism
Many countries are adopting protectionist measures to safeguard domestic industries, reversing decades of trade liberalization.
Pandemic Disruptions
COVID-19 exposed vulnerabilities in global supply chains, prompting companies to adopt “localization” or “nearshoring” strategies.
Technological Nationalism
Nations are increasingly prioritizing self-sufficiency in critical technologies like semiconductors, defense, and energy.
Environmental Concerns
Global supply chains are criticized for their carbon footprint, leading to policies encouraging local production.
Populist and Nationalist Movements
Political leaders in several countries emphasize nationalism, sovereignty, and “self-reliance,” often at the expense of global cooperation.
Characteristics of Deglobalization
Shift from global to regional supply chains.
Rising tariffs and trade barriers.
Greater emphasis on domestic manufacturing (e.g., “Make in India,” “America First,” “China’s Dual Circulation”).
Increased scrutiny of foreign investments for national security reasons.
Slower global trade growth compared to GDP growth.
Reassessment of global dependencies, especially in energy, food, and pharmaceuticals.
Impact of Deglobalization
Economic Impact
Deglobalization may slow global growth and reduce trade efficiency. However, it can strengthen domestic industries and reduce external vulnerabilities.
Supply Chain Restructuring
Companies are diversifying or relocating supply chains to minimize risks — a shift from “just-in-time” to “just-in-case” production models.
Shift in Investment Patterns
FDI flows are becoming more regional, and investment in strategic sectors is prioritized over global expansion.
Technological Decoupling
The U.S. and China are developing separate ecosystems in technology, telecommunications, and AI, creating a fragmented digital world.
Social and Political Impact
Rising nationalism can lead to social polarization, xenophobia, and less international cooperation.
Environmental Outcomes
While local production reduces transport emissions, duplication of industries globally may increase overall resource consumption.
Globalization vs. Deglobalization
Aspect Globalization Deglobalization
Economic Focus Free trade, open markets Protectionism, self-reliance
Supply Chain Global, interconnected Regional, localized
Cultural Impact Cultural exchange, hybridization Preservation of local culture
Political Approach Global cooperation National sovereignty
Growth Model Efficiency-driven Resilience-driven
Technology Flow Shared innovations Restricted technology access
Examples from Around the World
United States
The U.S. has shifted toward protectionism with policies like “America First” and reshoring manufacturing from China.
China
China’s “Dual Circulation Strategy” emphasizes domestic consumption while reducing reliance on exports.
European Union
The EU promotes “strategic autonomy,” aiming to be less dependent on external suppliers for energy and defense.
India
India’s “Atmanirbhar Bharat” (self-reliant India) initiative encourages local manufacturing and innovation while maintaining global engagement.
Global South
Many developing nations are balancing between globalization’s benefits and the need for self-sufficiency in food, energy, and technology.
Future of Globalization and Deglobalization
The world is unlikely to witness a complete end to globalization. Instead, the future will likely involve “selective globalization” — a hybrid model that balances global efficiency with local resilience.
Digital globalization will continue to grow through online services, data flows, and virtual collaboration.
Regional trade blocs (like RCEP, ASEAN, and EU) may replace full-scale global integration.
Nations will cooperate in areas like climate change, health, and technology, while competing in strategic sectors.
This evolving structure may lead to a multipolar world — with multiple centers of power and influence instead of a single dominant global order.
Conclusion
Globalization has been a transformative force shaping the modern world, driving economic growth, technological innovation, and cultural exchange. Yet, it has also produced inequalities, environmental stress, and geopolitical vulnerabilities. Deglobalization, in contrast, represents a corrective phase — a rethinking of excessive interdependence and a move toward resilience and regionalism.
The challenge for the future is to strike a balance between the efficiency of globalization and the security of deglobalization. The goal should not be to isolate nations but to build a sustainable, inclusive, and resilient global order that benefits all. In the decades to come, the world’s prosperity will depend not on retreating from globalization but on redefining it to serve humanity in a fairer, more balanced way.
Market Seasonality: Finding Statistical Edges in Price Patterns🟢 Overview
Market seasonality refers to recurring, quantifiable patterns in asset price movements that appear consistently across different time periods. Rather than mystical predictions, these patterns reflect systematic behavioral trends, institutional flows, and market structures that have persisted across years, and in some cases, centuries, of trading history.
🟢 How Seasonality Works
Seasonality analysis examines historical price data to identify months or periods when specific assets have historically shown strength or weakness. The approach replaces emotion-driven decision-making with probabilistic insights based on historical performance across complete market cycles, including bull markets, bear markets, and periods of consolidation. By quantifying these patterns, traders and investors can identify potential statistical edges in their execution timing.
🟢 Evidence Across Asset Classes
1. Bitcoin INDEX:BTCUSD
Since the development of futures markets and institutional participation, Bitcoin has demonstrated notable seasonal patterns with measurable statistical significance. September has averaged -1.92% returns, establishing it as the weakest month. In contrast, October has emerged as the strongest performer with average returns of +21.59% and a 90% positive occurrence. This level of consistency suggests a robust statistical edge rather than random variation.
Day-of-week patterns in modern Bitcoin are relatively tight, with differences ranging from 0.07% to 0.50%. Monday edges out as the optimal day for selling positions. However, these daily patterns offer considerably less statistical significance than the monthly seasonality effects, as the weekly variations have smoothed out compared to Bitcoin's earlier history.
2. Ethereum INDEX:ETHUSD
Ethereum displays even more pronounced seasonal variations with stronger directional bias. September has been particularly challenging, averaging -10.04% returns and showing negative performance in eight out of ten years, representing an 80% probability of decline. June also demonstrates weakness at -7.20% average returns. Conversely, May stands out as the strongest month with average returns of +34.97%, positive 70% of the time across the dataset. May has delivered positive returns in seven out of ten years, providing a statistically meaningful edge.
Day-of-week analysis reveals differences of 0.2% to 0.6%, with Wednesday edging out slightly for selling and Tuesday showing marginally better performance for buying. However, these daily variations lack statistical significance when compared to the dramatic monthly patterns, representing more noise than actionable alpha for systematic strategies.
3. S&P 500 SP:SPX
With over 50 years of data dating back to 1971, the S&P 500 demonstrates the famous "September Effect." September averages -0.90% returns and has been negative with notable consistency, establishing statistical significance through sheer sample size. November, capturing typical year-end institutional positioning, averages +1.73% with positive performance 70% of the time. April comes in second at +1.44% average returns. The persistence of these patterns across five decades provides robust evidence of systematic seasonal effects even in highly efficient markets.
Day-of-week effects in the S&P 500 are minimal, ranging from just 0.01% to 0.07%. Monday shows a slight negative drift at -0.01%, while Wednesday edges up 0.07%. These intraday variations fall well within normal variance and lack statistical significance for execution timing. For this index, monthly patterns provide the primary source of seasonal alpha.
4. Gold OANDA:XAUUSD
Perhaps most compelling is gold's seasonal data spanning nearly 200 years since 1832, offering an extraordinarily large sample size for statistical validation. January shows the strongest average returns at +0.99% and has been positive 80% of the time, representing a highly reliable statistical edge. June represents the weakest period at -0.18% average returns, with October also serving as a potential entry point at just 0.05% average returns. July comes in as the second-best month at +0.79%. The consistency of these patterns across multiple centuries, world events, and monetary system changes indicates deeply embedded structural inefficiencies in market dynamics.
Day-of-week patterns in gold are similarly minimal. Thursday edges out at 0.09% for optimal selling, while Sunday shows 0.01% for buying opportunities. Like the S&P 500, gold trades predominantly on monthly patterns rather than daily variations, with intraweek effects lacking statistical significance.
🟢 TL;DR
1. Bitcoin INDEX:BTCUSD : Accumulate during September weakness (-1.92%), sell into October strength (+21.59%). October has been positive 9 out of 10 years since 2015, representing a 90% positive occurrence. Day of week: Sunday dips for buying, Monday for selling.
2. Ethereum INDEX:ETHUSD : Summer pain is real. September (-10.04%) and June (-7.20%) are buying opportunities. May (+34.97%) is the monster month historically, positive 7 out of 10 years (70% positive frequency). Day of week: Tuesday buying, Wednesday selling, but minimal statistical significance.
3. S&P 500 SP:SPX : The September Effect demonstrates statistical significance (-0.90% average over 50+ years). November (+1.73%) captures the year-end rally with 70% positive occurrence. Day of week effects are negligible (0.01-0.07%) and lack statistical significance.
4. Gold OANDA:XAUUSD : January strength (+0.99%, 80% positive frequency) after June weakness (-0.18%). Nearly 200 years of data backing these patterns provides exceptional statistical validation. Day of week: Sunday buying, Thursday selling, but minimal differences.
🟢 Final thoughts
Ultimately, seasonality analysis does not guarantee future results, but it provides a framework for probabilistic decision-making with quantifiable statistical edges. Rather than attempting to time markets based on sentiment or short-term price movements, systematic traders and investors can align decisions with periods that have historically shown consistent strength or weakness with statistical significance. This approach is particularly valuable for planning entry and exit points, portfolio rebalancing, and managing position sizing within a rules-based framework.
Notably, while day-of-week patterns exist in some assets, monthly seasonality tends to provide more significant and statistically reliable edges across most markets. The data suggests that seasonal patterns persist even in highly efficient markets, driven by recurring institutional behaviors, tax considerations, and structural market dynamics that create exploitable inefficiencies.
Market seasonality should be viewed as one analytical tool within a comprehensive quantitative framework, not a guarantee of performance, but a method to incorporate historical probabilities and statistical edges into systematic investment decisions.
This isn't about perfect timing either. It's about leveraging statistical edges based on historical probabilities instead of emotion. You'll still be wrong sometimes, but less often when operating with decades of data and quantifiable patterns rather than sentiment alone.
👉 Try the Seasonality Heatmap indicator yourself on TradingView to explore these patterns across different assets and timeframes.
*This analysis is for educational purposes only and is not financial advice. Past performance does not guarantee future results. Always do your own research and consult with a qualified financial advisor before making investment decisions.
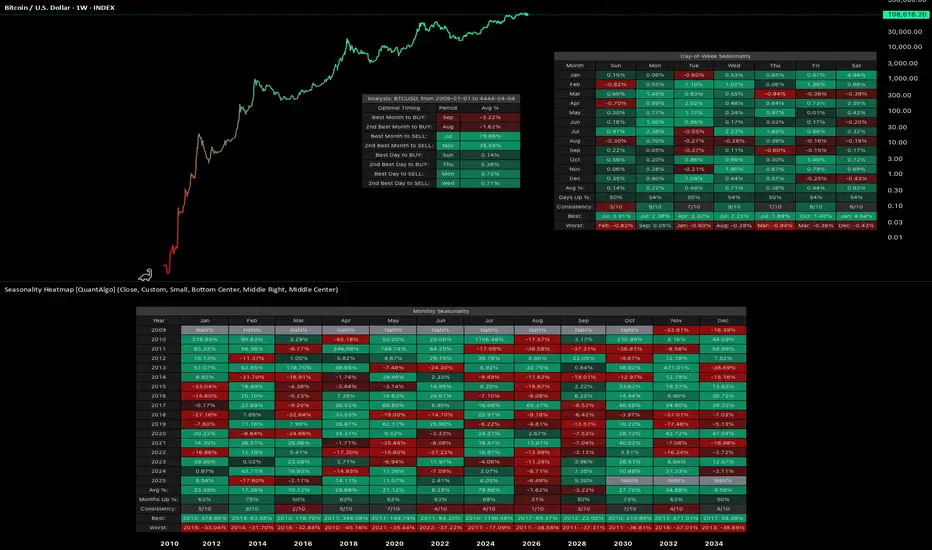
Hedge Fund Secrets: Unveiling the Hidden World of High-FinanceIntroduction
Hedge funds represent one of the most mysterious and influential corners of global finance. Often surrounded by secrecy and elite status, they attract both admiration and controversy. While mutual funds are accessible to the average investor, hedge funds are designed for the wealthy—institutions, corporations, and high-net-worth individuals—who seek aggressive growth and diversification. The “secrets” of hedge funds lie not only in their strategies but also in their flexibility, risk-taking ability, and sophisticated financial engineering.
This essay explores the structure, functioning, strategies, and inner workings of hedge funds—uncovering the tactics and philosophies that make them powerful engines in the financial markets.
1. What Is a Hedge Fund?
A hedge fund is a private investment partnership that pools money from investors and employs a range of strategies to earn high returns, often regardless of market direction. Unlike mutual funds, hedge funds are lightly regulated and have more freedom in how they invest. They can use leverage (borrowed money), short selling, derivatives, and alternative assets such as real estate, commodities, cryptocurrencies, or private equity.
The term “hedge” comes from the original goal—to “hedge” against market risk by taking offsetting positions. However, modern hedge funds have evolved into aggressive return-seeking vehicles, willing to take large, calculated risks for potentially outsized profits.
2. The Secret Structure: Limited Partnership Model
Most hedge funds operate under a limited partnership (LP) structure:
The general partner (GP) manages the fund, makes investment decisions, and assumes full liability.
The limited partners (LPs) are the investors who provide the capital but have limited liability.
This structure allows hedge fund managers to maintain flexibility and control while protecting investors from excessive risk exposure. The GP typically earns a management fee (2%) of total assets and a performance fee (20%) of profits—known as the “2 and 20 rule.” This incentivizes managers to maximize returns.
This performance-based compensation is one of the fund’s “secrets to motivation.” It aligns the manager’s goals with the investors’—both profit when performance is strong. However, it also encourages risk-taking, as the rewards can be massive.
3. The Secret Ingredient: Flexibility and Freedom
Unlike mutual funds or pension funds, hedge funds have minimal investment restrictions. This flexibility is their biggest advantage. Hedge funds can:
Short sell stocks (bet on price decline)
Use leverage to amplify returns
Trade derivatives like options, futures, and swaps
Invest globally across asset classes
Move in and out of positions rapidly
This freedom allows hedge funds to profit in bull or bear markets. For instance, during the 2008 financial crisis, some hedge funds—like John Paulson’s—made billions by betting against the U.S. housing market using credit default swaps.
4. Hedge Fund Strategies: The Real Secrets
Hedge funds are not a single strategy—they are a collection of sophisticated investment techniques. Some of the most powerful and “secretive” strategies include:
A. Long/Short Equity
The classic hedge fund strategy. Managers buy undervalued stocks (long) and short overvalued ones (short). The goal is to profit from relative performance rather than overall market direction.
Example: If a manager expects Apple to outperform Samsung, they go long Apple and short Samsung, profiting from the spread regardless of whether the tech sector rises or falls.
B. Global Macro
This strategy exploits global economic trends—interest rates, currencies, commodities, and geopolitical events. Legendary investor George Soros famously used this approach when he “broke the Bank of England” in 1992, betting against the British pound and earning over $1 billion.
C. Event-Driven
Event-driven funds profit from corporate events such as mergers, bankruptcies, or restructurings. Merger arbitrage is common: buying shares of a company being acquired and shorting the acquirer to profit from the deal’s price spread.
D. Quantitative (Quant) Strategies
Quant funds use advanced algorithms, machine learning, and statistical models to find patterns in massive data sets. These funds rely on technology and mathematics rather than human judgment.
Firms like Renaissance Technologies (founded by Jim Simons) have built mathematical models that consistently outperform markets—a true “black box” secret of modern finance.
E. Distressed Securities
These funds buy the debt of companies in financial trouble, betting that they will recover or that assets can be sold for more than their current market value. This strategy requires deep expertise in corporate law, restructuring, and valuation.
F. Multi-Strategy
Large funds diversify across multiple strategies to balance risk and return. These “all-weather” funds can adapt quickly to changing market conditions.
5. Leverage: The Power and the Danger
One of the most closely guarded secrets of hedge funds is how they use leverage to amplify returns. By borrowing money, a hedge fund can increase its exposure to profitable trades. For instance, a 10% return on a $1 billion position becomes 20% if the fund borrows another $1 billion.
However, leverage also magnifies losses. Many hedge fund collapses—like Long-Term Capital Management (LTCM) in 1998—occurred because excessive leverage turned small losses into disasters. The secret lies in risk management discipline: knowing when to cut losses and when to increase exposure.
6. Risk Management: The Hidden Backbone
While hedge funds are often portrayed as reckless gamblers, successful ones are masters of risk management. They use advanced models to monitor:
Value at Risk (VaR): the maximum expected loss over a given period.
Beta: sensitivity to market movements.
Drawdown limits: maximum allowed decline before positions are cut.
Some hedge funds employ dedicated risk teams independent of portfolio managers. The secret here is not just in taking risks—but in knowing which risks are worth taking.
7. Information Edge: The Secret Weapon
Information is the lifeblood of hedge funds. Successful managers invest heavily in data analytics, market intelligence, and proprietary research. The best funds have access to alternative data—credit card transactions, satellite imagery, social media trends, and supply chain data—that help them detect market trends before others.
In essence, hedge funds compete on information asymmetry. The faster and more accurately they interpret data, the greater their advantage.
However, this “edge” must stay within legal limits. In the past, some hedge funds were caught in insider trading scandals, revealing the fine line between legitimate research and illegal access to non-public information.
8. The Psychology of Hedge Fund Managers
Another hidden secret lies in the psychological resilience of hedge fund managers. The job involves high pressure, rapid decision-making, and emotional control. Successful managers often possess:
Contrarian thinking: Going against market consensus.
Risk tolerance: Comfort with uncertainty and volatility.
Discipline: Following the model or thesis even under stress.
Adaptability: Changing strategies when markets shift.
In many ways, hedge fund management is as much an art as a science—combining intellect, intuition, and emotional stability.
9. Technology: The New Frontier
Modern hedge funds are deeply intertwined with technology and artificial intelligence. High-frequency trading (HFT), machine learning algorithms, and predictive analytics now dominate the industry. Algorithms can execute trades in microseconds, identifying inefficiencies humans cannot detect.
The secret advantage of top-tier funds like Two Sigma or Citadel lies in their data infrastructure—massive computing power, real-time analytics, and AI-driven prediction models. These technological tools enable them to extract tiny profits millions of times per day.
10. Secrecy and Regulation
Hedge funds are notoriously secretive about their strategies. Their competitive advantage depends on keeping algorithms, models, and data confidential. Unlike mutual funds, they are not required to disclose holdings publicly. Investors receive quarterly or annual reports, but details remain hidden to protect intellectual property.
However, after major scandals and financial crises, regulators have increased oversight. The U.S. Securities and Exchange Commission (SEC) now requires large hedge funds to register and disclose basic information about risk and leverage. Yet, compared to other financial institutions, they still enjoy considerable privacy.
11. Hedge Funds and Market Influence
Though they represent a small portion of total global assets, hedge funds have an outsized impact on financial markets due to their leverage and trading volume. They can:
Move markets through large positions.
Provide liquidity during volatile times.
Expose overvalued or fraudulent companies (through short selling).
Hedge institutional portfolios against systemic risks.
However, their power can also destabilize markets if excessive leverage or herd behavior occurs—as seen during the 2008 crisis or the GameStop short squeeze of 2021.
12. The Dark Side: Failures and Risks
Not all hedge funds are successful. Many close within a few years due to poor performance, high fees, or changing market conditions. Common causes of failure include:
Over-leverage: excessive borrowing leading to collapse.
Overconfidence: ignoring market signals.
Lack of liquidity: inability to exit positions in time.
Misaligned incentives: managers chasing bonuses over long-term success.
The hedge fund secret to survival is adaptability—those that continuously evolve with technology, regulation, and global trends endure.
13. The Future of Hedge Funds
The hedge fund industry is changing rapidly. Artificial intelligence, blockchain, and decentralized finance (DeFi) are reshaping investment strategies. Investors are demanding lower fees and greater transparency, pushing funds to prove their value.
Sustainability is also becoming important. New hedge funds now explore ESG (Environmental, Social, Governance) strategies, blending profitability with ethical investing.
The next generation of hedge funds will likely combine AI-driven insights, quantitative analytics, and global macro intelligence—a fusion of technology and human expertise.
Conclusion
Hedge funds remain one of the most fascinating institutions in modern finance. Their “secrets” are not mystical tricks but a blend of flexibility, innovation, information, and discipline. They thrive on uncovering inefficiencies in the global financial system, exploiting them with speed, intelligence, and precision.
At their best, hedge funds bring liquidity, innovation, and market efficiency. At their worst, they amplify volatility and risk. The truth lies in their dual nature—both as engines of progress and mirrors of financial ambition.
In the end, the ultimate hedge fund secret is mastery over uncertainty—turning chaos into opportunity through knowledge, technology, and courage.

ESG Investing and Green FinanceIntroduction
In the 21st century, global finance has undergone a profound transformation. Investors, corporations, and governments are increasingly recognizing that economic growth must go hand in hand with environmental protection, social responsibility, and ethical governance. This shift has given rise to two major trends — ESG (Environmental, Social, and Governance) investing and Green Finance. Both concepts aim to align financial decision-making with sustainability goals, addressing global challenges such as climate change, inequality, and responsible corporate behavior. ESG investing and Green Finance are not just moral imperatives; they are strategic approaches that seek long-term value creation, risk management, and the transition to a low-carbon economy.
1. Understanding ESG Investing
ESG investing refers to an investment strategy that incorporates environmental, social, and governance factors into financial analysis and portfolio management. It goes beyond traditional financial metrics by assessing how companies manage sustainability-related risks and opportunities.
Environmental criteria evaluate how a company impacts the planet — through carbon emissions, waste management, water usage, renewable energy adoption, and biodiversity protection.
Social criteria examine how a company treats people — including employees, customers, suppliers, and local communities. It focuses on labor rights, diversity, equality, workplace safety, and human rights.
Governance criteria assess corporate ethics, transparency, board diversity, executive compensation, and shareholder rights.
In essence, ESG investing combines profitability with purpose, allowing investors to generate financial returns while contributing to positive social and environmental outcomes.
2. Evolution and Growth of ESG Investing
The origins of ESG investing can be traced back to socially responsible investing (SRI) movements of the 1960s and 1970s. Activist investors avoided industries such as tobacco, weapons, or apartheid-linked businesses. However, ESG investing evolved beyond exclusionary screening to focus on proactive investment in sustainable and responsible companies.
A significant milestone occurred in 2006, when the United Nations launched the Principles for Responsible Investment (UNPRI), encouraging institutional investors to integrate ESG principles into their investment decisions. Since then, ESG investing has grown exponentially.
By 2025, the global ESG assets under management (AUM) are projected to exceed $50 trillion, representing more than one-third of total global assets. Major asset managers like BlackRock, Vanguard, and Fidelity have incorporated ESG frameworks into their portfolios, while ESG-focused funds have outperformed traditional funds in many market cycles, particularly during crises such as the COVID-19 pandemic.
3. Key Components of ESG
(a) Environmental Factors
Environmental aspects are central to ESG investing. Investors assess a company’s carbon footprint, energy efficiency, waste disposal practices, and compliance with environmental laws. For instance, companies that transition toward renewable energy sources or adopt circular economy principles are considered environmentally sustainable.
Important sub-factors include:
Greenhouse gas (GHG) emissions and carbon neutrality goals
Renewable energy investment
Water conservation and pollution control
Sustainable supply chains
Biodiversity preservation
For example, Tesla and Ørsted attract ESG investors for their leadership in clean energy and low-carbon technologies.
(b) Social Factors
The social dimension emphasizes a company’s treatment of people and communities. This includes fair labor practices, human rights, product safety, customer privacy, and diversity initiatives. A company’s reputation and long-term success often depend on social responsibility and stakeholder trust.
Key areas include:
Employee welfare and workplace safety
Gender and racial diversity in leadership
Consumer protection and ethical marketing
Community development programs
Supply chain ethics
Firms like Unilever and Patagonia are known for integrating social responsibility into their corporate strategy, enhancing both brand loyalty and long-term profitability.
(c) Governance Factors
Governance ensures accountability, transparency, and ethical leadership. It involves assessing how decisions are made within an organization and whether management aligns with shareholders’ and stakeholders’ interests.
Governance evaluation considers:
Board composition and independence
Executive pay and accountability
Anti-corruption policies
Shareholder voting rights
Ethical corporate conduct
Poor governance can lead to scandals and losses, as seen in corporate collapses like Enron or Wirecard, where lack of oversight and transparency destroyed investor confidence.
4. ESG Investing Strategies
Investors use several methods to implement ESG principles:
Negative Screening: Excluding companies involved in harmful industries (e.g., fossil fuels, tobacco, or weapons).
Positive Screening: Selecting companies that perform better on ESG metrics than their peers.
Best-in-Class Approach: Investing in the most sustainable companies within each sector.
Thematic Investing: Focusing on specific sustainability themes such as renewable energy, clean water, or gender equality.
Impact Investing: Targeting measurable social and environmental outcomes alongside financial returns.
ESG Integration: Incorporating ESG data into traditional financial analysis to evaluate overall risk-adjusted returns.
These approaches allow investors to align their portfolios with their values and long-term sustainability goals.
5. Importance and Benefits of ESG Investing
ESG investing offers multiple advantages to investors, businesses, and society.
Risk Mitigation: Companies with strong ESG performance tend to manage risks better, reducing exposure to legal, environmental, and reputational crises.
Financial Performance: Numerous studies show a positive correlation between ESG integration and long-term financial returns. Sustainable firms are often more efficient, innovative, and resilient.
Investor Demand: Younger generations, especially Millennials and Gen Z, increasingly prefer ethical investments that align with their values.
Regulatory Support: Governments and regulators are promoting ESG disclosures, creating an environment where sustainability becomes a necessity rather than a choice.
Corporate Reputation: Strong ESG performance enhances brand image, attracting customers, investors, and top talent.
6. Understanding Green Finance
While ESG investing focuses on evaluating sustainability within investments, Green Finance refers to financial instruments and services that directly support environmentally beneficial projects. It aims to mobilize capital toward green initiatives that promote climate resilience, energy efficiency, and ecological sustainability.
Green Finance includes a wide range of products such as:
Green Bonds – bonds issued to finance renewable energy, clean transportation, and waste management projects.
Green Loans – loans with favorable terms for sustainable projects.
Green Mutual Funds and ETFs – investment funds focusing on companies or projects that meet environmental standards.
Carbon Markets and Credits – mechanisms that incentivize emissions reduction.
Sustainable Insurance and Banking – financial institutions offering eco-friendly products and services.
In essence, Green Finance channels money into projects that contribute to a low-carbon and sustainable future.
7. The Rise of Green Finance Globally
Green finance gained global recognition after the 2015 Paris Agreement, which called for aligning financial systems with climate goals. The agreement encouraged nations to mobilize trillions of dollars in climate finance to limit global warming to below 2°C.
Leading economies such as the European Union, China, and the United States have established green finance frameworks.
The EU Green Deal and EU Taxonomy for Sustainable Activities provide a clear classification system for green investments.
China’s Green Bond Endorsed Project Catalogue guides green bond issuance and has made China one of the largest green bond markets globally.
Multilateral institutions such as the World Bank and Asian Development Bank support developing nations in adopting green finance principles.
According to the Climate Bonds Initiative, global green bond issuance surpassed $600 billion in 2023, signaling the growing importance of sustainability-linked finance.
8. Relationship Between ESG Investing and Green Finance
While both concepts share sustainability as their foundation, they differ in scope and application.
ESG investing focuses on evaluating corporate behavior and integrating sustainability into investment decisions across all industries.
Green Finance specifically directs capital toward projects that have clear environmental benefits.
However, the two are interconnected. ESG investors often allocate capital to green financial instruments, while green finance initiatives rely on ESG metrics to ensure accountability and transparency. Together, they form the backbone of sustainable finance, promoting a more inclusive and climate-conscious global economy.
9. Challenges in ESG Investing and Green Finance
Despite their growth, both ESG investing and green finance face several challenges:
Lack of Standardization: Different countries and rating agencies use varied ESG criteria, leading to inconsistent assessments and “greenwashing.”
Greenwashing Risks: Some companies exaggerate their sustainability claims to attract investors without actual environmental commitment.
Data Availability: Reliable ESG data and performance metrics are limited, especially in developing markets.
Short-Term Investor Mindset: Many investors prioritize short-term gains over long-term sustainability impacts.
Regulatory Barriers: Inconsistent regulations across jurisdictions make it difficult to measure and compare ESG performance globally.
Transition Costs: Shifting to sustainable business models requires upfront investments that may deter smaller firms.
Addressing these challenges requires global cooperation, transparent reporting, and strong regulatory frameworks.
10. The Future of ESG and Green Finance
The future of finance is undeniably green and responsible. Governments, institutions, and individuals are realizing that sustainability is essential for economic resilience and planetary survival. Key future trends include:
Mandatory ESG Disclosure: Regulators in the EU, India, and the US are introducing compulsory ESG reporting standards for corporations.
Technology Integration: Artificial intelligence, blockchain, and big data analytics are improving ESG measurement and transparency.
Sustainable Development Goals (SDGs): ESG investing and green finance will play vital roles in achieving the United Nations’ 17 SDGs by 2030.
Green Central Banking: Central banks are increasingly integrating climate risks into monetary policies and lending frameworks.
Emerging Market Participation: Developing countries are adopting green finance to address energy transitions and attract foreign investment.
Ultimately, ESG and green finance are not temporary trends — they represent a long-term transformation of the global financial system.
Conclusion
ESG investing and Green Finance have redefined how the world views the relationship between money, ethics, and the environment. They demonstrate that profitability and sustainability can coexist, driving innovation, resilience, and inclusive growth. As climate change intensifies and social challenges persist, the role of finance as a catalyst for sustainable development has never been more crucial.
By integrating ESG principles and promoting green financial instruments, investors and policymakers can pave the way toward a more sustainable, equitable, and prosperous global economy. The future belongs to those who not only generate wealth but also protect the planet and uplift society — a vision where finance serves humanity, not just profits.

WTO, IMF, and World Bank: Their Role in Global TradingIntroduction
In the 21st century, global trade stands as one of the strongest pillars of economic growth, development, and interdependence among nations. The expansion of international trade has led to greater efficiency, technology transfer, and global prosperity. However, this complex network of trade relationships requires rules, institutions, and financial frameworks to ensure stability and fairness. Three major global institutions play vital roles in shaping, regulating, and supporting global trade — the World Trade Organization (WTO), the International Monetary Fund (IMF), and the World Bank. Together, these institutions form the backbone of the international economic system, influencing trade policies, providing financial assistance, and fostering global economic stability.
1. The World Trade Organization (WTO)
1.1 Background and Objectives
The World Trade Organization was established in 1995, succeeding the General Agreement on Tariffs and Trade (GATT), which had been in place since 1948. The primary objective of the WTO is to facilitate smooth and fair international trade by reducing trade barriers, resolving disputes, and ensuring compliance with trade agreements. It currently has 164 member countries, representing over 98% of world trade.
The WTO’s mission is to create a rules-based international trading system where goods and services can move freely across borders under agreed-upon regulations. Its guiding principles include non-discrimination, transparency, fair competition, and progressive liberalization.
1.2 Key Functions of the WTO
Trade Negotiations –
The WTO serves as a platform for member nations to negotiate trade agreements. Through rounds of negotiations, such as the Doha Development Round, the WTO works to reduce tariffs, subsidies, and other trade barriers. These negotiations aim to create a more inclusive trading environment, especially for developing countries.
Trade Dispute Settlement –
One of the WTO’s most important functions is to resolve trade disputes among member countries. The Dispute Settlement Body (DSB) ensures that trade conflicts are addressed fairly and according to international law. For instance, disputes between the United States and China or between the European Union and India are handled under the WTO’s structured dispute resolution mechanism.
Trade Policy Monitoring –
The WTO regularly monitors the trade policies of its member nations to ensure transparency and compliance with agreed rules. This surveillance helps prevent protectionist measures that could disrupt global trade.
Capacity Building and Technical Assistance –
The WTO provides technical assistance to developing and least-developed countries to help them understand and implement trade agreements. This support allows them to participate more effectively in global markets.
1.3 WTO’s Impact on Global Trade
The WTO has contributed to significant growth in international trade. Since its establishment, global trade volumes have more than quadrupled, promoting economic integration and reducing poverty in many countries. By reducing tariffs and promoting open markets, the WTO encourages specialization and comparative advantage, leading to efficient resource allocation.
However, the WTO has faced criticism. Many argue that it favors developed countries and multinational corporations, while developing nations struggle with complex regulations. The slow progress of trade negotiations and disputes over agricultural subsidies have also limited its effectiveness. Nevertheless, the WTO remains an indispensable platform for global economic cooperation.
2. The International Monetary Fund (IMF)
2.1 Background and Objectives
The International Monetary Fund (IMF) was established in 1944 during the Bretton Woods Conference, with the main goal of ensuring global monetary stability. Headquartered in Washington D.C., the IMF’s primary mandate is to promote international monetary cooperation, facilitate balanced growth of trade, and maintain exchange rate stability.
Trade and finance are deeply interconnected. Stable exchange rates and sound macroeconomic conditions are essential for smooth global trade. Therefore, the IMF’s role in maintaining financial stability directly supports global commerce.
2.2 Key Functions of the IMF
Surveillance and Policy Advice –
The IMF monitors the global economy and the economic performance of its member countries through regular assessments called Article IV consultations. This helps identify potential risks that could affect international trade, such as inflation, fiscal imbalances, or currency instability. The IMF provides policy advice to correct these imbalances and promote stable growth.
Financial Assistance –
The IMF provides loans to countries facing balance of payments crises—situations where they cannot meet their international payment obligations. By offering temporary financial support, the IMF helps nations stabilize their economies and avoid measures that might restrict trade, such as import bans or currency devaluations.
Capacity Development –
The IMF also assists member countries in building institutional and human capacity. Through training programs, it strengthens countries’ abilities to design and implement effective fiscal and monetary policies, which are crucial for stable trade relations.
2.3 IMF’s Role in Global Trade
The IMF contributes to global trade in several ways:
Maintaining Currency Stability: Stable exchange rates make international trade predictable and reduce transaction risks.
Preventing Financial Crises: By providing early warnings and financial aid, the IMF helps prevent crises that could disrupt trade flows.
Supporting Developing Economies: The IMF’s financial support allows developing countries to stabilize their economies and continue participating in global trade.
2.4 Criticism and Challenges
While the IMF plays a vital role in stabilizing global finance, it has been criticized for imposing strict austerity measures as conditions for its loans. These policies sometimes lead to reduced public spending and social unrest in borrowing countries. Critics also argue that the IMF’s decision-making structure favors developed nations, particularly the United States and Europe, due to their larger voting shares.
Despite these challenges, the IMF remains crucial for promoting monetary stability and supporting global trade resilience during financial crises, as seen during the 2008 Global Financial Crisis and the COVID-19 pandemic.
3. The World Bank
3.1 Background and Objectives
The World Bank, also established in 1944 at Bretton Woods, was created to assist in the reconstruction of war-torn Europe and promote long-term economic development. Over time, its focus shifted toward poverty reduction, infrastructure development, and sustainable economic growth, particularly in developing countries.
The World Bank consists of two main institutions:
The International Bank for Reconstruction and Development (IBRD)
The International Development Association (IDA)
Together, they provide loans, grants, and technical assistance to support development projects worldwide.
3.2 Functions of the World Bank in Global Trade
Infrastructure Development –
The World Bank funds projects such as ports, highways, railways, and energy systems that are critical for trade. Efficient infrastructure reduces transportation costs and enhances trade competitiveness.
Trade Facilitation and Policy Reform –
The World Bank assists countries in modernizing their trade policies, improving customs systems, and reducing non-tariff barriers. It also supports reforms that make it easier for businesses to export and import goods.
Capacity Building and Knowledge Sharing –
The World Bank provides technical expertise and training to help countries strengthen institutions, adopt digital trade systems, and integrate into global value chains.
Financing for Development Projects –
Through long-term, low-interest loans, the World Bank helps developing countries finance projects that enhance productivity, such as education, technology, and agriculture — all of which indirectly boost trade competitiveness.
3.3 World Bank’s Impact on Global Trade
The World Bank’s initiatives have enabled many developing economies to become more competitive in the global market. For instance, its investments in infrastructure across Asia and Africa have reduced trade costs and improved access to markets. Additionally, the World Bank promotes sustainable trade by supporting environmentally friendly and inclusive growth.
However, like the IMF, the World Bank has faced criticism. Some argue that its projects have led to environmental degradation or displacement of local communities. Others believe it often promotes a one-size-fits-all economic model influenced by Western ideologies. Despite these concerns, the World Bank remains an essential engine for trade-driven development.
4. Interconnection Between WTO, IMF, and World Bank
Although these three institutions have distinct mandates, they work interdependently to support the global trading system.
The WTO establishes the rules of international trade.
The IMF ensures monetary stability, providing the financial foundation for trade.
The World Bank finances development projects that enhance countries’ capacity to trade.
For instance, a developing country seeking to expand exports may rely on the World Bank for infrastructure funding, the IMF for macroeconomic stabilization, and the WTO for market access through fair trade rules.
In 1996, these institutions signed an agreement to enhance cooperation and information sharing, ensuring that their policies complement each other in promoting global growth.
5. Challenges and Future Outlook
The global trading landscape is rapidly evolving due to factors such as technological change, climate change, geopolitical tensions, and protectionism. Institutions like the WTO, IMF, and World Bank face growing pressure to adapt.
The WTO needs to reform its dispute settlement system and address new issues such as digital trade, e-commerce, and intellectual property.
The IMF must strengthen its support for low-income countries and incorporate climate-related risks into its financial assessments.
The World Bank should enhance its role in financing green infrastructure and ensuring that development benefits are equitably distributed.
In the future, stronger cooperation among these institutions will be crucial for addressing global inequalities and promoting sustainable trade.
Conclusion
The WTO, IMF, and World Bank together form the institutional framework that underpins the global trading system. The WTO establishes and enforces trade rules, ensuring fairness and predictability. The IMF provides financial stability by managing exchange rates and supporting economies during crises. The World Bank focuses on long-term development, financing the infrastructure and reforms necessary for countries to engage effectively in global trade.
While each institution faces criticism and operational challenges, their combined efforts have been instrumental in expanding international trade, fostering economic growth, and reducing poverty. As the world continues to navigate challenges such as digital transformation, climate change, and inequality, the coordinated efforts of these institutions will remain essential to maintaining a stable, fair, and prosperous global trading environment.
G7 and G20 in the World Market: A Comprehensive OverviewIntroduction
In the ever-evolving landscape of the global economy, two powerful international groups — the Group of Seven (G7) and the Group of Twenty (G20) — play a pivotal role in shaping global financial policies, trade frameworks, and market stability. These organizations consist of the world’s most influential economies, both advanced and emerging, that come together to coordinate policy responses to global challenges.
Their influence extends across economic growth, climate action, trade regulations, technology, and geopolitical stability — all of which have profound effects on the world market. This essay explores the formation, structure, objectives, and economic impact of the G7 and G20, while also examining their comparative roles in global governance and market coordination.
1. The G7: Origins and Evolution
1.1 Historical Background
The Group of Seven (G7) was formed in 1975 amid the oil crisis and global financial instability of the 1970s. The initial members were the United States, United Kingdom, France, Germany, Italy, and Japan, with Canada joining in 1976, making it seven nations. The European Union (EU) later became a participant in G7 meetings but not a full member.
Initially, the G7 served as an informal forum for leaders of advanced economies to discuss economic coordination and policy responses to inflation, exchange rates, and oil shocks. Over time, the agenda expanded to include trade liberalization, development aid, climate change, digital innovation, and global security.
1.2 Composition and Characteristics
The G7 countries collectively represent:
Around 45% of global GDP (as of 2025),
Approximately 10% of the global population, and
A major share of global trade, technology, and financial capital.
These nations are highly industrialized, democratic, and share values of free-market capitalism, human rights, and rule-based governance.
The G7 does not have a formal secretariat or permanent institution. Instead, it operates through annual summits hosted by member nations on a rotating basis. Decisions are not legally binding but carry immense political and economic weight due to the influence of its members.
1.3 Core Objectives
The main objectives of the G7 are to:
Promote global economic stability and sustainable growth.
Coordinate monetary and fiscal policies among advanced economies.
Support developing nations through aid and debt relief.
Strengthen free trade and oppose protectionism.
Address climate change and energy transitions.
Manage global crises such as pandemics, conflicts, and financial shocks.
1.4 G7’s Role in the Global Market
The G7 shapes the global market primarily through policy influence rather than direct control. Its discussions often set the tone for international financial institutions like the IMF, World Bank, and WTO.
For instance:
Monetary coordination: Central banks of G7 nations often align on interest rate policies and inflation control.
Trade frameworks: The G7 promotes rules-based trade and opposes protectionist barriers.
Climate finance: Members pledge billions to help developing countries transition to clean energy.
Crisis management: The G7 coordinated the global financial response to the 2008 crisis and the 2020 pandemic.
Because these economies dominate global financial systems — with the U.S. dollar, euro, pound, and yen as key reserve currencies — their decisions have direct impacts on currency markets, investment flows, and commodity prices.
2. The G20: Formation and Global Reach
2.1 Background and Formation
While the G7 represents advanced industrial economies, the G20 (Group of Twenty) was created in 1999 to bring emerging and developing economies into global decision-making. The Asian financial crisis of 1997–1998 exposed the need for a broader, more inclusive framework that could address interconnected global risks.
The G20 includes 19 countries plus the European Union, representing both advanced and emerging economies such as China, India, Brazil, South Africa, Mexico, Indonesia, Saudi Arabia, and others. Together, G20 members account for:
Over 85% of global GDP,
Around 75% of global trade, and
About two-thirds of the world’s population.
2.2 Structure and Operation
Like the G7, the G20 has no permanent secretariat. It functions through:
Annual Leaders’ Summits,
Finance Ministers and Central Bank Governors’ Meetings, and
Working groups on topics like climate, digital economy, health, and labor.
The presidency rotates annually, with the host nation setting the year’s agenda. For example:
India (2023) focused on “One Earth, One Family, One Future.”
Brazil (2024) emphasized sustainable growth and inclusive development.
2.3 Objectives of the G20
The G20’s mission is broader and more inclusive than the G7’s. Its key objectives include:
Promoting global economic stability and growth.
Ensuring financial market regulation to prevent crises.
Encouraging international trade and investment.
Addressing climate change and sustainable development.
Reducing global inequality and supporting low-income nations.
Enhancing digitalization and innovation in the global economy.
The G20’s broader membership allows it to address issues that affect both developed and developing nations, making it more representative of global interests.
3. The G7 and G20’s Influence on the World Market
3.1 Monetary and Fiscal Coordination
Both the G7 and G20 play a crucial role in coordinating monetary and fiscal policies. During crises like the 2008 Global Financial Crisis, the G20 facilitated coordinated stimulus packages that prevented a deeper recession. Similarly, during the COVID-19 pandemic, both groups supported liquidity programs and vaccine funding initiatives.
Such coordination stabilizes global capital markets, reduces exchange rate volatility, and boosts investor confidence.
3.2 Trade and Investment
The G20 has become the key platform for promoting open and fair trade. It supports WTO reforms, encourages global value chains, and resists protectionism. Emerging economies like India, China, and Brazil have gained greater influence in shaping international trade rules.
The G7, while smaller, continues to influence trade through strategic alliances, sanctions, and technological cooperation. Their joint efforts shape policies on digital trade, semiconductor supply chains, and energy transition — all of which significantly affect global stock and commodity markets.
3.3 Global Financial Regulation
After the 2008 crisis, the G20 spearheaded reforms in global financial regulation through institutions like the Financial Stability Board (FSB). This helped improve transparency, banking supervision, and systemic risk management.
The G7, meanwhile, remains influential in setting standards for banking supervision, anti-money laundering (AML), and cross-border taxation, affecting multinational corporations and global investors.
3.4 Sustainable Development and Climate Change
Both groups have prioritized sustainable growth.
The G7 commits to achieving net-zero emissions by 2050 and financing climate initiatives in developing nations.
The G20 promotes green finance, renewable energy investment, and the phasing out of fossil fuel subsidies.
As climate-related risks increasingly affect agriculture, manufacturing, and infrastructure, these commitments influence global commodity prices, investment trends, and corporate valuations.
3.5 Technology and Digital Economy
In the digital era, both G7 and G20 discussions address issues like artificial intelligence (AI), cybersecurity, data privacy, and digital taxation. Their cooperation helps create common standards that shape global tech markets and innovation ecosystems.
For example, the G7’s Digital Trade Principles and the G20’s AI frameworks guide how countries regulate cross-border data and digital platforms — crucial in a world where tech firms dominate market capitalization.
3.6 Geopolitical Stability and Market Confidence
Geopolitical tensions — such as the Russia-Ukraine war or U.S.-China rivalry — have significant global market consequences. The G7 often coordinates sanctions, defense support, and diplomatic pressure, while the G20 acts as a broader dialogue platform to prevent fragmentation.
Their coordinated responses help maintain market predictability, protect energy supply chains, and influence investor sentiment.
4. Criticisms and Challenges
Despite their global importance, both G7 and G20 face criticisms:
4.1 Representation Gap
The G7 is criticized for being elitist, representing only advanced nations.
The G20, while more inclusive, still excludes many smaller developing countries.
4.2 Implementation Challenges
Decisions made in summits are not legally binding, making implementation dependent on national will.
4.3 Geopolitical Divisions
Internal divisions — such as tensions between the U.S. and China or Russia’s participation in G20 — can reduce policy effectiveness.
4.4 Climate and Inequality Gaps
Although both groups pledge climate and development aid, actual disbursement often falls short of commitments, leading to credibility issues.
5. The Future of G7 and G20 in Global Governance
As globalization evolves, the G7 and G20 are expected to adapt to new challenges:
Managing the AI-driven economy and digital finance.
Addressing supply chain resilience post-pandemic.
Coordinating on debt restructuring for developing nations.
Ensuring energy security amid green transitions.
Promoting inclusive and equitable growth to reduce inequality.
Their relevance lies in their ability to bridge the gap between advanced and developing economies and create a stable, rule-based global market that fosters sustainable progress.
Conclusion
The G7 and G20 are twin pillars of international economic governance, each with distinct strengths. The G7 provides leadership and stability through the advanced economies’ policy coordination, while the G20 ensures inclusivity and representation of emerging markets in global decision-making.
Together, they form the foundation of global cooperation — influencing trade policies, financial systems, environmental sustainability, and technological standards that shape the world market. As global interdependence deepens, their ability to collaborate and implement forward-looking policies will determine the resilience and prosperity of the international economy in the decades ahead.
Types of Global Trade WarIntroduction
A global trade war occurs when nations impose tariffs, quotas, or other trade barriers against each other in retaliation for perceived unfair trade practices. These conflicts often stem from disputes over trade imbalances, currency manipulation, intellectual property theft, or protectionist policies. In a world where globalization has tightly interconnected economies, trade wars can have far-reaching consequences—affecting industries, consumers, financial markets, and diplomatic relations.
Trade wars are not new. From the Smoot-Hawley Tariff Act of 1930 in the United States to the U.S.-China trade conflict that began in 2018, the concept has evolved alongside the global economy. Today’s trade wars extend beyond simple tariff disputes to include technology restrictions, digital trade barriers, and strategic economic decoupling. Understanding the types of trade wars helps explain how economic competition shapes global power dynamics.
1. Tariff-Based Trade Wars
Definition
Tariff-based trade wars occur when countries impose import duties (taxes) on foreign goods to protect domestic industries or punish other nations. These tariffs make imported goods more expensive, discouraging their purchase and promoting local alternatives.
Characteristics
Involves direct taxation on goods crossing borders.
Often used as retaliation for another nation’s tariffs.
Creates immediate effects on global prices and supply chains.
Examples
U.S.–China Trade War (2018–2020): The United States imposed tariffs on over $360 billion worth of Chinese imports, while China retaliated with tariffs on U.S. agricultural and industrial products.
EU–U.S. Steel and Aluminum Dispute (2018): The U.S. imposed tariffs of 25% on steel and 10% on aluminum imports, claiming national security reasons. The European Union retaliated with tariffs on American goods like motorcycles and whiskey.
Impact
Tariff-based wars often lead to:
Increased consumer prices.
Disrupted supply chains.
Decreased global trade volumes.
Shifts in investment and manufacturing to non-tariff countries.
2. Non-Tariff Barrier Trade Wars
Definition
A non-tariff trade war uses regulatory restrictions instead of tariffs to limit trade. These may include import quotas, licensing requirements, product standards, or environmental regulations that disadvantage foreign companies.
Characteristics
Harder to identify and measure than tariffs.
Often justified as “safety” or “environmental” measures.
Can be used strategically to block competition.
Examples
Japan vs. U.S. Auto Disputes (1980s): Japan used strict safety and emissions standards to limit American car imports.
European Union’s Agricultural Rules: The EU’s regulations on genetically modified foods and pesticide use often act as barriers against U.S. agricultural exports.
Impact
Creates uncertainty for exporters.
Increases compliance costs.
Favors domestic industries under the guise of regulation.
3. Currency Manipulation and Exchange Rate Wars
Definition
Currency wars, also known as competitive devaluation, occur when countries intentionally devalue their currencies to make exports cheaper and imports more expensive, thus improving their trade balance.
Characteristics
Typically involves central banks or monetary authorities.
May lead to inflation or financial instability.
Can escalate into broader economic and geopolitical conflict.
Examples
China’s Yuan Policy (2000s): The U.S. accused China of keeping its currency artificially low to boost exports.
Global “Currency War” of 2010: Countries like Japan and Brazil intervened in foreign exchange markets to weaken their currencies after the U.S. Federal Reserve launched quantitative easing.
Impact
Encourages retaliatory devaluations.
Destabilizes global currency markets.
Reduces investor confidence.
May trigger capital flight from emerging markets.
4. Technology and Digital Trade Wars
Definition
In the 21st century, technology trade wars have emerged as a new front in global economic competition. These involve restrictions on data, technology exports, intellectual property rights, and the dominance of tech giants.
Characteristics
Focuses on control of strategic technologies like semiconductors, AI, and 5G.
Often framed as national security or data protection issues.
Targets specific companies rather than entire industries.
Examples
U.S.–China Tech Conflict: The U.S. restricted companies like Huawei and ZTE from accessing American technologies, citing security concerns. It also banned chip exports to China for advanced computing.
EU Digital Services Act (DSA): The European Union has imposed strict digital market regulations, often seen as targeting U.S. tech firms such as Google, Meta, and Amazon.
Impact
Fragmentation of global technology supply chains.
Slower innovation due to reduced collaboration.
Strategic decoupling between the U.S. and China in the semiconductor and AI sectors.
5. Resource and Commodity Trade Wars
Definition
These wars focus on critical natural resources—such as oil, gas, rare earth metals, or food—used as economic or political leverage.
Characteristics
Resource-rich nations restrict exports to gain political influence.
Import-dependent countries seek diversification or self-sufficiency.
Often intertwined with geopolitical tensions.
Examples
OPEC Oil Embargo (1973): Arab nations cut oil exports to the U.S. and other Western countries supporting Israel, leading to a global energy crisis.
China’s Rare Earth Export Controls (2010): China restricted exports of rare earth minerals crucial for electronics, targeting Japan after a territorial dispute.
Russia–Europe Gas Conflict (2022): Following the invasion of Ukraine, Russia reduced gas supplies to Europe, triggering an energy crisis and forcing European nations to find alternatives.
Impact
Sharp commodity price fluctuations.
Inflationary pressures globally.
Strategic realignments in energy and resource supply chains.
6. Agricultural and Food Trade Wars
Definition
Agricultural trade wars arise when countries impose restrictions or subsidies on food and farm products to protect domestic farmers or retaliate against other nations’ policies.
Characteristics
Often involves perishable goods like grains, meat, and dairy.
Highly political due to its effect on farmers and food security.
Influenced by health, safety, and environmental standards.
Examples
U.S.–EU Beef Hormone Dispute: The EU banned beef treated with growth hormones, while the U.S. claimed this violated World Trade Organization (WTO) rules.
India’s Rice and Wheat Export Bans (2022–2024): India limited exports to control domestic prices, impacting global food markets.
U.S.–China Agricultural Tariffs: China imposed tariffs on U.S. soybeans during the 2018 trade war, hurting American farmers.
Impact
Global food price volatility.
Disruption of agricultural supply chains.
Rising risk of food insecurity in developing nations.
7. Sanctions and Trade Embargoes
Definition
Trade sanctions and embargoes are political tools where nations restrict trade with specific countries to pressure them into policy changes. These are often unilateral or coalition-based rather than purely economic measures.
Characteristics
Used as instruments of foreign policy.
Target sectors like defense, energy, or finance.
Can be partial (targeted sanctions) or complete (full embargo).
Examples
U.S. Sanctions on Iran: Targeted Iran’s oil exports and financial transactions to curb its nuclear program.
Western Sanctions on Russia (2022): Following the invasion of Ukraine, Western nations imposed sweeping sanctions on Russian banks, oil companies, and oligarchs.
Cuba Embargo: The U.S. trade embargo on Cuba, in place since the 1960s, remains one of the longest-running in history.
Impact
Severe economic damage to targeted countries.
Global supply chain disruptions.
Emergence of black markets and sanction evasion networks.
8. Subsidy and Dumping Wars
Definition
Subsidy wars occur when governments financially support domestic industries to make their products cheaper internationally. Dumping happens when a country exports goods at below-market prices to gain unfair advantage.
Characteristics
Violates fair trade principles under WTO rules.
Leads to retaliatory tariffs and anti-dumping duties.
Common in sectors like steel, solar panels, and agriculture.
Examples
China’s Steel and Solar Subsidies: China has been accused by the U.S. and EU of subsidizing its steel and solar industries, flooding global markets.
Boeing vs. Airbus Dispute: The U.S. and EU accused each other of illegally subsidizing their aerospace giants, leading to WTO arbitration.
Impact
Market distortions and overcapacity.
Trade tensions within global manufacturing networks.
Long-term damage to fair competition.
9. Digital and Data Sovereignty Trade Wars
Definition
Digital trade wars revolve around data localization, privacy laws, and control over digital infrastructure. Governments use these measures to assert sovereignty over cyberspace and digital economies.
Characteristics
Focuses on control of citizens’ data and digital ecosystems.
Involves laws restricting cross-border data flows.
Part of broader efforts to reduce dependency on foreign technology.
Examples
EU’s GDPR (General Data Protection Regulation): Imposes strict data rules affecting U.S. tech companies operating in Europe.
India’s Data Localization Policy: Requires foreign companies to store user data locally, creating tensions with the U.S. tech industry.
China’s Cybersecurity Law: Restricts foreign companies’ access to Chinese digital markets.
Impact
Fragmentation of the global internet (“splinternet”).
Rising compliance costs for tech companies.
Reduced cross-border digital innovation.
10. Environmental and Green Trade Wars
Definition
As nations transition toward sustainable economies, green trade wars arise when environmental policies create new trade barriers or advantages.
Characteristics
Based on carbon emissions, climate regulations, and renewable technologies.
Can penalize “dirty” industries or reward green production.
Intersects with industrial and climate policy.
Examples
EU Carbon Border Adjustment Mechanism (CBAM): Imposes tariffs on imports from countries with weaker climate regulations.
U.S. Inflation Reduction Act (2022): Offers subsidies for domestic clean energy industries, criticized by the EU as protectionist.
China’s Solar Dominance: Accusations of unfair advantages in solar manufacturing due to state subsidies.
Impact
Reshapes global energy and industrial competition.
Encourages climate-friendly innovation.
Risk of conflict between developed and developing nations over “green protectionism.”
Conclusion
Global trade wars have evolved from simple tariff disputes to multifaceted economic conflicts involving technology, digital data, energy, and environmental policy. Each type—whether tariff-based, technological, or green—reflects deeper struggles for economic dominance, national security, and strategic autonomy.
While trade wars may provide short-term domestic protection, they often harm global growth, increase inflation, and reduce consumer welfare. Modern economies are too interconnected for isolationist strategies to succeed without consequences. The challenge for policymakers lies in balancing national interests with global cooperation—ensuring that competition fosters innovation rather than conflict.
Ultimately, understanding the types of global trade wars helps policymakers, investors, and citizens grasp how economic rivalries shape the future of globalization, technology, and international relations.
Capital Flows: Concept and Characteristics1. Introduction
Capital flows are among the most dynamic and influential forces in the modern global economy. They represent the movement of money across countries in search of investment opportunities, higher returns, and economic stability. These flows link financial markets, shape exchange rates, influence domestic interest rates, and contribute significantly to global economic growth. However, they can also generate volatility and crises if not managed properly. Understanding the concept, nature, and characteristics of capital flows is therefore essential for policymakers, investors, and economists alike.
In the broadest sense, capital flows refer to the movement of financial capital — funds for investment, trade, or production — between countries. These movements can take various forms, such as foreign direct investment (FDI), portfolio investment, external loans, or banking capital. In the era of financial globalization, capital flows have become a key determinant of macroeconomic performance, affecting balance of payments, currency stability, and the pace of development in emerging economies.
2. Concept of Capital Flows
Capital flows describe the movement of money for the purpose of investment, trade, or business production between nations. These flows can either be inflows (foreign capital entering a country) or outflows (domestic capital moving abroad). The fundamental objective of capital movement is to allocate global savings efficiently, directing funds from capital-abundant economies to those with productive investment opportunities.
From a macroeconomic perspective, capital flows are part of the financial account in a country’s balance of payments (BoP). The BoP records all international financial transactions over a specific period. When foreign investors purchase domestic assets or when international institutions provide loans, it results in capital inflows. Conversely, when residents invest abroad or repay foreign debt, capital outflows occur.
In essence, capital flows bridge the gap between savings and investment at the global level. Countries with savings surpluses lend to countries with deficits, facilitating growth and smoothing consumption over time. Yet, these movements also expose economies to risks, including sudden reversals, speculative attacks, and exchange-rate volatility.
3. Types of Capital Flows
Capital flows are typically categorized based on their nature, purpose, and duration. The major types include:
a. Foreign Direct Investment (FDI)
FDI represents long-term investments by foreign entities in productive assets such as factories, infrastructure, or businesses. It often involves control or significant influence over the management of the enterprise. FDI is considered stable because it is tied to physical and organizational capital. Examples include multinational corporations establishing subsidiaries or acquiring stakes in foreign firms. FDI contributes to job creation, technology transfer, and skill development, making it a preferred form of capital flow for developing nations.
b. Foreign Portfolio Investment (FPI)
FPI involves investment in financial assets such as stocks, bonds, or mutual funds without seeking management control. These investments are more liquid and short-term in nature compared to FDI. Portfolio flows respond quickly to changes in market conditions, interest rates, or investor sentiment, making them a major source of volatility in financial markets. While they provide liquidity and deepen capital markets, sudden withdrawals can destabilize economies.
c. Other Investment Flows
This category includes cross-border bank loans, deposits, and trade credits. These flows often occur through the banking system and can be highly cyclical. During global booms, banks expand international lending, but in crises, credit tends to contract rapidly, intensifying financial distress in emerging markets.
d. Official Flows
Official capital flows involve transactions between governments or international organizations. They include development aid, loans from international financial institutions like the IMF or World Bank, and sovereign bond investments. These flows often aim to stabilize economies, finance infrastructure, or promote development goals.
4. Characteristics of Capital Flows
Capital flows possess several defining characteristics that distinguish them from other forms of international transactions. These characteristics determine their behavior, impact, and policy implications.
a. Bidirectional Nature
Capital flows are inherently bidirectional, encompassing both inflows and outflows. Inflows refer to the foreign investment entering a country, while outflows denote domestic investment abroad. The balance between the two reflects the country’s attractiveness to global investors and its economic fundamentals.
b. Volatility
One of the most notable features of capital flows, especially portfolio and short-term flows, is their volatility. Capital moves swiftly across borders in response to changes in global interest rates, risk perception, or political stability. This “hot money” behavior can cause rapid appreciation or depreciation of currencies and abrupt shifts in liquidity conditions.
c. Sensitivity to Interest Rate Differentials
Capital flows respond strongly to differences in interest rates between countries. When a nation offers higher returns, it attracts inflows as investors seek better yields. Conversely, when interest rates fall, capital tends to exit in search of more profitable opportunities elsewhere. This dynamic is closely linked to the “carry trade” phenomenon in global finance.
d. Dependence on Economic Fundamentals
Sustained capital inflows generally depend on macroeconomic fundamentals such as GDP growth, inflation control, fiscal discipline, and political stability. Investors prefer economies with sound policies, strong institutions, and transparent regulatory environments.
e. Short-Term vs. Long-Term Orientation
FDI tends to be long-term and relatively stable, reflecting confidence in a country’s future prospects. In contrast, portfolio and banking flows are often short-term and speculative, seeking quick gains. The composition of capital flows thus affects the degree of stability in a country’s financial system.
f. Role in Currency Movements
Capital inflows increase demand for the domestic currency as foreign investors convert foreign currency into local money to purchase assets. This can lead to currency appreciation. Conversely, outflows can cause depreciation pressures. Hence, managing capital flows is crucial for exchange-rate stability.
g. Impact on Domestic Liquidity
Large capital inflows can expand domestic money supply, influencing inflation and credit growth. Central banks often intervene to sterilize excessive liquidity through open-market operations. Similarly, sudden outflows can tighten liquidity and trigger financial stress.
h. Influence of Global Sentiment
Capital flows are highly influenced by global risk appetite. During periods of optimism, investors pour money into emerging markets seeking higher returns. But during crises, they retreat to “safe havens” such as U.S. Treasury bonds or gold. This cyclical behavior often amplifies boom-bust patterns in developing economies.
5. Determinants of Capital Flows
Several factors drive international capital movements:
Interest Rate Differentials: Higher returns attract investors to a country’s financial assets.
Exchange Rate Expectations: Anticipated appreciation of a currency can attract inflows, while depreciation expectations cause outflows.
Economic Growth Prospects: Strong growth signals future profitability and attracts investment.
Political and Policy Stability: Transparent governance and sound fiscal management boost investor confidence.
Financial Market Development: Deep, liquid, and efficient markets encourage both FDI and portfolio inflows.
Global Liquidity Conditions: Quantitative easing or tightening by major central banks (like the U.S. Federal Reserve) influences global capital availability.
Risk Perception and Geopolitical Events: Wars, pandemics, or trade tensions can redirect flows toward safer economies.
6. Benefits of Capital Flows
When managed effectively, capital flows bring multiple economic benefits:
a. Investment Financing
Capital inflows supplement domestic savings, allowing countries to finance large-scale infrastructure, industrial, and technological projects. This accelerates economic growth and modernization.
b. Technology and Skill Transfer
Through FDI, developing countries gain access to advanced technologies, management expertise, and global value chains, boosting productivity and competitiveness.
c. Financial Market Development
Portfolio inflows promote the development of capital markets by increasing liquidity, improving asset pricing, and diversifying investor bases.
d. Job Creation and Income Growth
FDI generates employment opportunities, enhances wages, and stimulates demand in related sectors.
e. Fiscal and Monetary Gains
Capital inflows increase tax revenues and foreign exchange reserves, strengthening fiscal and monetary stability.
7. Risks and Challenges of Capital Flows
Despite their benefits, capital flows also pose several macroeconomic and financial risks:
a. Exchange-Rate Volatility
Large and sudden inflows can appreciate the domestic currency, reducing export competitiveness — a phenomenon known as “Dutch disease.” Conversely, abrupt outflows can cause sharp depreciation and inflation.
b. Financial Instability
Short-term speculative flows can amplify asset bubbles in equity or real-estate markets. When these bubbles burst, they lead to capital flight and banking crises.
c. Policy Dilemmas
Managing capital flows involves trade-offs between maintaining exchange-rate stability, monetary independence, and free capital mobility — often referred to as the “impossible trinity” in international economics.
d. Reversal Risk
The sudden reversal of capital flows, often triggered by global shocks, can lead to balance-of-payments crises and depletion of foreign reserves, as seen during the Asian Financial Crisis (1997) and the Global Financial Crisis (2008).
8. Policy Management of Capital Flows
Governments and central banks employ various strategies to manage capital flows:
Exchange-Rate Flexibility: Allowing exchange rates to adjust helps absorb shocks from volatile flows.
Foreign-Exchange Reserves: Maintaining adequate reserves provides a buffer against sudden outflows.
Macroprudential Regulations: Measures like capital adequacy ratios, reserve requirements, and lending limits safeguard financial stability.
Capital Controls: Temporary restrictions on short-term inflows or outflows can prevent excessive volatility.
Coordination with Fiscal Policy: Prudent fiscal management complements monetary policies to maintain investor confidence.
9. Capital Flows in Emerging Economies
Emerging markets, such as India, Brazil, and Indonesia, are particularly affected by global capital movements. Their growing markets and higher returns attract inflows, but structural weaknesses make them vulnerable to reversals. For instance, U.S. monetary tightening often leads to “capital flight” from emerging economies, putting pressure on their currencies. Hence, many developing countries focus on attracting stable FDI while managing short-term speculative flows carefully.
10. Conclusion
Capital flows form the lifeblood of the global financial system, linking nations through investment, trade, and finance. They enable countries to bridge savings gaps, finance development, and integrate into global markets. However, their benefits come with challenges — volatility, policy constraints, and potential crises. The key lies in maintaining sound macroeconomic fundamentals, transparent financial systems, and prudent regulation to harness the advantages of capital mobility while minimizing its risks.
In today’s interconnected world, capital flows symbolize both opportunity and vulnerability. For policymakers, the ultimate objective is not to restrict these flows but to manage them wisely — ensuring that global finance contributes to stable, inclusive, and sustainable growth.
3 Common Trading Mistakes Traders Should AvoidTraders of all levels, from beginners to experienced professionals, can fall prey to psychological mistakes that can lead to poor trading decisions and ultimately, losses. Understanding and avoiding these common mistakes is crucial for developing a sound trading strategy and achieving consistent success in the markets.
Here are three of the most prevalent trading mistakes traders should strive to avoid:
FOMO (Fear of Missing Out): FOMO is a pervasive emotion that can cloud traders' judgment and lead them to make impulsive decisions based on the fear of missing out on potential profits. This often involves chasing trends or entering trades without proper analysis, increasing the risk of losses.
To combat FOMO, traders should adhere to their trading plan, prioritize discipline, and focus on identifying high-probability trading opportunities rather than reacting to market movements out of fear.
Revenge Trading: Revenge trading is the emotional urge to recoup losses from previous trades by making hasty and ill-advised decisions. This often stems from a desire to prove one's rightness or regain a sense of control over the market.
To avoid revenge trading, traders should cultivate emotional detachment, accept losses as a natural part of trading, and avoid the temptation to let emotions dictate their trading decisions.
Gambler's Fallacy: The gambler's fallacy is the mistaken belief that past events influence the outcome of future events, leading to an assumption that trends will continue indefinitely or that random events can be predicted.
To overcome the gambler's fallacy, traders should recognize that each trade is an independent event with its own unique probabilities, and past performance is not a guarantee of future results. They should rely on sound trading analysis and risk management techniques rather than relying on hunches or superstitions.
By avoiding these common psychological mistakes, traders can develop a more disciplined and rational approach to trading, increasing their chances of achieving long-term success in the markets.
How to Generate More Profits During Earnings SeasonWho is in control of Price on the Day of the Earnings season CEO reports requires studying the stock chart 2-4 weeks ahead of the estimated date of the report.
Smaller Funds activity will disrupt runs intraday.
Professional Trading Companies are very active.
HFTs AI are making huge errors causing whipsaw action.
Buy Side has slowed and paused its accumulation in many stocks.

Something worth learning If you connect the dots together you'll see it matches trendlines and zones and also having multiple confluence in trading will give you an edge in the market
So many ways and strategies out there.
Break and retest is one of them it's simple and effective
I use Break and retest and others like RSI
The blck lines represent zones and if you check my entry and exit you'll see zones
Also on the RSI the exit is below 30% while the entry if above 70%
Note: sometimes RSI can be above 70% and below 30% for a long time doesn't it will reverse
That's why you use other confluences like strong zone or trendline
Don't just trade with OVERBOUGHT AND OVERSOLD
If this was helpful
Drop a like and comment 👍
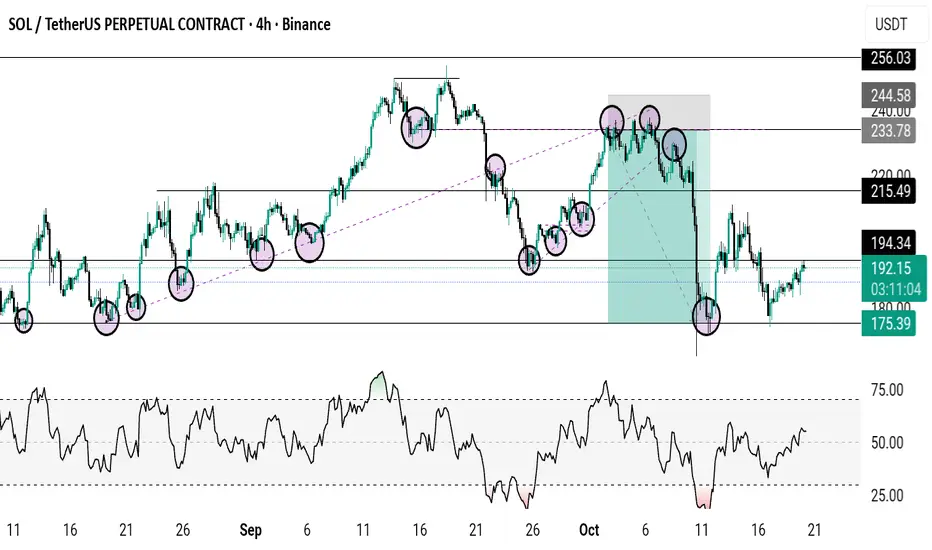
HOW-TO: Trade-o-Scope Plot Custom Data v2This is a short HOW-TO on using the Trade-o-Scope "Plot Custom Data v2" indicator
