Dollar Index Explodes: Understanding the Surge in the US DollarUnderstanding the Dollar Index
The Dollar Index is a weighted geometric mean of the U.S. dollar against six major currencies: the euro (EUR), Japanese yen (JPY), British pound (GBP), Canadian dollar (CAD), Swedish krona (SEK), and Swiss franc (CHF). Among these, the euro has the largest weight, constituting approximately 57.6% of the index. This weighting means that movements in the euro-dollar exchange rate have the most significant impact on the DXY.
The index provides a snapshot of the dollar’s strength relative to its peers, serving as a critical benchmark for traders, central banks, and multinational corporations. A rising DXY indicates a stronger dollar, meaning the U.S. currency can buy more foreign currency. Conversely, a falling DXY signals a weakening dollar.
Factors Driving the Dollar Index Surge
Several key factors contribute to a sharp increase in the Dollar Index:
Interest Rate Differentials
The Federal Reserve (Fed) influences the strength of the dollar primarily through interest rate policy. When the Fed raises interest rates, U.S. assets become more attractive to global investors seeking higher returns. This demand for dollar-denominated assets pushes the currency higher. If other major central banks, such as the European Central Bank or Bank of Japan, maintain lower rates or implement quantitative easing, the interest rate differential magnifies the dollar’s appeal, fueling a surge in the DXY.
Economic Growth and Stability
Strong economic performance in the U.S. relative to other countries strengthens investor confidence in the dollar. GDP growth, low unemployment, and robust consumer spending signal a healthy economy, making the U.S. an attractive destination for global capital. When the U.S. economy outperforms its peers, the dollar tends to appreciate, reflecting investor preference for stability and growth.
Global Risk Sentiment
The dollar is often considered a “safe-haven” currency. During times of geopolitical uncertainty, financial market volatility, or economic crises, investors flock to the U.S. dollar as a secure store of value. Events such as geopolitical conflicts, global recessions, or financial market turbulence can trigger a rapid influx of capital into U.S. assets, driving the Dollar Index higher.
Trade Balances and Capital Flows
A country’s trade balance and capital flows influence currency value. While the U.S. runs a trade deficit, the inflow of foreign investment into U.S. assets can offset this, supporting the dollar. A surge in foreign purchases of U.S. Treasuries, corporate bonds, or equities increases demand for dollars, contributing to the appreciation of the currency.
Commodity Prices
Many global commodities, including oil and gold, are priced in U.S. dollars. A stronger dollar makes these commodities more expensive in other currencies, which can feed back into the demand for dollars. Conversely, falling commodity prices in local currency terms can reduce inflationary pressures in other economies, further enhancing the dollar’s appeal.
Monetary and Fiscal Policy Divergence
Differences in monetary and fiscal policies between the U.S. and other economies can accelerate dollar strength. Expansionary fiscal measures, such as government spending and tax cuts in the U.S., combined with tightening monetary policy (higher interest rates or reduced asset purchases), can boost domestic demand while attracting foreign capital. Meanwhile, stagnation or loose policy abroad can weaken foreign currencies relative to the dollar.
Implications of a Surging Dollar
A sharp rise in the Dollar Index has wide-ranging effects on global economies, financial markets, and trade:
Impact on Emerging Markets
Emerging market economies often borrow in dollars. A stronger dollar increases the local currency cost of servicing dollar-denominated debt, potentially leading to higher defaults or financial stress. Additionally, it can trigger capital outflows as investors move funds to dollar-denominated assets, creating liquidity constraints in these economies.
Global Trade Dynamics
A stronger dollar makes U.S. exports more expensive and imports cheaper. While this may reduce U.S. export competitiveness, it can benefit consumers through lower import costs. Conversely, countries with weaker currencies may see a decline in export competitiveness, potentially exacerbating trade imbalances.
Commodity Market Volatility
Since commodities are priced in dollars, a rising DXY can depress commodity prices. Countries reliant on commodity exports may face reduced revenues, while importers benefit from lower costs. For investors, this can impact portfolio allocation and market strategies, creating shifts across sectors like energy, metals, and agriculture.
Financial Market Repercussions
Equity markets may react negatively to a soaring dollar, particularly multinational corporations that earn significant revenue abroad. A stronger dollar reduces the local-currency value of foreign earnings, affecting earnings reports and stock valuations. Bond markets may experience shifts in yield spreads as capital flows respond to currency strength.
Inflation and Policy Challenges Abroad
A surging dollar can exacerbate inflationary pressures in countries with significant import reliance. Higher costs for imports and raw materials may force foreign central banks to tighten monetary policy, potentially slowing economic growth. This dynamic can create global financial fragmentation, with divergent policy cycles across economies.
Historical Context and Examples
Historically, the Dollar Index has experienced explosive periods during times of financial turbulence or aggressive U.S. monetary policy. For example, during the global financial crisis of 2008, the DXY surged as investors sought safety in U.S. assets. Similarly, in periods when the Fed implemented aggressive rate hikes while other central banks remained accommodative, the dollar strengthened rapidly, affecting global markets and trade.
Conclusion
A surging Dollar Index reflects the complex interplay of U.S. economic fundamentals, monetary policy, global risk sentiment, and capital flows. While a strong dollar benefits U.S. investors and consumers in some ways, it presents challenges for exporters, multinational corporations, emerging markets, and commodity-reliant economies. Understanding the factors driving the DXY and its broader implications is essential for policymakers, traders, and investors navigating a globally interconnected financial landscape.
In essence, when the dollar explodes, it signals not just a shift in exchange rates but a ripple effect through trade, capital markets, and economic strategies worldwide. Monitoring the Dollar Index is therefore crucial for anticipating trends, managing risks, and seizing opportunities in both domestic and international markets.
Chart Patterns
Global Currency Reset (GCR)Introduction
The concept of a Global Currency Reset (GCR) refers to a hypothetical, large-scale revaluation or restructuring of the world’s major currencies. It is often discussed in financial, geopolitical, and alternative economic circles, suggesting that the current global monetary system—dominated by fiat currencies and led by the U.S. dollar—might undergo a systematic realignment to address imbalances in trade, debt, and economic power. While the idea is sometimes speculative, it has roots in real economic principles such as exchange rate adjustments, debt sustainability, and reserve currency dynamics.
The modern global financial system relies heavily on fiat currencies, which are government-issued money not backed by physical commodities like gold or silver. Central banks control these currencies through monetary policy, managing interest rates and money supply to stabilize economies. The dominance of certain currencies, particularly the U.S. dollar, Euro, and Japanese Yen, has created imbalances in trade, global reserves, and capital flows. A global currency reset, proponents argue, may correct these imbalances.
Historical Context
Understanding GCR requires examining historical precedents in monetary realignment. One of the most notable examples is the Bretton Woods system (1944–1971). Under Bretton Woods, global currencies were pegged to the U.S. dollar, which in turn was convertible to gold. This system provided stability after World War II but eventually collapsed due to trade imbalances, inflationary pressures, and the overextension of U.S. dollar obligations. The Nixon Shock in 1971, which ended the dollar’s convertibility to gold, led to a free-floating currency system. This shift created opportunities for currency misalignments, trade deficits, and competitive devaluations—the kind of issues a GCR aims to address in theory.
Another example is currency redenomination or revaluation, which has happened in various countries experiencing hyperinflation or financial crises. For instance, in Zimbabwe (2000s) or Venezuela (2010s), the local currencies collapsed, requiring either a new currency or adoption of foreign currencies to restore economic stability. Though these were domestic resets, they highlight the need for monetary adjustments when systems fail, which forms the conceptual basis for a global reset.
Reasons for a Global Currency Reset
Several economic and geopolitical factors are said to drive discussions about a GCR:
Global Debt Imbalances: Countries have accumulated enormous public and private debt, often denominated in foreign currencies. A currency reset could theoretically adjust debt burdens by realigning exchange rates.
Reserve Currency Dominance: The U.S. dollar currently serves as the world’s primary reserve currency. While this provides stability, it also creates dependency for countries holding dollar reserves. A reset could involve diversifying reserves to include other currencies or commodities like gold.
Trade Imbalances: Persistent trade deficits in some countries and surpluses in others create economic tensions. A reset could potentially adjust currency values to rebalance trade.
Economic Inequality Among Nations: The current system can favor strong economies, leading to currency undervaluation or overvaluation for weaker economies. A reset might aim to level the playing field.
Technological and Financial Evolution: Cryptocurrencies, digital currencies, and blockchain technology are challenging traditional banking structures, possibly pushing toward a more digitized and transparent global monetary framework.
Mechanics of a Potential GCR
While purely theoretical, proponents outline how a GCR could be implemented:
Revaluation of Currencies: The value of weaker or undervalued currencies could be adjusted upward relative to stronger currencies like the U.S. dollar, Euro, or Yen. This could help countries reduce trade deficits.
Debt Recalibration: Sovereign and corporate debts denominated in foreign currencies could be restructured to align with new exchange rates, reducing insolvency risk.
Commodity-Based Support: Some theories suggest linking currencies to commodities such as gold, oil, or a basket of resources to provide intrinsic value, much like the gold standard of the past.
Introduction of a New Reserve Currency: Speculative models propose replacing or supplementing the U.S. dollar with a global currency, possibly backed by a consortium of nations or an international organization like the IMF.
Digital Currency Integration: Central Bank Digital Currencies (CBDCs) could play a role in a reset by enabling transparent, traceable, and programmable global payments.
Potential Effects of a Global Currency Reset
A reset would have profound implications for global finance:
Exchange Rate Stabilization: Realignment could reduce currency volatility, making international trade more predictable.
Debt Relief and Redistribution: Economies burdened by debt could see relief if currency values and obligations are adjusted.
Impact on Wealth and Inflation: Sudden revaluation could affect savings, pensions, and purchasing power. Inflation may rise in countries with weakened currencies, while asset prices could fluctuate globally.
Geopolitical Power Shifts: Countries with weaker currencies could gain more economic leverage, while traditional financial powerhouses might see relative declines.
Investment and Trade Flows: Capital may flow toward newly strengthened economies, affecting stock markets, bonds, and commodities. Export-dependent economies could face challenges if their currencies appreciate too rapidly.
Challenges and Risks
While theoretically attractive, a GCR is fraught with challenges:
Global Coordination: Aligning major economies on currency values would require unprecedented political and economic cooperation, which is difficult given competing national interests.
Market Volatility: Sudden changes could trigger panic in forex markets, stock markets, and commodity markets, potentially causing global recessions.
Debt Defaults: Mismanaged resets could increase default risks if debts are not carefully renegotiated.
Speculation and Manipulation: Large-scale adjustments could be exploited by hedge funds and multinational corporations, destabilizing the intended outcome.
Social and Political Backlash: Citizens in countries experiencing rapid devaluation may face reduced purchasing power, leading to unrest.
Current Indicators and Trends
While there is no official global currency reset underway, several trends suggest that aspects of the GCR concept are being indirectly explored:
Diversification of Reserves: Countries like China, Russia, and India are diversifying foreign reserves into gold, Euros, and other currencies.
Rise of Digital Currencies: CBDCs and cryptocurrencies are emerging as alternatives to traditional banking, hinting at potential future frameworks for global monetary exchange.
Trade Realignments: Bilateral trade agreements denominated in local currencies are gradually reducing dependence on the U.S. dollar.
Debt Restructuring: International institutions are experimenting with debt relief mechanisms and currency swaps to stabilize economies.
Conclusion
The concept of a Global Currency Reset remains largely theoretical but represents an acknowledgment of systemic imbalances in the global monetary system. It is motivated by factors such as debt accumulation, currency dominance, trade imbalances, and technological innovation. While a well-managed reset could stabilize exchange rates, rebalance trade, and reduce debt pressures, it comes with immense challenges, including coordination, volatility, and geopolitical tension.
In practical terms, aspects of the GCR are already visible through digital currency experimentation, reserve diversification, and bilateral trade arrangements. Whether a full-scale reset ever occurs is uncertain, but the ongoing evolution of global finance suggests that currency realignments, whether gradual or abrupt, will remain a central topic in international economics.

Devaluation and Competitive Trading in the Global Market1. Understanding Currency Devaluation
Currency devaluation is a policy action taken by a country’s government or central bank to reduce the official exchange rate of its currency. For example, if the Indian Rupee is devalued against the US Dollar, it means more rupees are required to purchase one dollar. Unlike depreciation, which occurs due to market forces, devaluation is a deliberate policy measure, usually in countries with fixed or semi-fixed exchange rate regimes.
The primary objective of devaluation is to make a country’s exports cheaper and more attractive to foreign buyers while making imports more expensive. By doing so, countries attempt to correct trade imbalances, stimulate domestic production, and support economic growth. However, the impact of devaluation is multi-dimensional, influencing not only trade but also inflation, capital flows, and investor sentiment.
2. Mechanism of Competitive Advantage Through Devaluation
Devaluation is essentially a strategy to gain a competitive advantage in international trade. When a currency is devalued:
Exports Become Cheaper: Foreign buyers can purchase more goods and services from the devaluing country with the same amount of foreign currency. For example, if Japan’s yen weakens against the dollar, US companies can buy Japanese machinery at a lower dollar cost.
Imports Become Costlier: Domestic consumers and businesses have to pay more for imported goods, which can reduce import demand. This can also encourage domestic production to replace imported goods, boosting local industries.
Trade Balance Improvement: Cheaper exports combined with reduced imports help in improving the trade balance. A country running a persistent trade deficit may resort to devaluation to correct the imbalance.
This strategy is particularly relevant in highly competitive global markets where cost efficiency is a major driver. Export-oriented industries, such as textiles, electronics, and automotive manufacturing, often benefit significantly from a weaker domestic currency.
3. Competitive Devaluation and Global Trade Wars
While devaluation can boost a single country's competitiveness, it can also trigger a chain reaction in global markets known as a currency war. When multiple countries devalue their currencies to gain export advantages, the net gain for any single country may be limited. Moreover, such actions can disrupt global trade stability and lead to protectionist measures.
For instance, during the 1930s Great Depression, competitive devaluations by major economies worsened global economic conditions, reducing international trade and triggering retaliatory tariffs. More recently, countries like China and some emerging markets have used managed currency devaluation to support export-led growth, leading to tensions with trade partners who perceive these moves as unfair competitive practices.
4. Risks and Limitations of Devaluation
While devaluation can enhance trade competitiveness, it carries several risks:
Inflationary Pressures: Higher import costs can increase domestic inflation. Imported raw materials, energy, and consumer goods become more expensive, potentially eroding the benefits of increased export demand.
Capital Flight: Investors may perceive devaluation as a sign of economic weakness, prompting capital outflows. This can put further pressure on the currency and financial markets.
Debt Servicing Issues: Countries with foreign-denominated debt face higher repayment costs after devaluation. This can strain government budgets and corporate balance sheets.
Temporary Advantage: Currency devaluation often provides only a short-term boost to exports. Competitors can respond by devaluing their own currencies or improving productivity and efficiency, negating the initial advantage.
5. Strategic Use in Global Competitive Trading
Despite risks, strategic devaluation remains an essential tool in global trade:
Export-Oriented Industrial Policy: Countries targeting export-led growth often combine devaluation with industrial incentives, subsidies, and trade facilitation measures to strengthen competitiveness.
Balancing Trade Deficits: Nations with persistent trade deficits may devalue selectively to restore equilibrium without resorting to drastic fiscal or monetary measures.
Influencing Commodity Prices: Devaluation can affect global commodity trading. For example, a weaker currency may encourage commodity exporters to sell more products internationally at competitive prices.
Negotiating Power: Devaluation can also serve as a leverage in international trade negotiations, signaling the willingness to enhance competitiveness or protect domestic industries.
6. Case Studies of Devaluation in Competitive Trade
China: Over the past decades, China has frequently been accused of using currency devaluation to maintain its export dominance. By keeping the yuan undervalued relative to the US dollar, Chinese exports became cheaper globally, supporting rapid industrial growth.
Argentina: Argentina has repeatedly used devaluation to address economic crises, boost exports, and stabilize its trade balance. However, repeated devaluations also led to inflationary spirals and debt stress.
Japan (Post-2012 “Abenomics”): Japan’s central bank deliberately weakened the yen to make exports more competitive, helping to revive industrial output and corporate profits.
7. Global Market Implications
Competitive devaluation influences global trade patterns in several ways:
Shifts in Manufacturing Hubs: Countries with weaker currencies can attract foreign buyers, shifting global supply chains to lower-cost production bases.
Trade Diversion: Exporters in countries with stronger currencies may lose market share to cheaper alternatives, affecting global competitiveness.
Volatility in Foreign Exchange Markets: Large-scale devaluation and counter-devaluation cycles create forex market volatility, impacting investors and multinational corporations.
Impact on Multilateral Trade Agreements: Currency manipulation can complicate trade agreements. Organizations like the IMF and WTO monitor such practices to ensure fair trade competition.
8. Policy Recommendations and Modern Approaches
Given the complex nature of competitive devaluation, countries need careful policy planning:
Managed Devaluation: Gradual adjustment of currency avoids shocks to inflation and financial markets, allowing exporters to benefit without destabilizing the economy.
Productivity Enhancement: Beyond devaluation, improving labor efficiency, technology adoption, and logistics reduces reliance on currency manipulation for competitiveness.
Regional Coordination: In trade blocs like the EU, coordinated currency policy helps prevent destructive competitive devaluation among member states.
Diversification: Countries can combine currency management with diversification of export markets to reduce dependence on single markets and enhance resilience.
9. Conclusion
Devaluation remains a potent but double-edged instrument in global competitive trading. By lowering the currency’s value, countries can temporarily boost exports, improve trade balances, and stimulate domestic production. However, overreliance on devaluation carries risks such as inflation, capital flight, and trade retaliation. In the interconnected global market, the strategy of competitive devaluation must be complemented with productivity improvements, diversified trade policies, and sound macroeconomic management. Only then can countries achieve sustainable competitiveness while minimizing adverse effects on domestic and global economic stability.
Understanding the Bond Market and Interest RatesThe Surge in the Bond Market
A surge in the bond market refers to a rapid increase in bond prices, often accompanied by declining yields. In recent times, this phenomenon has been influenced by several global and domestic factors:
Economic Uncertainty:
Investors often flock to bonds during periods of uncertainty, such as geopolitical tensions, stock market volatility, or concerns about slowing economic growth. Bonds are seen as safer assets compared to equities, leading to increased demand and a surge in prices.
Central Bank Policies:
Central banks, like the Federal Reserve in the U.S., play a pivotal role in the bond market. When central banks signal interest rate cuts or maintain accommodative monetary policies, bond prices tend to rise as yields drop. Conversely, rate hikes can cause temporary volatility but sometimes lead to surges in certain segments of the market if investors anticipate slower economic growth.
Inflation Expectations:
Inflation erodes the real return on bonds. When markets believe inflation will remain contained or decline, long-term bonds become more attractive, pushing up prices. A surge often occurs when inflation indicators show signs of moderation.
Global Capital Flows:
Cross-border investment flows into safer bond markets can drive a surge. For example, if global equities are under pressure, international investors often seek bonds from stable economies, raising demand and prices.
The Interest Rate Battle
The "interest rate battle" refers to the ongoing struggle between central banks’ monetary policy objectives and market expectations. Central banks manipulate interest rates to balance economic growth, inflation, and employment. Their decisions significantly influence bond market dynamics:
Rate Hikes and Tightening:
Central banks may increase interest rates to control inflation. Higher rates make borrowing more expensive, slowing economic activity. In the bond market, rate hikes lead to falling prices for existing bonds because new issues offer better yields. However, aggressive hikes can sometimes trigger a flight to quality in government bonds if equity markets react sharply, creating short-term surges in demand.
Rate Cuts and Easing:
Conversely, central banks cut rates to stimulate growth during economic slowdowns. Lower rates reduce yields on newly issued bonds, making existing higher-yield bonds more attractive and pushing their prices higher. The bond market often reacts immediately to rate cut announcements, reflecting both current and expected future rates.
Forward Guidance and Market Psychology:
Central banks also influence the bond market through forward guidance—communicating future policy intentions. If markets perceive that rate cuts are imminent or that hikes are slowing, bond prices may surge even before actual changes occur. This psychological aspect of the bond market makes it extremely sensitive to statements from policymakers.
Recent Trends Driving the Surge
In recent years, several trends have intensified the bond market surge and highlighted the interest rate battle:
Post-Pandemic Recovery:
After the COVID-19 pandemic, central banks worldwide slashed rates to near zero and engaged in massive bond-buying programs. This created unprecedented demand for bonds, driving up prices and lowering yields.
Inflation Volatility:
Global inflation spikes, followed by moderation, have caused sharp swings in bond prices. Investors often anticipate central bank responses, leading to rapid market adjustments.
Debt and Deficits:
Governments’ rising debt levels have increased bond issuance, but central banks’ willingness to buy these bonds has supported prices. This delicate balance between supply and demand intensifies the “interest rate battle.”
Geopolitical and Economic Shocks:
Events like wars, trade tensions, or energy crises often push investors toward safe-haven bonds. Such shocks can temporarily override normal interest rate mechanics, creating surges in bond prices.
Bond Market Segments Affected
The surge is not uniform across all types of bonds:
Government Bonds:
Often considered the safest, government bonds experience significant demand during uncertainty. Their yields are closely watched as benchmarks for other markets.
Corporate Bonds:
Higher yields attract investors seeking returns, but they carry more risk. During surges, riskier corporate bonds may lag behind government bonds due to concerns about default.
Inflation-Linked Bonds:
Bonds tied to inflation, like TIPS in the U.S., react differently. When inflation expectations fall, these bonds may also surge because their relative yield advantage grows.
Impact on Investors and the Economy
The surge in the bond market and the interest rate battle have wide-ranging effects:
Investor Strategy:
Bond surges offer opportunities for capital gains, but they also require careful timing. Investors must weigh the potential for price increases against risks of future rate hikes.
Borrowing Costs:
For governments and corporations, surging bond prices reduce borrowing costs, facilitating fiscal spending or expansion. However, if the surge is driven by fear, it may indicate underlying economic weakness.
Portfolio Diversification:
Bonds act as a stabilizing force for portfolios, especially during equity market volatility. Understanding the dynamics of bond surges helps investors hedge risks effectively.
Interest Rate Transmission:
The battle over rates affects mortgages, loans, and savings rates. Surging bond prices signal market expectations for lower future rates, impacting consumers and businesses alike.
Conclusion
The surge in the bond market reflects the complex interplay between investor behavior, central bank policies, and economic conditions. It is both a reaction to immediate events and a forward-looking indicator of market expectations. The ongoing interest rate battle—whether central banks are hiking to curb inflation or cutting to stimulate growth—creates volatility but also opportunities for investors who understand the underlying mechanics.
In essence, the bond market surge is not just about prices rising; it’s a barometer of economic sentiment, policy expectations, and global financial stability. For investors, policymakers, and economists alike, deciphering this surge is crucial for making informed decisions in an interconnected world where interest rates and bond prices are inextricably linked.

Exchange Rates Guide1. Introduction to Exchange Rates
An exchange rate is the price of one currency expressed in terms of another. For example, if 1 US Dollar (USD) equals 83 Indian Rupees (INR), the exchange rate is 1 USD = 83 INR. Exchange rates serve as a mechanism to facilitate international trade and investment, allowing buyers and sellers to transact across borders.
Exchange rates can be quoted in two ways:
Direct quotation: Domestic currency per unit of foreign currency (e.g., INR per USD).
Indirect quotation: Foreign currency per unit of domestic currency (e.g., USD per INR).
2. Types of Exchange Rates
Exchange rates can broadly be classified into two main categories:
a. Fixed Exchange Rate
A fixed exchange rate, also known as a pegged rate, is set and maintained by a country’s central bank. The domestic currency is tied to a major currency such as the USD, EUR, or a basket of currencies. The central bank intervenes in the foreign exchange market to maintain the rate within a narrow band.
Advantages:
Stability in international trade.
Reduced exchange rate risk for businesses and investors.
Disadvantages:
Requires large foreign exchange reserves to defend the peg.
Less flexibility to respond to domestic economic conditions.
Examples:
Hong Kong maintains a peg to the USD.
Some Caribbean nations peg their currency to the USD.
b. Floating Exchange Rate
A floating exchange rate is determined by the forces of supply and demand in the foreign exchange market. There is no central bank intervention unless extreme volatility occurs.
Advantages:
Automatic adjustment to economic conditions.
No need for large foreign reserves to maintain the currency value.
Disadvantages:
Can be volatile and unpredictable.
May create uncertainty for international businesses.
Examples:
USD, EUR, and JPY operate largely under floating rates.
c. Managed or Hybrid Exchange Rate
Some countries use a managed float, where the currency primarily floats but the central bank occasionally intervenes to stabilize it. This approach provides a balance between stability and flexibility.
Example:
India uses a managed float system, allowing the INR to fluctuate but intervening when necessary.
3. Determinants of Exchange Rates
Exchange rates are influenced by multiple economic, political, and market factors:
a. Interest Rates
Higher interest rates in a country tend to attract foreign capital, increasing demand for that currency and causing appreciation. Conversely, lower rates may lead to depreciation.
b. Inflation Rates
Countries with lower inflation typically see their currency appreciate, as purchasing power remains strong relative to high-inflation countries.
c. Economic Growth
Strong economic performance attracts foreign investment, boosting demand for the domestic currency. Weak growth may lead to depreciation.
d. Political Stability
Countries with stable political systems attract more investment, supporting currency strength. Political turmoil or uncertainty can weaken a currency.
e. Trade Balance
A country with a trade surplus (exports > imports) experiences higher demand for its currency, leading to appreciation. A trade deficit can cause depreciation.
f. Speculation
Traders in the forex market often buy or sell currencies based on expected future movements, influencing exchange rates.
g. Central Bank Intervention
Central banks may buy or sell currencies to control volatility or maintain competitiveness in international trade.
4. How Exchange Rates Are Quoted
Currencies are always quoted in pairs, e.g., USD/INR or EUR/USD. The first currency is called the base currency, and the second is the quote currency.
Example: USD/INR = 83 means 1 USD equals 83 INR.
Bid price: The rate at which the market is willing to buy the base currency.
Ask price: The rate at which the market is willing to sell the base currency.
The difference between the bid and ask price is known as the spread, which represents transaction costs.
5. Impact of Exchange Rates
Exchange rates affect individuals, businesses, and entire economies:
a. International Trade
A weaker domestic currency makes exports cheaper and imports more expensive, potentially improving trade balances. A stronger currency has the opposite effect.
b. Investments
Investors consider exchange rates when investing abroad. Currency fluctuations can affect returns on foreign assets.
c. Inflation and Interest Rates
Depreciation can lead to higher import costs, causing inflation. Central banks may adjust interest rates to stabilize currency value.
d. Tourism
Tourists benefit from strong domestic currencies when traveling abroad, as they get more foreign currency for the same amount.
e. Government Debt
Countries with debt denominated in foreign currency may face higher repayment costs if their currency depreciates.
6. Foreign Exchange Market (Forex)
The foreign exchange market is the global decentralized market where currencies are traded. It operates 24/7 and is the largest financial market in the world, with daily trading volumes exceeding $8 trillion.
Key participants:
Central banks
Commercial banks
Hedge funds and investment managers
Corporations
Retail traders
Major currency pairs:
EUR/USD (Euro/US Dollar)
USD/JPY (US Dollar/Japanese Yen)
GBP/USD (British Pound/US Dollar)
USD/INR (US Dollar/Indian Rupee)
7. Exchange Rate Regimes Across Countries
Different countries adopt different regimes based on economic goals:
Developed economies: Typically floating rates.
Emerging markets: Often managed floats to control volatility.
Small economies: Frequently peg to a major currency for stability.
8. Currency Conversion and Hedging
Businesses dealing in multiple currencies often use hedging strategies to mitigate exchange rate risk. Common tools include:
Forward contracts: Lock in a future exchange rate.
Options: Provide the right, but not obligation, to exchange at a predetermined rate.
Swaps: Exchange currencies over a specified period.
Hedging helps reduce uncertainty, especially for exporters and importers.
9. Exchange Rate Policies
Countries implement policies to stabilize their currencies and protect the economy:
Monetary policy: Adjusting interest rates and liquidity.
Foreign exchange reserves: Buying or selling currencies to influence rates.
Capital controls: Regulating capital flows to reduce volatility.
10. Conclusion
Exchange rates play a pivotal role in the global economy, affecting trade, investment, inflation, and overall financial stability. Understanding how they are determined, the factors influencing them, and their impact on various sectors is essential for investors, businesses, and policymakers. Whether a currency is fixed, floating, or managed, the goal is to balance economic stability with competitiveness in the international arena.
A solid grasp of exchange rates and their mechanisms empowers individuals and organizations to make informed financial decisions, hedge against risks, and navigate the complex world of global finance.
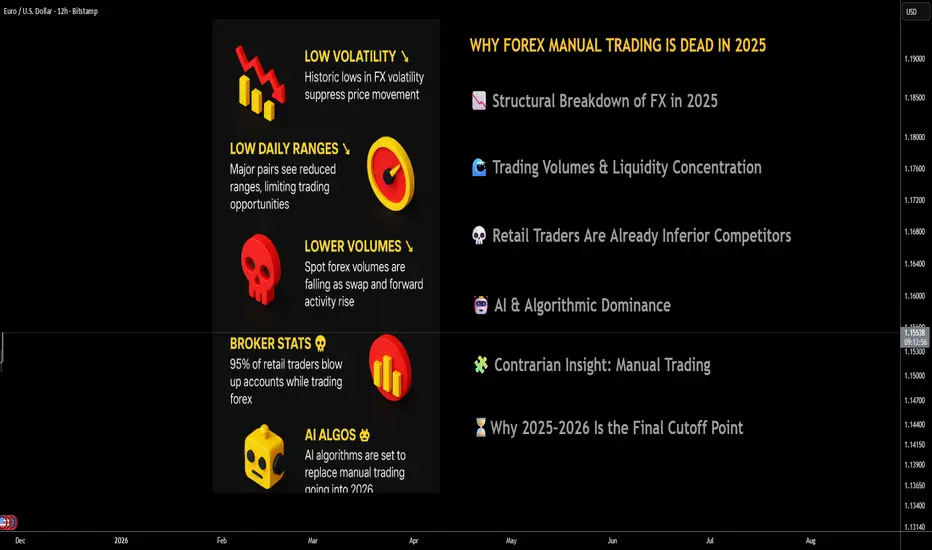
Why Manual Forex Trading Is Officially Dead 📘 Why Manual Forex Trading Is Officially Dead — And AI Will Bury It in 2026
________________________________________
1. 🚨 Executive Summary
Manual FX trading is not merely declining—it is entering its terminal phase. As of 2025, the confluence of record-low volatility, crushed daily ranges, shrinking spot volumes, and hyper-efficient AI execution frameworks has dismantled the edge discretionary traders once possessed.
Regulators report that 74–89% of retail CFD/FX traders lose money, with internal broker statistics showing even higher failure rates—often pushing the informal industry estimate of 90–95% account blow-up rates. The structural market environment now exacerbates those figures: less movement, tighter spreads, and faster AI-driven price formation leave no oxygen for manual decision-making.
The verdict is clear: manual FX trading is no longer a competitive activity—it's an anachronism.
________________________________________
2. 📉 Structural Breakdown of FX in 2025: A Market That No Longer Moves
The fundamental requirement for profitable manual FX trading—price movement—has been suppressed. According to multiple 2023–2024 analyses (Reuters, BIS), FX markets entered a multi-year period of historically subdued volatility, with the CVIX (Currency Volatility Index) sitting near multi-cycle lows.
Major pairs like EUR/USD and USD/JPY are posting 1/3 to 1/2 of their historical daily ranges, compressing intraday opportunity. What used to be 80–120 pip swings are now 30–50 pip oscillations dominated by micro-structure noise rather than directional moves.
In this environment, manual traders have insufficient statistical runway to generate returns, while AI systems can still monetize tiny dislocations at millisecond speed.
________________________________________
3. 🌊 Trading Volumes & Liquidity Concentration: The Game Has Moved On
The 2022 BIS Triennial Survey already documented a shift: spot FX volumes stagnated while swap and forward activity increased, driven by hedging and treasury optimization rather than speculative flows.
By 2025, institutional venues show continued softness in spot volumes, and even the leading eFX platforms reported lower activity during prolonged volatility droughts. This matters because:
• Lower volume = fewer sustained directional trends
• More volume concentrated among algos = fewer exploitable inefficiencies
• Liquidity providers internalize flow before it ever becomes visible to retail charts
Manual trading can’t survive structural liquidity centralization reinforced by machine execution.
________________________________________
4. 💀 Retail Traders Are Already Inferior Competitors and the Data Shows It
Manual traders are not just competing against the market—they are competing against:
• Prime brokers running internal AI risk engines
• HFT firms reading order books at microsecond resolution
• Banks using reinforcement-learning execution algos
ESMA’s regulatory disclosures show 74–89% of retail FX/CFD accounts lose money, but internal broker studies often cite 90–95% destruction rates, especially when volatility is muted.
The brutal truth: manual traders blow up because the game is no longer designed for human reaction speed or intuition.
________________________________________
5. 🤖 AI & Algorithmic Dominance: The 2026 Regime Shift
By 2026, FX will be AI-first, not human-first. Institutional adoption of AI execution is growing double digits annually (per GMI, GrandView), and retail brokers are already rolling out AI-assisted trade generation, AI signal clusters, and AI risk models.
AI advantages include:
• Predictive ability using LSTM/transformers trained on terabytes of tick data
• Zero-latency execution across fragmented liquidity pools
• Ability to profit in low-volatility regimes via microstructure edge
• Adaptive models that rewrite themselves every 24 hours
• No fatigue, no bias, no emotional degradation
In contrast, manual traders operate on slow cognition, subjective pattern recognition, and outdated chart heuristics. This is not a fair fight. Manual trading is no longer a skill—it's an obsolete hobby.
________________________________________
6. 🧩 Contrarian Insight: Manual Trading Isn't Just Dying—It’s Being Engineered Out
Here are non-obvious, high-conviction insights that institutional investors should consider:
(1) Market makers WANT low volatility
Low volatility increases internalization efficiency and reduces hedging costs. Human traders thrive on chaos; AI thrives on order. Who does the system favor?
(2) AI reduces liquidity available to humans
Liquidity is increasingly “dark” inside internal matching engines, meaning price discovery happens before retail traders ever see the candle.
(3) Manual trading can’t survive the “fractionalization” of edge
AI doesn’t need large moves—it monetizes micro-micro-inefficiencies in ways humans never could.
(4) Spread compression kills human R:R ratios
With 0.1–0.3 pip spreads on majors, AI can scalp micro-spreads—humans cannot.
(5) Behavioral inefficiencies have been minimized
Classic manual strategies—breakouts, fib levels, candlestick patterns—worked because humans created predictable behavioral cycles.
Now? AI models detect and arbitrage those behaviors instantly.
The most contrarian conclusion?
Manual trading didn’t die naturally—the market evolved to eliminate it.
________________________________________
7. ⏳Why 2025–2026 Is the Final Cutoff Point
Three forces collide in this window:
1. Volatility compression (structure-driven, not temporary)
2. AI adoption exceeding human adaptability
3. Retail traders facing the worst statistical environment in 15 years
This is the first time in FX history where:
• Human intuition has zero measurable edge
• AI dominance is irreversible
• Market conditions structurally reject manual trading
The past cycles always argued “vol will return.”
In 2025–2026, that is no longer a credible investment thesis.
________________________________________
8. 📈 Implications for Investors & Brokers
Investors should allocate to:
• AI-driven FX funds
• ML-enhanced macro strategies
• Data infrastructure feeding predictive FX models
Brokers should:
• Pivot to AI-based trading tools
• Monetize analytics subscriptions
• Shift away from promoting discretionary trading education
The firms that expect a retail manual trading revival will be structurally misaligned with market evolution.
________________________________________
________________________________________
🔥 Final Conclusion: Manual Traders Will Be Left Behind in 2026
The logic is now overwhelming:
low volatility + low ranges + reduced volumes + AI dominance = endgame for manual FX trading.
Human discretionary trading cannot survive in a marketplace designed for—and increasingly ruled by—data-driven, sub-millisecond, self-learning AI engines.
Manual traders in 2026 will not fight the bots.
They will simply be trading inside a system architected by the bots, reacting slowly to patterns that no longer exist.
The era is over.
The market has moved on.
RSI Bearish DivergenceAs we can see, there is a hidden RSI Divergence.
A HIDDEN RSI Divergence occur when we see lower highs for the price, and higher highs for the RSI.
The reason it is considered hidden is because the indicator refers to a momentum continuation, while the price is actually achieving lower highs.
This is confirmed by the last bearish candle we see.
...Please note, this is a 2 Hours Chart...
If the price breaks above and RSI continued to make higher higher along with the price, it might not divert.
On another note:
-We can notice a STRONG RSI Divergence, starting from the last candle in 30 October.
The reason it is strong is because the we see a strong price hike, and the momentum is decreased.

Anticipate Movement Inside of a Range EnvironmentA large portion of crypto price action does not trend. It ranges. And for many traders, this is where the most capital is lost. A range environment feels simple on the surface price moves between two boundaries, but inside those boundaries, liquidity builds, traps form, and false signals appear constantly. Understanding how ranges behave is a core skill for developing consistency.
A range forms when the market fails to create meaningful higher highs or lower lows. Buyers and sellers balance out, and price oscillates between defined support and resistance. This compression is not random. It reflects indecision, accumulation, or distribution depending on the higher-time frame context. Traders who treat a range like a trend are the ones most often punished.
The first step is identifying the boundaries. Equal highs at the top of a range and equal lows at the bottom reveal where stops accumulate. These stops become liquidity pools. Price frequently sweeps one side of the range before moving to the other, trapping breakouts and fading momentum traders. A clean sweep is not the breakout; it is the intention-revealing event before direction is chosen.
Inside the range, structural signals lose reliability. Traditional trend tools cannot be applied. Instead, focus on behaviour at the edges: rejection wicks, failed breakouts, displacement after a sweep, and reclaim patterns. These reactions show whether a sweep is simply clearing liquidity or if a genuine expansion is developing.
Patience is critical. Entering in the middle of the range exposes you to noise, uncertainty, and poor reward-to-risk. The edge comes from waiting at the boundaries where liquidity sits and confirmation appears. A range can persist far longer than expected, so forcing trades inside it leads to frustration and unnecessary losses.
The real purpose of studying ranges is not just to trade them but to anticipate what follows. A compression phase often precedes expansion. When liquidity on one side is taken and price breaks structure with intent, the next directional leg becomes far easier to participate in. Ranges are where future trends prepare themselves.

How to build Discipline & Structured Trading HabitsDiscipline is not something you rely on in the moment; it is something you build through habits that remove emotional decision-making from your trading process.
1. Define Rules Before You Trade
Traders without predefined rules rely on emotion. Traders with rules rely on structure.
Clearly define your entry criteria, risk per trade, maximum daily loss, and exit strategy.
When these rules exist before the session starts, you eliminate most impulsive behaviors.
2. Limit Your Daily Decisions
Every decision drains mental energy. The more choices you make, the weaker your discipline becomes.
Reduce the number of markets you watch, the number of setups you take, and the amount of chart time you expose yourself to.
Fewer decisions lead to higher-quality decisions.
3. Use a Pre-Session Checklist
A checklist forces you into a disciplined routine. It can include:
• Reviewing your trading plan
• Checking upcoming news releases
• Confirming your bias or market conditions
• Ensuring your risk settings are correct
The act of going through the checklist prepares your mind to follow structure.
4. Implement a Hard Stop for the Day
One of the fastest ways to lose discipline is to trade while emotional.
Set a maximum daily drawdown. Once it is hit, the session ends. No exceptions.
This protects both your capital and your psychology.
5. Track Your Rule Breaks
Most traders only track wins and losses. Disciplined traders also track deviations.
Write down every time you break a rule, why it happened, and how you plan to prevent it next time.
Over time, this builds awareness and accountability.
6. Delay Impulsive Actions
If you feel the urge to jump into a trade that does not fit your plan, delay the action by 30 to 60 seconds.
Impulses lose power quickly. By introducing a pause, you give your rational mind time to regain control.
7. Keep Your Environment Clean
Distractions destroy discipline.
Silence notifications, close irrelevant tabs, and avoid multitasking.
A clean trading environment supports clean decisions.
8. End Each Session With a Routine
A consistent end-of-day routine reinforces discipline. Examples:
• Rating your discipline on a scale from 1 to 10
• Reviewing whether you followed your rules
• Logging emotional triggers
Ending the day with structure makes it easier to begin the next one with structure.
Conclusion
Discipline is not built through motivation but through habits that create consistent behavior. A structured trading routine removes uncertainty, minimizes emotional influence, and helps you operate like a professional rather than a reactive participant.
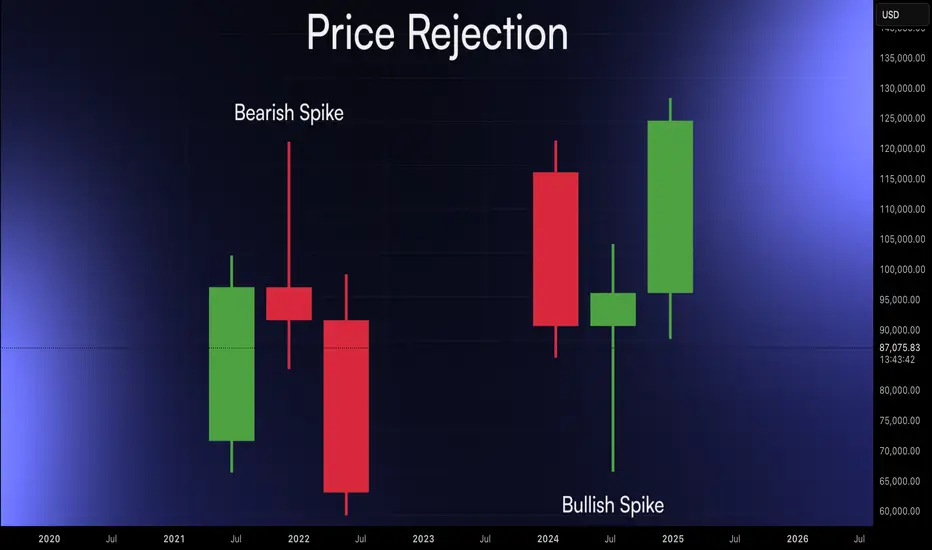
Candlestick Patterns That Actually MatterTraders often approach candlestick patterns by memorizing long lists instead of understanding the behaviour behind them. Crypto moves aggressively, hunts liquidity, and punishes textbook interpretations unless they occur at meaningful locations. The goal is not pattern collection. The goal is to recognize the few formations that consistently reveal intention when aligned with structure, liquidity, and context.
Engulfing Candles, Displacement and Control
What it shows: a clear shift where one side fully absorbs the other. This is participation, not random volatility.
When it matters: after impulses, at support or resistance, during liquidity sweeps, or when confirming a trend shift.
Why it’s valuable: engulfing candles often provide the first structural evidence that control has changed hands.
Rejection Wicks, Liquidity Taken, Pressure Reverses
What it shows: price tapped a high or low, triggered stops, and immediately met stronger opposing orders. This is how sweeps appear on a single candle.
When it matters: at equal highs/lows, session extremes, failed breakouts, and major swing points.
Why it’s valuable: wicks expose trapped traders and reveal where true supply or demand sits. They are early indicators of shifting intent.
Inside and Outside Bars, Compression and Expansion
Inside Bar: compression, tighter ranges, and reduced volatility ahead of expansion.
Outside Bar: immediate expansion where one side overwhelms both directions.
When they matter: at key levels before breakouts, during corrective legs, at consolidation boundaries, and after liquidity events.
Why they’re valuable: inside bars show preparation; outside bars show decision.
Treat these signals as behavioural information. Their value increases when combined with higher timeframe structure, liquidity mapping, momentum, volume, and session context.
Rapid ORB ProThis a live demonstration about our indicator. We will publish details tutorial in you tube and over her as well. How to use and guidelines to enter.

Reserve Currency Dominance in Global Trade1. What Is a Reserve Currency?
A reserve currency is a foreign currency held in significant quantities by central banks and financial institutions. It is used for:
International trade invoicing
Cross-border payments
Foreign exchange interventions
Investment in global assets
Storing national wealth
To serve as a reserve currency, it must be stable, widely accepted, highly liquid, and backed by strong institutions.
2. Why Some Currencies Become Dominant
A dominant reserve currency does not emerge overnight. It is built through decades of economic, political, and financial advantages. Historically, currencies like the British pound during the 19th century and the U.S. dollar after World War II gained dominance because:
A. Economic Size and Influence
The issuing country must be a major economic power.
The U.S. economy is one of the world’s largest.
Its deep financial markets attract global investors.
When an economy is big, its currency naturally becomes widely used because global businesses want access to that market.
B. Trust and Stability
Reserve currency users expect:
Stable inflation
Strong legal systems
Predictable governments
Transparent financial institutions
Countries hesitate to store reserves in a currency if the issuing government is unstable or unpredictable.
C. Deep and Liquid Financial Markets
Liquidity means assets can be bought or sold easily.
U.S. Treasury bonds are considered the safest and most liquid assets on Earth.
This makes the dollar extremely convenient for global central banks and funds.
D. Network Effects
The more people use a currency, the more others are forced to use it.
It becomes a self-reinforcing cycle:
“Everyone uses the dollar because everyone else uses the dollar.”
3. The Dollar’s Dominance in Global Trade
The U.S. dollar accounts for:
Around 60% of global forex reserves
Nearly 90% of forex transactions
More than 50% of global trade invoicing
Even countries that don’t trade with the U.S. often settle in dollars. For example:
Oil, metals, and agricultural commodities are mostly priced in dollars.
Many international loans and bonds are issued in dollars.
This dominance creates a uniform standard in global transactions and reduces exchange rate risks.
4. How Reserve Currency Dominance Shapes Global Trade
A. Trade Pricing and Invoicing Power
When most global goods are priced in a single currency, it simplifies international trade.
Businesses avoid complex exchange-rate conversions and hedge only against dollar fluctuations.
For example:
India buys crude oil from Saudi Arabia in dollars, not rupees.
Japan buys Brazilian iron ore in dollars, not yen.
This standardization reduces friction in supply chains.
B. Lower Borrowing Costs for the Dominant Currency Country
Because demand for the reserve currency is high, the issuing country can borrow at lower costs.
The U.S. government benefits enormously from this:
Foreign countries buy trillions of dollars in U.S. bonds.
This demand keeps U.S. interest rates lower than they otherwise would be.
Some economists call this the “exorbitant privilege.”
C. Increased Global Influence
Countries that depend on the dollar become sensitive to U.S. policies.
For example:
U.S. sanctions become far more effective because they limit access to the global financial system dominated by the dollar.
Reserve currency dominance therefore increases geopolitical power.
D. Exchange Rate Spillovers
When the dollar strengthens:
Global importers face higher costs
Emerging markets see increased currency volatility
Countries with dollar-denominated debt struggle
Dollar cycles heavily influence global commodity prices and capital flows.
5. Benefits for the Issuing Country
A. Global Demand for Its Assets
Other countries must hold dollar assets (bonds, stocks, etc.) to participate in global trade.
This inflow of foreign capital boosts:
U.S. financial markets
Investment
Corporate growth
B. Ability to Run Larger Deficits
The U.S. can print dollars and borrow cheaply.
This allows:
Higher government spending
Larger trade deficits
A strong consumer economy
Countries with non-reserve currencies don’t enjoy such flexibility.
C. Strong Geopolitical Leverage
The U.S. can limit access to:
SWIFT
Dollar clearing banks
U.S.-based financial institutions
This gives it unmatched diplomatic influence.
6. Challenges and Risks of Reserve Currency Dominance
A. Global Dependence on a Single Currency
Overreliance on the dollar exposes the world to U.S. economic cycles.
A strong dollar can cause:
Global recessions
Debt crises in emerging markets
Commodity price spikes
B. Vulnerability to U.S. Policies
Countries trading in dollars become exposed to:
U.S. interest rate changes (Federal Reserve policy)
Political sanctions
Dollar liquidity shortages
C. Internal Weakness in the Dominant Country
A country with a reserve currency might experience:
Overvalued currency
Loss of export competitiveness
Higher trade deficits
This is sometimes called the Triffin Dilemma.
D. Shift in Global Power Balance
As emerging economies grow, the dominance of a single currency may decline.
China’s yuan, Europe’s euro, or even digital currencies could dilute dollar power in the future.
7. Possible Contenders to Replace or Challenge the Dollar
A. The Euro
Strengths:
Large economic base
Strong institutions
Weaknesses:
Fragmented political structure
Debt issues in some member states
B. The Chinese Yuan
Strengths:
World’s second-largest economy
Rising global influence
Weaknesses:
Capital controls
Limited convertibility
Concerns over regulatory transparency
C. Digital Currencies and CBDCs
Central bank digital currencies (CBDCs) could change settlement systems.
However, widespread trust and adoption are still uncertain.
8. The Future of Reserve Currency Dominance
While the dollar remains dominant, global trends suggest:
Gradual diversification of reserves
Increased regional currencies in trade
Rise of digital settlement networks
Efforts by China and Middle East economies to reduce dollar dependence
But a complete shift away from the dollar is unlikely in the near future because:
No alternative matches its liquidity and trust.
Global markets remain heavily dollar-centric.
Any transition, if it occurs, will be slow and multi-polar.
Conclusion
Reserve currency dominance is a powerful global economic force that shapes international trade, investment flows, geopolitical strategies, and financial stability. The U.S. dollar currently holds an unmatched position due to its liquidity, trust, broad acceptance, and the strength of U.S. institutions. Although challenges such as de-dollarization, digital currencies, and the rise of other economies exist, the dollar’s dominance is supported by decades of structural advantages. Understanding this dynamic is essential for countries, investors, businesses, and policymakers participating in an increasingly interconnected global system.

Introduction to Central Bank Digital Currency Systems (CBDCS)What is a CBDC?
A CBDC is a digital version of a country's official currency issued and controlled by its central bank. Unlike cryptocurrencies such as Bitcoin, which operate on decentralized networks without government oversight, CBDCs are fully regulated, centralized, and legally recognized tender. They combine the stability of government-backed money with the speed and convenience of digital payment systems.
CBDCs should not be confused with existing digital banking transactions. Today, when individuals transfer money online, the transaction represents a claim on commercial banks. A CBDC represents a direct claim on the central bank, just like cash, making it risk-free, sovereign money.
Why Are CBDCs Emerging Now?
Multiple forces are driving the global interest in CBDCs:
1. Declining Cash Usage
In many countries, the use of cash for everyday transactions has sharply dropped due to digital wallets, UPI-like systems, and online commerce. CBDCs offer a state-backed digital alternative to preserve national currency sovereignty.
2. Rise of Private Cryptocurrencies and Stablecoins
Cryptocurrencies introduced programmable money and borderless payment possibilities. Governments fear that widespread adoption of private digital currencies could weaken monetary control. CBDCs provide a regulated alternative with comparable digital capabilities.
3. Need for Faster, More Efficient Payment Systems
Cross-border transfers remain expensive and slow. CBDCs can make payments cheaper, instantaneous, and more transparent.
4. Financial Inclusion
CBDCs can reach unbanked populations by offering digital wallets that do not require traditional bank accounts.
5. Enhanced Monetary Policy Tools
CBDCs allow central banks to manage liquidity and money supply more precisely, potentially even enabling direct stimulus to citizens.
Types of CBDCs
CBDCs are generally categorized into two forms:
1. Retail (General Purpose) CBDCs
These are designed for use by the public—consumers, merchants, and businesses.
They function similarly to digital cash and can be used for daily transactions, remittances, and savings.
Key features:
Accessible to all citizens
Held in digital wallets
Used for everyday payments
May or may not require bank accounts
2. Wholesale CBDCs
These are restricted for financial institutions, used in interbank transfers and settlements.
Key features:
Enhances efficiency of clearing and settlement
Improves liquidity management
Reduces counterparty and settlement risks
While retail CBDCs affect the broader economy and people’s daily lives, wholesale CBDCs focus more on improving institutional financial systems.
Core Components of a CBDC System
A Central Bank Digital Currency System relies on several foundational elements to maintain security, efficiency, and reliability:
1. Digital Ledger Technology (DLT)
CBDCs may operate on blockchain or traditional centralized databases. Not all CBDCs are blockchain-based, but DLT offers benefits like transparency, immutability, and programmability.
2. Digital Wallet Infrastructure
Users store and transact CBDCs using secure mobile or hardware wallets. Wallets may be custodial (managed by banks) or non-custodial (self-managed by users).
3. Identity and KYC Frameworks
CBDCs incorporate strong identity verification to prevent fraud, money laundering, and illicit transactions. Digital IDs, biometrics, and multi-factor authentication play an essential role.
4. Cybersecurity Architecture
Ensuring protection against hacking, data breaches, and systemic digital threats is fundamental. Resilience must match or exceed existing banking infrastructure.
5. Offline Transaction Capability
Many CBDC designs include offline payment features to allow transactions without internet access—crucial for rural regions or during network outages.
Advantages of CBDCs
CBDCs offer numerous economic and social benefits:
1. Reduced Transaction Costs
Digital payments through CBDCs eliminate intermediaries, lowering fees for individuals and businesses.
2. Faster Cross-Border Transactions
CBDCs can revolutionize international payments by enabling instantaneous and cost-efficient transfers.
3. Increased Financial Inclusion
People without bank accounts can access CBDCs through mobile wallets, making financial systems more inclusive.
4. Enhanced Transparency and Reduced Fraud
CBDC transaction trails can help reduce corruption, black markets, and tax evasion while still preserving controlled privacy.
5. Improved Monetary Policy Implementation
CBDCs give central banks new tools, including direct digital stimulus or programmable interest rates.
6. Resilience in Payment Systems
CBDCs provide backup infrastructure during failures in traditional banking or payment networks.
Challenges and Risks
Despite their potential, CBDCs present several issues that policymakers must address:
1. Privacy Concerns
One of the biggest public concerns is that government oversight of digital transactions may infringe on personal privacy. Balancing transparency and anonymity is a major design challenge.
2. Banking Sector Disruption
If consumers shift funds from banks to CBDC wallets, banks may face liquidity shortages, impacting their ability to lend. This risk may require limits on CBDC holdings.
3. Cybersecurity Threats
A successful cyberattack on a CBDC platform could have catastrophic consequences. Thus, robust digital protection is essential.
4. Implementation Costs
Developing, maintaining, and upgrading CBDC systems require significant financial and technological investment.
5. Interoperability Issues
Global coordination is needed to ensure CBDCs from different countries can interact smoothly for cross-border transactions.
Global Developments in CBDCs
Many countries are actively researching or implementing CBDCs:
China’s e-CNY is the most advanced large-scale CBDC, already used by millions.
India’s Digital Rupee (e₹) is under pilot testing for both retail and wholesale use.
The Bahamas’ Sand Dollar was one of the first fully launched CBDCs.
The European Union is exploring a Digital Euro.
The U.S. Federal Reserve continues researching but has not committed to implementation.
More than 100+ countries are currently investigating CBDCs, highlighting global momentum.
The Future of CBDC Systems
CBDCs are poised to reshape the global financial architecture. Over the next decade, digital currencies may become the primary medium for domestic payments, while cross-border CBDC corridors could make international finance faster and more efficient. Their integration with programmable smart contracts could also unlock new possibilities, such as automated tax collection, real-time subsidies, and highly secure corporate transactions.
However, the future adoption rate will depend on how well central banks address privacy, security, and economic risks. CBDCs must deliver convenience and trust without compromising individual freedoms or financial stability.

Are Derivatives Powerful in the Global Trade Market?1. What Are Derivatives?
A derivative is a financial contract whose value is derived from an underlying asset. This asset could be:
Commodities like crude oil, gold, wheat, natural gas
Currencies such as USD, EUR, JPY
Equity indices like Nifty 50, S&P 500
Interest rates such as LIBOR or government bond yields
Credit instruments like corporate bonds
The most common derivatives include:
Futures
Options
Swaps
Forward contracts
In the global trade market, derivatives’ primary purpose is risk transfer, although they are also used for speculation and arbitrage.
2. The Global Influence of Derivatives
Risk Management Backbone of Global Trade
Global trade is full of uncertainties—currency fluctuations, commodity price volatility, geopolitical tensions, supply chain disruptions, and interest rate changes. Derivatives serve as insurance-like tools that allow participants to lock in future prices, hedge risks, or stabilize cash flows.
For example:
An airline company hedges jet fuel futures to protect against rising crude prices.
An importer hedges currency risk using forex forwards to avoid losses if the dollar rises.
Exporters use options to protect against weakening foreign currencies.
Without derivatives, global trade would be significantly more dangerous and unpredictable.
3. Derivatives and Commodity Markets
Commodity derivatives such as oil futures, agricultural futures, and metal contracts are essential in global trade.
Why are commodity derivatives powerful?
Price Discovery
Derivatives markets reflect real-time global supply and demand conditions. Oil prices, for example, are heavily influenced by futures traded on major exchanges.
Stabilizing Prices for Producers and Consumers
Farmers hedge crop prices to secure income; manufacturers lock in raw material prices to control costs.
Enhancing Global Trade Flows
Multinational companies plan procurement and distribution based on futures price signals.
Reducing Market Manipulation
Transparent derivative markets help in curbing cartel behavior and monopolistic pricing.
Thus, commodity derivatives are one of the strongest tools that keep global trade systems efficient and predictable.
4. Currency Derivatives – The Engine of Cross-Border Commerce
In global trade, currency fluctuations can make or break profitability. A stable currency environment is a dream, but not the reality. Hence, forex derivatives are widely used.
How currency derivatives empower global trade?
Hedging exchange rate risks
Importers/exporters use forwards, futures, and options to secure exchange rates.
Supporting multinational operations
Corporations manage exposure across dozens of currencies simultaneously.
Providing liquidity to global markets
Forex derivatives markets are the largest in the world, with trillions traded daily.
Enhancing financial stability
Countries with export-driven economies rely on currency derivatives to prevent economic shocks.
Currency derivatives act as the hidden shield that protects companies and nations from unpredictable foreign exchange swings.
5. Interest Rate Derivatives – The Heart of Financial Stability
Because interest rates influence the cost of borrowing globally, interest rate swaps and futures form the backbone of global financial markets.
Their key powers include:
Helping governments manage debt.
Allowing banks to hedge interest rate exposure.
Enabling corporations to stabilize borrowing costs.
Ensuring smoother global credit flow.
Without interest rate derivatives, global financing would be far riskier, costlier, and more unstable.
6. Derivatives as Speculative and Profit-Making Instruments
While derivatives are risk-management tools, their power also comes from:
Speculation
Traders take positions on future market movements to earn profits. This:
Increases market liquidity
Enhances price discovery
Draws global capital into trade markets
However, speculation can also increase volatility if unchecked.
Arbitrage Opportunities
Derivatives allow traders to exploit price differences in different markets:
Spot vs futures
Domestic vs international exchanges
Currency arbitrage
Commodity pricing discrepancies
Arbitrage ensures that global markets remain efficient and interconnected.
7. How Derivatives Strengthen Global Market Efficiency
Derivatives contribute to global trade in several powerful ways:
A. Increased Liquidity
Markets with high liquidity:
Reduce transaction costs
Facilitate smoother trade
Attract global investors
Improve pricing accuracy
Derivative markets like CME, ICE, NSE, LME, and SGX provide massive liquidity to commodities, currencies, and equities.
B. Better Price Stability
Derivatives reduce sharp price swings, especially in commodities and currencies. This is essential for long-term contracts and procurement.
C. Improved Risk Sharing
Derivatives distribute risks across participants:
Hedgers transfer risk
Speculators accept risk
Arbitrageurs eliminate inefficiencies
This creates a smooth ecosystem for global trade.
D. Facilitation of Global Investments
Investors use derivatives to:
Hedge portfolio risks
Gain exposure to foreign markets
Manage geopolitical risks
This flow of capital boosts global trade volumes.
8. Challenges and Risks of Derivatives
Even though derivatives are powerful, they also have downsides:
1. High leverage risk
Small price movements can cause large profits or losses.
2. Systemic risk
Excessive derivatives trading contributed to crises such as:
2008 Global Financial Crisis
LTCM collapse
Oil futures flash crashes
3. Complexity
Sophisticated instruments like credit default swaps (CDS) are difficult to understand.
4. Counterparty risk
Failure of one party can create a chain reaction.
Despite these risks, regulatory reforms and clearinghouses have made derivative markets safer and more transparent.
9. The Future of Derivatives in Global Trade
Derivatives are becoming more powerful due to:
Digital platforms and electronic trading
AI-driven risk models
Expansion of global markets (India, China, ASEAN)
Growth in commodity and currency volatility
Rise of ESG and carbon credit derivatives
The next decade will see derivatives become even more integrated with global supply chains, energy markets, and financial systems.
Conclusion
Yes, derivatives are extremely powerful in the global trade market. They are not merely financial instruments but essential tools that support world commerce by:
Managing risks
Stabilizing prices
Enhancing liquidity
Improving efficiency
Supporting international investments
Strengthening financial stability
From farmers to oil companies, from banks to governments, derivatives underpin decisions and strategies across the global trade ecosystem. Without them, global markets would be less predictable, less efficient, and far more vulnerable to shocks.
Competitive Currency Wars1. What Are Competitive Currency Wars?
A currency war begins when one country deliberately devalues its currency to make its exports cheaper and imports more expensive. This leads to:
Higher export competitiveness
Increased domestic production
Potential rise in GDP
Shift of trade deficits toward trade surpluses
However, once one major trading nation devalues its currency, others often follow suit to protect their trade position. This spiral of competitive devaluations becomes a “race to the bottom”, destabilizing capital flows and weakening global financial stability.
Currency wars are rarely declared openly. They typically unfold through monetary policy, interest rate cuts, quantitative easing, or direct market intervention.
2. Why Countries Engage in Currency Wars
A. To Boost Exports
A weak currency makes domestic products cheaper for foreign buyers. Export-driven economies—like Japan, China, and South Korea—often use currency policy to support global sales.
B. To Reduce Trade Deficits
Countries facing large trade deficits (like the U.S. historically) often accuse trading partners of manipulating exchange rates.
C. To Encourage Domestic Industrial Growth
Lower currency value attracts manufacturing demand, protects domestic industries, and supports job creation.
D. To Stimulate Inflation
If an economy is facing deflation (falling prices), a weaker currency increases import prices, pushing inflation into the system.
E. To Manage Debt Burden
A weaker currency reduces the real value of domestic debt, making repayment easier.
3. Key Tools Used in Currency Wars
Countries deploy several policy mechanisms to weaken or control exchange rates:
1. Monetary Policy (Interest Rates)
Lower interest rates reduce returns on investments in that currency, leading to capital outflow and depreciation. Central banks often use rate cuts to support domestic credit growth and weaken currency value.
2. Quantitative Easing (QE)
Central banks inject liquidity by buying government and corporate bonds. More money in circulation generally lowers currency value.
The U.S. Federal Reserve used QE heavily after the 2008 crisis.
Japan’s “Abenomics” relied on aggressive QE to weaken the yen.
3. Direct Currency Market Intervention
Central banks buy or sell foreign currency reserves to influence the local exchange rate.
Example: The People’s Bank of China has historically bought dollars to keep the yuan weaker.
4. Capital Controls
Governments may restrict money inflows or outflows to protect their currency from appreciation or depreciation.
5. Trade Tariffs and Economic Policies
Though not direct currency tools, such measures often accompany or provoke currency wars.
4. Historical Examples of Currency Wars
A. The Great Depression (1930s)
Countries abandoned the gold standard and devalued their currencies to gain export advantages. This period is often called the first modern currency war.
B. The Asian Financial Crisis (1997–98)
Thailand, Indonesia, and South Korea saw massive currency depreciations. Competitive moves followed as neighboring economies attempted to maintain trade competitiveness.
C. The U.S. vs China (2000s–2010s)
China was accused of keeping the yuan artificially low to boost exports. Tensions peaked around 2010–2015, intensifying global currency debates.
D. Post-2008 Global Financial Crisis
Massive global QE programs triggered competitive devaluations:
U.S. dollar weakened due to QE
Japan pushed yen down via Abenomics
Emerging markets reacted to defend their own currencies
This period is considered a modern example of global currency war dynamics.
5. How Currency Wars Affect the Global Economy
Competitive currency wars may offer short-term growth benefits to some nations, but they carry significant risks. Their impacts spread across:
A. Trade Balances
A weaker currency increases exports and reduces imports, but if multiple countries devalue simultaneously, the net effect becomes negligible. This leads to global trade instability.
B. Global Investment Flows
Currency uncertainty discourages foreign investment. Investors prefer stable currencies and predictable returns; currency wars increase volatility.
C. Inflation and Purchasing Power
Devalued currency raises import prices, leading to inflation. While mild inflation can stimulate growth, uncontrolled inflation reduces public purchasing power.
D. Commodity Prices
Commodities like oil, gold, and metals are dollar-denominated. If major currencies weaken:
Commodity prices rise in local currency
Import-dependent nations face higher costs
E. Stock Markets and Bonds
Currency weakening often boosts domestic stock markets as export-driven companies benefit. However, government bond markets may suffer due to capital outflows.
F. Geopolitical Tensions
Accusations of currency manipulation can escalate into:
Trade wars
Tariff battles
Diplomatic standoffs
For example, U.S.–China tensions over exchange rates influenced global trade policy for years.
6. Benefits of Currency Wars (Short-Term)
1. Export Boost
Helps domestic manufacturers stay competitive.
2. Economic Growth
Weaker currency can ignite growth during stagnation.
3. Job Creation
Export-dependent industries grow employment.
4. Debt Management
Real debt burden reduces with depreciation.
7. Risks and Long-Term Costs of Currency Wars
1. Global Instability
Currency wars destabilize global financial markets.
2. Retaliatory Devaluations
One country's move triggers others, amplifying volatility.
3. Imported Inflation
Higher prices for imported goods hurt consumers.
4. Financial Market Distortions
Capital flight, volatile stock markets, unstable bond yields.
5. Loss of Investor Confidence
If investors expect sustained devaluation, they withdraw capital.
6. Trade Conflicts
Countries may impose tariffs or sanctions, damaging global trade.
8. Are We in a Currency War Today?
In recent years, global economic conditions—such as rising U.S. interest rates, geopolitical tensions, inflation cycles, and post-pandemic stimulus—have created conditions resembling a currency war environment. Central banks are aggressively adjusting policies, and exchange-rate competition is visible among major economies like the U.S., China, Japan, and Europe.
9. Conclusion
Competitive currency wars represent a complex interplay of economics, politics, and global finance. While currency devaluation can offer short-term advantages such as export growth and inflation management, the long-term consequences often outweigh the benefits. Currency wars can ignite international tensions, distort global markets, and create instability for investors, consumers, and policymakers alike.
In a deeply interconnected world, sustainable economic growth depends more on cooperation than competitive devaluations. Countries must balance domestic priorities with global responsibilities, as excessive currency competition can ultimately harm all players in the global economic system.

De-Dollarization and Currency Wars1. Understanding De-Dollarization
What Is De-Dollarization?
De-dollarization refers to the global movement to reduce reliance on the U.S. dollar in international trade, investments, foreign reserves, and global transactions. It includes:
Trading commodities in local currencies
Building reserve pools using alternative currencies
Developing rival payment systems
Creating digital or regional currency blocs
This shift is driven by both economic necessity and geopolitical strategy.
2. Why Is De-Dollarization Happening?
While the U.S. dollar remains extremely powerful, several factors are pushing countries—especially emerging economies—to explore alternatives.
(a) Geopolitical Pressures and Sanctions
U.S. sanctions have targeted countries like Russia, Iran, and Venezuela. These nations view the dollar as a vulnerability, because their access to global finance can be blocked.
This has motivated them to:
Use yuan, ruble, or local currencies for trade
Build alternative payment routes
Increase gold reserves
(b) Rising Economic Power of Asia
China’s economic rise is a major catalyst. With its massive manufacturing and consumption base, China can negotiate trade in yuan. Initiatives like the Belt and Road also push partner nations toward the yuan.
(c) Diversifying Risk
The dollar’s strength can hurt emerging markets. For example:
When the dollar rises, global borrowing costs increase
Developing countries suffer currency depreciation
Trade deficits worsen
To protect themselves, nations diversify into euros, gold, or local currencies.
(d) Digital Currencies and Technology
The growth of:
Central Bank Digital Currencies (CBDCs)
Blockchain settlement systems
Instant cross-border payment networks
…allows countries to bypass traditional dollar-based financial pipes.
(e) The U.S. Debt Burden
The U.S. carries huge national debt. Some nations fear long-term currency devaluation or inflation, encouraging them to reduce their dollar exposure.
3. Methods of De-Dollarization
Countries use multiple strategies to reduce dollar dependence.
(a) Bilateral Trade in Local Currencies
Examples include:
India–Russia trade in INR
China–Brazil trade in CNY
Gulf nations exploring yuan-based oil trade
(b) Increasing Gold Reserves
Central banks worldwide have been buying gold aggressively as a non-dollar store of value.
(c) Regional Currency Blocs
Initiatives like:
BRICS currency basket
Gulf digital currencies
Asian currency corridors
…aim to create shared alternatives.
(d) Payment System Alternatives
To bypass SWIFT, countries develop systems like:
China’s CIPS
Russia’s SPFS
India’s RuPay and UPI-based cross-border links
(e) Digital Settlements for Trade
CBDCs allow nations to settle trade instantly without using dollars.
4. What Are Currency Wars?
Currency wars occur when countries deliberately influence their exchange rates to gain a competitive advantage in global trade.
A currency war typically involves:
Devaluing local currency to boost exports
Printing more money (quantitative easing)
Lowering interest rates
Using tariffs or capital controls
Strategic buying/selling of foreign currencies
Currency wars create global tension and can destabilize markets.
5. Why Do Currency Wars Happen?
(a) Boost Export Competitiveness
A weaker currency makes exports cheaper. Export-driven economies like China, Japan, and South Korea have historically used currency policies to support growth.
(b) Counter Inflation or Recession
Central banks may adjust currency values to manage domestic crises.
(c) Respond to Competitor Moves
If one country lowers its currency value, others may retaliate to protect their trade advantage.
(d) Geopolitical Rivalries
Nations may use currency strategies as part of broader political conflicts.
6. How De-Dollarization Leads to Currency Wars
Though separate concepts, de-dollarization and currency wars interact in powerful ways.
(a) Diversification Creates Volatility
As countries move out of dollars into other currencies, fluctuations increase. This can trigger competitive devaluations.
(b) New Currency Blocs Compete for Influence
For example:
Dollar vs. Yuan
Dollar vs. Euro
BRICS vs. G7 systems
Such competition can escalate into currency conflicts.
(c) Trade in Local Currencies Reduces Dollar Liquidity
This weakens dollar dominance, prompting the U.S. to defend its currency through monetary tightening.
(d) Interest Rate Wars
Countries may raise or cut rates to control capital flows. This can set off a chain reaction across economies.
7. Impacts of De-Dollarization on the Global Market
(a) More Currency Options for Trade
Countries gain flexibility in trade agreements.
(b) Reduced Dollar Monopoly
While the dollar remains strong, alternatives weaken its monopoly.
(c) Growth of Regional Economic Blocs
Asia, the Middle East, and BRICS strengthen through local-currency arrangements.
(d) Decline of U.S. Financial Influence
U.S. sanctions and policies become less effective as countries establish independent systems.
(e) Increased Use of Gold and Digital Currencies
Both are emerging as major global reserves.
8. Impacts of Currency Wars
Currency wars create instability in global markets.
Positive Effects (for some nations)
Boosts exports
Attracts foreign investment
Increases competitiveness
Negative Effects (for the world)
Higher inflation
Volatile foreign exchange markets
Trade conflicts
Uncertainty in commodity prices
Global recession risk
Emerging economies are especially vulnerable, as they face rapid capital outflows when major currencies fluctuate sharply.
9. The Future: Will the Dollar Lose Its Dominance?
The dollar is still extremely powerful because:
Most global reserves are in dollars
Oil is mainly priced in dollars
U.S. markets are deep and liquid
Investors trust U.S. institutions
However, the trend toward de-dollarization is real, and over time:
The world may shift from “dollar dominance” to “multi-currency coexistence”
Trade may use baskets of currencies
Digital currencies may reduce dependence on any single currency
BRICS and Asian regions may emerge with stronger financial systems
The dollar will not disappear, but its share of global influence will gradually decline.
Conclusion
De-dollarization and currency wars are two powerful forces reshaping the global economic order. While de-dollarization seeks to diversify the global financial system away from the dollar, currency wars reflect nations’ battles to gain economic advantage through strategic currency manipulation. Together, they represent a shift from a unipolar, dollar-centric world toward a more multipolar, competitive, and technologically driven financial landscape. The transition will not be smooth, but it signals a new era where global power will increasingly depend on currency strategies, digital innovation, and regional cooperation.

Currency Peg Rates and Their Role in the Global Market1. What Are Currency Pegs?
A currency peg is an agreement by a government or central bank to maintain its currency at a fixed exchange rate relative to another currency. Common anchors include:
US Dollar (USD) – most dominant
Euro (EUR) – used by countries in Europe or those influenced by EU trade
A basket of currencies – used by nations wanting diversified stability
Examples include:
Hong Kong dollar peg to USD
Saudi riyal peg to USD
Danish krone peg to Euro
In a pegged system, the central bank must intervene in the forex market—buying or selling foreign reserves—to maintain the peg.
2. Why Countries Use Currency Pegs
A. To Promote Trade Stability
Trade depends heavily on predictable currency values. When a country pegs its currency to that of a major trading partner, exporters and importers face fewer exchange-rate risks. This stability helps:
Boost long-term trade agreements
Encourage foreign direct investment (FDI)
Reduce transaction costs
For example, Gulf countries selling oil in USD benefit from a USD peg since their export revenues stay stable.
B. To Control Inflation
Countries with historically volatile monetary systems use pegs to “import stability” from stronger economies. Pegging to a disciplined currency forces domestic monetary policy to align with the anchor country’s stability. This helps:
Reduce hyperinflation
Maintain price stability
Build investor trust
Argentina, for instance, used a USD peg in the 1990s to curb runaway inflation.
C. To Attract Foreign Investment
Foreign investors prefer stable exchange rates. Pegs give clarity and reduce forex risk, which is appealing for:
Portfolio investors
Foreign companies setting up factories
Global banks
Stable currencies reduce uncertainty and encourage long-term investment.
D. To Protect Small or Open Economies
Small economies with limited export diversity or unstable political environments benefit greatly from a fixed currency. Pegs help maintain:
Financial order
Market confidence
Predictable business conditions
This is why many island nations and resource-dependent economies use fixed exchange rates.
3. How Currency Pegs Work in the Global Market
A. Central Bank Intervention
To maintain the peg, the central bank must buy or sell foreign reserves.
If the domestic currency weakens, the central bank sells foreign reserves to support it.
If it strengthens, the central bank buys foreign currency to prevent appreciation.
This mechanism keeps the domestic currency within a defined band.
B. The Role of Foreign Exchange Reserves
Countries with pegs must maintain large forex reserves. These reserves act as a buffer to defend the peg during market volatility.
China, Saudi Arabia, and Hong Kong maintain significant reserves for this reason.
C. Impact on Global Capital Flows
Pegs influence how money moves across borders. A stable peg can attract capital inflows, while a weak or unsustainable peg can trigger:
Speculative attacks
Rapid capital outflows
Market panic
The 1997 Asian Financial Crisis is a classic example where unsustainable fixed rates caused speculative attacks.
4. Advantages of Currency Pegs in the Global Market
A. Stability for Trade and Investment
Currency pegs reduce exchange-rate volatility, supporting international trade and long-term contracts.
B. Confidence Building
Investors and trading partners trust economies whose currencies behave predictably.
C. Lower Inflation
Pegs can anchor domestic prices to those of more stable economies.
D. Strategic Trade Advantages
Countries can peg at undervalued levels to maintain export competitiveness. China historically used a partially managed peg for this purpose.
5. Challenges and Risks Associated with Currency Pegs
A. Loss of Monetary Policy Independence
The biggest drawback is that a country cannot freely decide its interest rates. It must follow the monetary policy of the anchor country to maintain the peg.
This can be problematic during domestic recessions or inflationary pressures.
B. Requirement of Large Forex Reserves
Defending a peg requires massive reserves, which is costly. Without sufficient reserves, the peg becomes vulnerable.
C. Vulnerability to Speculative Attacks
If traders believe a peg is unsustainable, they can short the currency. This can collapse the peg, as seen in:
Thailand (1997)
Mexico (1994)
Argentina (2001)
D. Economic Distortions
A peg can create artificial stability. If the currency is pegged too high or too low, it can misrepresent true economic conditions, leading to:
Trade imbalances
Over-reliance on imports
Asset bubbles
6. Currency Pegs and Global Economic Events
A. During Oil Price Shocks
Oil-exporting countries with USD pegs remain stable because oil is traded globally in dollars. Pegs help smooth revenue fluctuations.
B. During Financial Crises
Some countries break their pegs during crises to regain monetary control, while others defend their pegs to maintain confidence.
C. During Global Inflation Waves
When the anchor currency experiences inflation (e.g., USD inflation cycles), countries pegged to it import inflation as well. This can create stress on domestic economies.
7. How Pegs Influence Global Trade Dynamics
Currency pegs can make countries more competitive in global markets. For example:
If a currency is pegged at a lower level, exports become cheaper.
If pegged too high, imports become cheaper but exports suffer.
This can trigger global reactions, including tariff threats or currency war accusations.
8. The Future of Currency Pegs
Even as digital currencies and floating rates dominate modern finance, currency pegs continue to play a vital role. Many countries rely on them for stability, while some use hybrid systems:
Managed float with a peg band
Basket-based pegging
Pegged but adjustable systems
With growing geopolitical tensions, shifts in trade alliances, and rising interest-rate cycles, pegs will remain influential tools in shaping global markets.
Conclusion
Currency peg rates are powerful tools that shape global economic behaviour. By tying a currency to a stable or strategically chosen anchor, countries can enhance trade stability, control inflation, and attract investment. However, they also face challenges such as loss of monetary independence, speculative risks, and heavy reliance on foreign reserves.
In the global market, currency pegs are both stabilizers and potential sources of volatility—depending on how well they are maintained. Their importance will continue as countries navigate an increasingly interconnected and uncertain economic environment.
Resource Commodity Supercycle in the Global Market1. What Is a Commodity Supercycle?
A commodity supercycle refers to a prolonged period—usually lasting 20–30 years—where prices of essential resources such as energy, metals, and agricultural goods experience sustained growth. Unlike short-term price spikes caused by temporary supply issues, supercycles emerge from deep structural shifts in the global economy.
A supercycle typically forms when:
A massive demand increase arises from industrialization or technological transformation.
Supply takes years to catch up due to long project lead times, lack of investment, or logistic constraints.
Prices remain elevated for years, pushing producers to expand capacity.
The end of a supercycle occurs when new supply finally exceeds demand or global economic growth slows.
2. Historical Commodity Supercycles
Analysts typically recognize four major supercycles in the last 150 years:
1. The Late 1800s Industrialization Boom
Fueled by:
U.S. and European industrial expansion
Rapid railway development
Urbanization and manufacturing growth
This cycle saw rising demand for steel, coal, copper, and agricultural products.
2. Post-World War II Reconstruction (1940s–1960s)
Countries devastated by war needed enormous resources to rebuild:
Europe’s reconstruction under the Marshall Plan
Japan’s industrial revival
Oil, metals, and food commodities experienced long-term price strength.
3. The Oil Supercycle (1970s–1980s)
Triggered by:
OPEC oil embargo in 1973
Geopolitical conflicts in the Middle East
Oil prices surged, reshaping global energy markets and pushing investment into oil exploration.
4. The China-Driven Supercycle (2000–2014)
The most powerful modern supercycle was driven by:
China’s entry into the WTO
Massive infrastructure, manufacturing, and housing expansion
Urbanization of over 300 million people
Demand for iron ore, copper, aluminum, coal, and crude oil skyrocketed.
This cycle slowed around 2014 as China shifted from infrastructure-led growth to services and technology.
3. Why Supercycles Matter in Today’s Global Market
A. They Shape Global Inflation
High commodity prices raise:
Manufacturing costs
Transportation expenses
Food prices
This can create global inflation waves, affecting interest rates and monetary policy.
B. They Influence Currency Markets
Countries that export commodities (e.g., Australia, Brazil, Canada, Russia) see stronger currencies during supercycles. Import-dependent countries face currency pressure and trade deficits.
C. They Impact Corporate Profits and Investment
Industries like:
Mining
Energy
Infrastructure
Fertilizer and agriculture
experience earnings booms, leading to stock market rallies.
D. They Shift Geopolitical Power
Nations rich in resources gain strategic leverage. For example:
Middle Eastern countries influence global oil supply decisions
African countries become key suppliers of metals needed for modern technology
4. Drivers Behind Modern Resource Commodity Supercycles
A. Urbanization and Infrastructure Growth
Large emerging economies such as India, Indonesia, Vietnam, and African nations are expanding rapidly. This increases demand for:
Steel
Cement
Copper
Coal
Crude oil
B. The Green Energy Transition
A powerful emerging driver is the global push for clean energy. Technologies such as electric vehicles (EVs), solar power, wind turbines, and grid batteries require huge quantities of metals like:
Lithium
Nickel
Cobalt
Graphite
Rare earth elements
Copper
Copper alone is essential for wiring, EV motors, and renewable energy grids. Demand may double over the next 20 years, making it a central metal in the next supercycle.
C. Supply Constraints and Underinvestment
For nearly a decade after 2014, mining and oil companies faced:
Low prices
Investor pressure to reduce debt
Capital discipline
As a result:
New oil fields were not developed
Few mega-mines came online
Exploration budgets were cut
Thus, supply is tight just when demand is rising, feeding a potential supercycle.
D. Geopolitical Conflicts
Issues such as:
Russia–Ukraine war
U.S.–China trade tensions
Middle East conflicts
Shipping disruptions (Red Sea, Panama Canal)
increase risks and disrupt supply chains, pushing prices up.
E. Monetary and Fiscal Stimulus
Large government spending on infrastructure, clean energy, and defence increases demand for raw materials. Meanwhile, inflation reduces purchasing power and encourages investment in commodities as a hedge.
5. Types of Commodities Affected in a Supercycle
1. Energy Commodities
Crude oil
Natural gas
Coal
Demand rises with industrial growth, transportation, and manufacturing.
2. Metals
Base metals: copper, aluminum, nickel, zinc
Precious metals: gold, silver
Battery metals: lithium, cobalt, rare earths
Metals are central to construction, electronics, EVs, renewable energy, and defence.
3. Agricultural Commodities
Wheat
Corn
Soybeans
Sugar
Edible oils
Agri supercycles are triggered by population growth, climate disruptions, and biofuel demand.
4. Soft Commodities
Cotton
Coffee
Cocoa
They respond to supply shocks from weather, pests, and geopolitical disruptions.
6. Signs That a New Commodity Supercycle May Be Emerging
Economists and market analysts look at structural indicators, including:
A. Rising Long-Term Demand
India’s growth, rising consumption in Africa, and global electrification indicate sustained demand for metals and energy.
B. Years of Underinvestment in Extraction
Supply gaps in oil and metals show that companies need a decade to catch up, creating prolonged price pressures.
C. Green Technology Boom
EV adoption, solar and wind installations, and smart grids require unprecedented quantities of metals.
D. Geopolitical Realignments
Countries are seeking secure supply chains through:
“Friendshoring”
“Resource nationalism”
Strategic reserves
These moves can raise prices across the board.
E. Climate-Driven Agricultural Volatility
Extreme weather events increase uncertainty in food supply, potentially driving long-term price trends.
7. Impact of a Commodity Supercycle on Global Stakeholders
A. For Investors
A supercycle can create multi-year opportunities in:
Mining and metal stocks
Oil and gas companies
Renewable energy miners (lithium, REEs)
Agriculture and fertilizer companies
B. For Countries
Resource-rich countries benefit through higher export revenues and stronger currencies.
Import-dependent countries face inflation and trade deficits.
C. For Businesses
Costs rise for manufacturers, construction firms, and energy-intensive industries.
D. For Consumers
Inflation affects:
Fuel prices
Food costs
Housing and infrastructure prices
Conclusion
A resource commodity supercycle is a powerful force that reshapes global markets, economies, and investment landscapes. Driven by structural megatrends—urbanization, green energy transition, supply shortages, and geopolitical shifts—today’s global economy may be entering a new and long-lasting supercycle. Understanding its mechanics helps investors, policymakers, and businesses position themselves strategically for the next decade.
ETH was this correction a WXY- elliot wave tutorial nine 3 waveIts possible this is wave 4 and crypto is going to make a new ATH. theres no way for me to actually know this until after the fact. but it does look like this to me.
wave W is the main chart. to see the other legs see the notes
*** Elliott Wave: Quick Guide to W-X-Y (Double Three) Corrections
A W-X-Y is a complex corrective pattern in Elliott Wave Theory.
If your chart keeps printing choppy overlapping waves that refuse to trend/count cleanly, you’re probably looking at one of these.
- What W-X-Y Actually Is
A W-X-Y is simply:
W = 3 waves
X = 3 waves
Y = 3 waves
So the entire structure is:
*** 3 – 3 – 3 (total of nine internal waves which is 27 on a lower degree)
W and Y are corrective patterns (they can be zigzags or flats), and the X wave is a connecting correction—usually shallow, sideways, and time-wasting.
- What Each Leg Can Be
W:ABC or any corrective 3-wave structure
X: ABC pullback, often sideways
Y: ABC or another corrective structure
None of the legs are impulsive.
If you see a clean 1-2-3-4-5 impulse, it cannot be W, X, or Y.
- How to Recognize a W-X-Y
Corrections subdivide into threes, not fives
Price action is sloppy, overlapping, and often sideways
X wave is typically small relative to W or Y
Y often mirrors W in slope, depth, or duration
The whole thing looks like “two corrections glued together with an X in the middle”
- Where W-X-Y Appears
You’ll see W-X-Y commonly in:
B waves
Wave 4 corrections
The middle section of complex pullbacks
Crypto consolidations (extremely common)
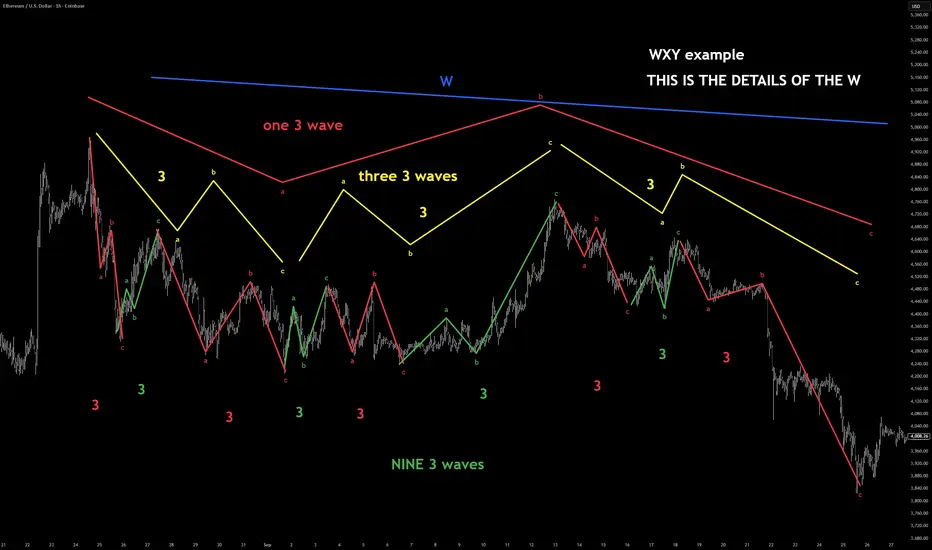
There are some setups for trades todayThis is Monday the 24th and I went through a number of markets including oil which I think is going higher and they went to some many contracts for traders who need less risk even though there's a little bit less reward.

Inverse Head and Shoulders PatternThe inverse head and shoulders pattern is a technical analysis tool used to signal a potential trend reversal from a downtrend to an uptrend.
The inverse head and shoulders pattern is characterized by three consecutive troughs, with the middle trough (head) being the lowest and the two outer troughs (shoulders) being higher and nearly equal. This formation indicates that the downtrend is nearing its end, and a reversal to an uptrend may occur soon. Identifying this pattern can provide traders with a valuable signal to enter a new long position or exit a bearish trade, making it an essential part of technical analysis.
The inverse head and shoulders pattern is the opposite of the head and shoulders pattern. Technical traders widely follow both formations due to their distinct shapes and clear signals as trend reversal patterns.
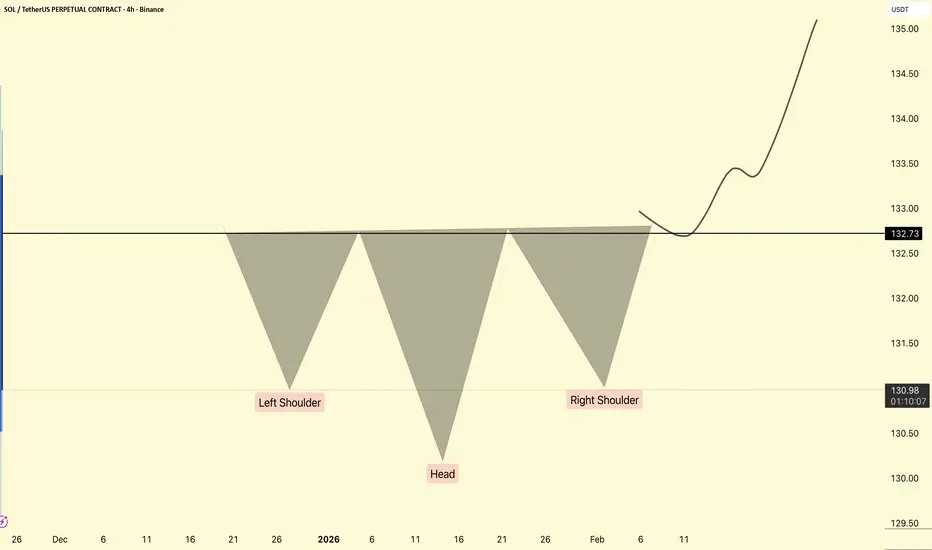
Crypto Walking the Edge: Will the Band Snap or Stretch Lower?Ether Futures (ETH) continue to tell a story of controlled pressure — one that traders have seen before across many markets, but rarely with this level of composure. The selling has been persistent, yet measured, and despite the depth of the decline, Ether has remained remarkably disciplined within its volatility structure. In short, price is walking the lower Bollinger Band — and doing it with intent.
The Market’s Controlled Descent
When an asset walks the lower Bollinger Band, it signals a market under steady directional momentum. The band represents volatility boundaries built around a moving average; hugging its lower edge reflects consistent downside force without capitulation. In Ether’s case, the message is clear — bears are in charge, but not panicking.
This pattern of orderly decline can be deceptive. It often convinces traders that “it can’t go lower” simply because volatility seems contained. Yet, in technical behavior, containment isn’t comfort — it’s momentum management. Until the market detaches from the band and closes above the midline, downside potential remains valid.
The Downside Magnet — UFO Support at 1883.0
Beneath the current price structure lies a level of particular interest: 1883.0. This is not just another number on the chart; it marks a UFO (UnFilled Orders) zone — an area where unexecuted buy orders from prior trading sessions may still be sitting.
Such levels often act as demand magnets. Price gravitates toward them as liquidity seeks to rebalance. If ETH continues its gradual descent, 1883.0 could act as a “final test” of demand strength. Traders currently short may view this area as a logical place to take profits or reduce exposure, while contrarian participants might monitor it for early signs of stabilization.
Walking the Edge — Bollinger Band Dynamics
The Bollinger Band is more than a volatility envelope; it’s a behavioral tool. Price hugging the lower band isn’t a reversal signal on its own. It shows persistent imbalance — sellers are comfortable pressing until they meet true counterflow demand.
The key observation isn’t where Ether trades, but how it interacts with the band:
If the band widens while Ether stays glued to its edge, volatility expansion favors continuation.
If the band narrows and Ether starts oscillating away from it, compression signals the potential for reversal.
At present, Ether remains on the outer lane — still walking the edge, with no confirmed volatility squeeze yet in play.
The Reversal Trigger — The Gap Between 2853.5–2769.0
Ether’s chart carries memory — and that memory is marked by the closure of a previously open gap between 2853.5 and 2769.0. Gaps represent unbalanced zones where the market skipped transactions, often leaving behind psychological resistance.
As long as ETH remains below 2769.0, bearish pressure dominates. A decisive close through the 2853.5 boundary would, however, suggest sellers have lost control. That event could flip the zone from resistance to support — the technical definition of a reversal confirmation.
Until that happens, Ether continues to operate in a bearish environment within its Bollinger framework, respecting lower boundaries and testing demand without capitulation.
The Upside Magnet — UFO Resistance at 3376.5
If the market does achieve a confirmed reversal through the gap zone, the next structural target stands near 3376.5. This region contains a UFO resistance cluster, where unfilled sell orders may wait to re-engage.
This becomes the “upside magnet” in the event of a bullish shift. Not as a forecast, but as a conditional marker — if price proves it can break through 2853.5, the 3376.5 zone becomes the next logical test for momentum sustainability.
Case Study: Risk Structure and Trade Framing
The beauty of futures markets lies in flexibility. Traders can define clear structural zones, build conditional scenarios, and design reward-to-risk ratios before any entry occurs. Ether’s chart currently offers two educational case studies:
Scenario 1 — Continuation Setup
If ETH continues trading below 2769.0, the bearish structure remains intact. Traders could study how price behaves as it approaches 1883.0 to understand profit-taking dynamics or potential trend exhaustion.
Scenario 2 — Reversal Setup
If ETH breaks and closes above 2853.5, the tone changes. It implies the market has absorbed overhead supply, opening the path toward 3376.5. In this case, risk would typically be defined below the reclaimed gap zone, maintaining a controlled risk ratio.
Whichever scenario unfolds, the discipline lies not in prediction but in preparation — in defining “if this, then that” logic.
Contract Specifications
To understand how traders express these views, it helps to revisit how Ether Futures work on CME.
Ether Futures (ETH)
Contract size: 50 Ether with a minimum tick: 0.25 per Ether = $25 per contract
Trading hours: Nearly 24 hours a day, Sunday to Friday, on CME Globex
Margin requirement: approximately $44,000 per contract (subject to changes)
For traders seeking smaller capital exposure, CME also lists Micro Ether Futures (MET) — 1/500th the size of the standard contract. This smaller format offers precision for testing setups, scaling positions, or managing margin during high volatility periods. Importantly, both ETH and MET track the same underlying price behavior, allowing consistent technical interpretation across sizes.
Managing Risk — Beyond Price Targets
Regardless of contract size, effective futures trading is a balance between conviction and constraint. Every trade requires three coordinates before execution:
Entry — based on objective price structure or confirmation.
Exit — determined by invalidation, not emotion.
Size — calibrated to volatility and margin.
A well-structured plan incorporates all three. For instance, a trader eyeing ETH’s move toward 1883.0 should define exit conditions before entry — not after volatility spikes. The same logic applies if Ether were to reclaim 2853.5 and aim higher; stop placement must be systematic, not spontaneous.
Ether Futures in Market Context
Ether’s futures market has become one of the clearest barometers of institutional sentiment in crypto. It reflects not retail enthusiasm but structured positioning, hedging, and liquidity management. The current price behavior — a slow, calculated descent — signals strategic repositioning rather than panic liquidation.
This distinction matters. Markets driven by liquidation collapse violently and rebound sharply. Markets driven by reallocation, like the current Ether environment, tend to evolve gradually — a series of tests, pauses, and measured reactions. Recognizing this tempo helps traders align their strategies with the rhythm of institutional order flow.
Summary — The Market Still Walking the Edge
Ether’s structure can be summarized in three key technical zones:
1883.0: Demand magnet and potential exhaustion level.
2853.5–2769.0: The gap resistance band — critical reversal gate.
3376.5: Major resistance cluster and next test if reversal unfolds.
As long as Ether remains below the gap zone, momentum remains under bearish control. If it trades through and holds above, a structural shift may begin. Until then, the market keeps “walking the edge” — respecting volatility, testing support, and waiting for conviction.
When charting futures, the data provided could be delayed. Traders working with the ticker symbols discussed in this idea may prefer to use CME Group real-time data plan on TradingView: www.tradingview.com - This consideration is particularly important for shorter-term traders, whereas it may be less critical for those focused on longer-term trading strategies.
General Disclaimer:
The trade ideas presented herein are solely for illustrative purposes forming a part of a case study intended to demonstrate key principles in risk management within the context of the specific market scenarios discussed. These ideas are not to be interpreted as investment recommendations or financial advice. They do not endorse or promote any specific trading strategies, financial products, or services. The information provided is based on data believed to be reliable; however, its accuracy or completeness cannot be guaranteed. Trading in financial markets involves risks, including the potential loss of principal. Each individual should conduct their own research and consult with professional financial advisors before making any investment decisions. The author or publisher of this content bears no responsibility for any actions taken based on the information provided or for any resultant financial or other losses.
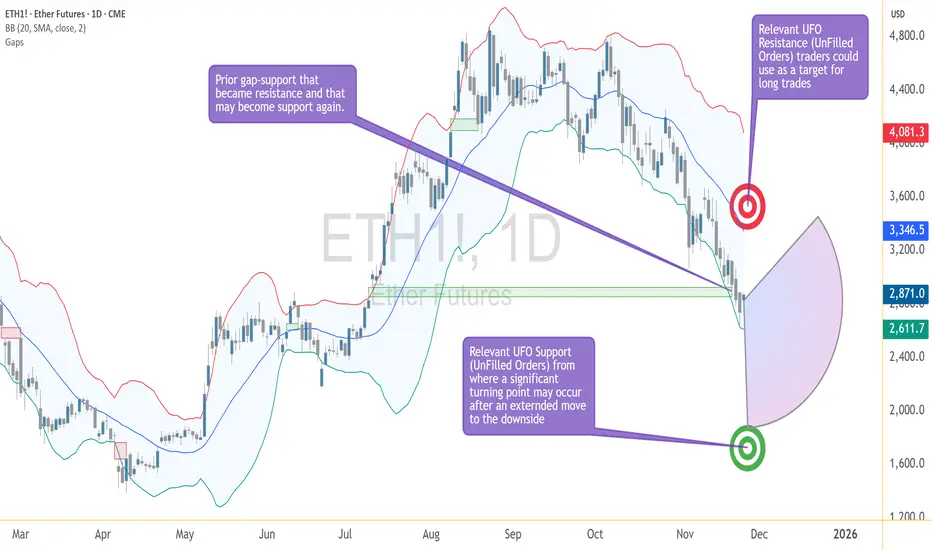
Fluctuation Effects on the Global Economy1. Understanding Economic Fluctuations
Economic fluctuations refer to irregular movements in economic indicators such as GDP, inflation, employment, interest rates, exchange rates, and asset prices. These fluctuations arise due to a mix of market forces and external shocks, including technological changes, policy decisions, global conflicts, pandemics, and shifts in consumer behavior.
In an interconnected globalized environment, even small disturbances in one region can create ripple effects worldwide. For example, a slowdown in China impacts commodity-exporting nations; a surge in U.S. interest rates affects emerging markets; fluctuations in crude oil prices influence inflation globally.
2. Currency Fluctuations and Their Global Impact
Currency fluctuations are among the most significant drivers of global economic stability or instability. When a currency strengthens or weakens sharply, it affects trade, investment flows, and economic confidence.
Effects of currency fluctuations:
a. Impact on trade competitiveness
A strong currency makes exports expensive and less competitive, while imports become cheaper. For example, if the U.S. dollar appreciates, American goods become costlier abroad, reducing demand. On the other hand, countries like India and China may benefit from increased export attractiveness when their currencies weaken.
b. Impact on inflation
When currencies depreciate, import costs rise—particularly for essential items like crude oil, machinery, and electronics. This triggers inflationary pressure. Countries dependent on imports face higher consumer prices due to currency volatility.
c. Impact on investment flows
Foreign investors seek stable and strong currencies. When a country experiences volatility, capital swiftly flows out (capital flight), causing market instability. This is often seen in emerging markets during global tightening cycles.
3. Interest Rate Fluctuations
Interest rate changes by central banks influence borrowing costs, saving behavior, consumption levels, and global capital flows.
a. Global spillover of U.S. Federal Reserve policies
Since the U.S. dollar is the world’s reserve currency, any interest rate hike by the U.S. Federal Reserve increases global borrowing costs. Emerging markets face pressure as investors withdraw funds to seek safer returns in the U.S.
b. Domestic impact
Higher interest rates slow economic activity by making loans expensive. Lower rates fuel borrowing and spending but may also create asset bubbles.
c. Impact on global debt
High global interest rates increase repayment burdens for countries with large external debt, especially developing nations. This may lead to financial instability or even sovereign debt crises.
4. Commodity Price Fluctuations
Commodity prices—especially oil, gas, metals, and agricultural products—play a vital role in shaping the global economic landscape.
a. Oil price fluctuations
Oil price volatility affects inflation, transportation costs, energy bills, and manufacturing. Oil-importing countries (like India, Japan, and many European nations) face rising fiscal pressure when oil prices surge. Conversely, oil-exporting economies (Saudi Arabia, Russia, Nigeria) benefit during periods of high prices but face deficits during downturns.
b. Impact on commodity-dependent economies
Countries like Brazil, Chile, and Australia depend heavily on iron ore, copper, and agricultural exports. Price fluctuations in these commodities directly affect GDP growth, employment, and government revenues.
c. Supply chain disruptions
Fluctuations in raw material prices disrupt global supply chains, increasing production costs for industries like automobiles, electronics, and construction.
5. Stock Market Fluctuations
Global stock markets reflect investor sentiment and economic expectations. Fluctuations in major indices such as the S&P 500, FTSE, Nikkei, and Sensex create global impact.
a. Wealth effect
When stock markets rise, household wealth increases, encouraging more spending. A crash leads to reduced consumption and lower economic activity.
b. Corporate investment
Volatile markets discourage companies from raising capital or expanding operations. This slows innovation and productivity growth.
c. Contagion effect
Due to global integration, a crash in one major market triggers panic worldwide. The 2008 financial crisis is a classic example where U.S. mortgage market instability led to a global recession.
6. Inflation and Deflation Fluctuations
Price fluctuations are crucial indicators of economic stability.
a. High inflation
High inflation erodes purchasing power and reduces real income levels. Businesses face higher production costs, reducing profitability. Central banks respond by raising interest rates, affecting global growth.
b. Deflation
Deflation causes weak demand, lower profits, and layoffs. Japan’s deflationary period demonstrated how prolonged price declines can stall economic growth for decades.
c. Global inflation shocks
Supply chain disruptions, geopolitical tensions, and crude oil price spikes can cause inflation globally, as seen during the post-pandemic period.
7. Geopolitical and Policy Fluctuations
Political instability, trade wars, sanctions, and regulatory changes directly affect global markets.
a. Trade war fluctuations
Tariff battles between major economies like the U.S. and China disrupt global supply chains and increase the cost of goods worldwide.
b. Sanctions and conflict
Geopolitical tensions—such as the Russia–Ukraine conflict—create energy shortages, disrupt trade routes, and trigger commodity price surges.
c. Policy unpredictability
Frequent changes in trade rules, taxation, or environmental regulations create uncertainty for businesses, discouraging investment.
8. Technology-Induced Fluctuations
Technological disruptions also create global economic fluctuations.
Automation impacts job markets and manufacturing costs.
Digital currencies and blockchain challenge traditional financial systems.
Rapid adoption of AI reshapes business models and productivity trends.
While technology boosts efficiency, sudden transitions can destabilize industries and labor markets.
9. Impact on Global Trade and Supply Chains
Global supply chains are particularly sensitive to fluctuations.
a. Disruptions reduce production
Events like pandemics, port closures, war, or climate disasters delay shipping times and reduce inventory availability.
b. Rising logistics costs
Fluctuations in freight rates, fuel prices, and shipping routes increase production costs globally.
c. Shift toward localization
Companies are increasingly diversifying supply chains (China+1 strategy) to manage risk.
10. Social and Employment Effects
Economic fluctuations influence employment patterns and income levels.
During downturns, layoffs increase, reducing household consumption.
Wage stagnation becomes common during deflationary phases.
Social inequality widens as lower-income groups suffer more during volatility.
Governments must balance growth with welfare support to maintain social stability.
Conclusion
Fluctuations are inherent to the global economic system. As markets, nations, and industries become more interconnected, even minor shocks can create significant global ripple effects. Currency volatility, interest rate changes, commodity price swings, and geopolitical developments all shape the world economy’s performance.
Managing these fluctuations requires stronger global cooperation, sound monetary policies, diversified supply chains, and robust risk-management strategies. While fluctuations can create uncertainty and risk, they also present opportunities for adaptation, innovation, and long-term economic resilience.
