Scalping in the World Market1. Understanding Scalping
Scalping is a short-term trading strategy that focuses on exploiting tiny price gaps created by order flows, liquidity imbalances, or temporary market inefficiencies. Unlike swing traders or investors who hold positions for days, weeks, or months, scalpers hold positions for seconds to minutes. The key principle behind scalping is that smaller price movements occur more frequently than larger ones, offering more trading opportunities.
In global markets—such as forex, commodities, equities, and indices—scalpers rely on high liquidity and tight spreads to enter and exit positions quickly. They typically use leverage to magnify gains, as the profit per trade is minimal.
2. Core Principles of Scalping
Scalping operates on several fundamental principles:
Speed: Since market prices can change within milliseconds, speed in execution is essential. Scalpers use advanced trading platforms, direct market access (DMA), and low-latency connections.
Volume: Scalpers make many small trades daily. Each trade might aim for profits as low as 0.05%–0.3%, but hundreds of trades can compound into meaningful returns.
Liquidity: High liquidity ensures that scalpers can enter and exit positions without significant slippage. Major currency pairs like EUR/USD or large-cap stocks like Apple, Microsoft, or Tesla are popular among scalpers.
Risk Control: Because profits per trade are small, losses must be minimized. Scalpers often set tight stop-losses and focus on maintaining a high win rate (above 70%).
3. Types of Scalping Strategies
There are multiple approaches to scalping in the world market, each tailored to different instruments and trader preferences:
a. Market-Making Scalping
Traders act as market makers, placing both buy and sell limit orders around the current price. They profit from the bid-ask spread if both orders are filled. This method requires deep understanding of order book dynamics and access to direct liquidity pools.
b. Momentum Scalping
This strategy relies on identifying short-term trends and trading in the direction of momentum. Scalpers jump into trades when a breakout occurs and exit as soon as momentum slows. It is common in volatile assets like cryptocurrencies and tech stocks.
c. Range Scalping
Scalpers exploit sideways market movements by repeatedly buying at support and selling at resistance. This works well in stable, low-volatility sessions when prices oscillate within a predictable band.
d. News-Based Scalping
Scalpers react to breaking news, such as economic data releases or earnings announcements. Fast reactions to volatility spikes can yield quick profits—but require excellent reflexes and execution systems.
e. Algorithmic Scalping
Automated systems or trading bots are programmed to execute thousands of micro-trades per second based on pre-set parameters. Algorithmic scalping dominates modern global markets due to its speed and efficiency.
4. Scalping Across Global Markets
Scalping takes different forms depending on the market environment and asset class:
a. Forex Market
The foreign exchange market is ideal for scalping due to 24-hour trading, high liquidity, and minimal transaction costs. Popular pairs include EUR/USD, GBP/USD, and USD/JPY. Forex scalpers rely heavily on technical indicators like moving averages, Bollinger Bands, and RSI to time entries and exits.
b. Stock Market
In equity markets, scalping focuses on high-volume, blue-chip stocks. Traders monitor order books, market depth, and volume patterns. Scalpers often use Level II quotes to anticipate short-term price changes.
c. Commodities and Futures
Gold, crude oil, and index futures are popular instruments for scalping because they offer high liquidity and continuous price movement. Traders use tick charts and DOM (Depth of Market) data to detect micro-trends.
d. Cryptocurrency Market
The 24/7 nature and volatility of crypto markets make them attractive for scalping. Bitcoin (BTC), Ethereum (ETH), and Solana (SOL) often move several percent daily, offering frequent micro opportunities. However, spreads and fees can be higher compared to forex.
5. Tools and Techniques Used in Scalping
Successful scalpers rely on advanced tools and precise analysis:
Charting Software: Real-time charting with one-minute, tick, or volume-based time frames.
Indicators: Moving Average Convergence Divergence (MACD), Relative Strength Index (RSI), VWAP (Volume Weighted Average Price), and Stochastic Oscillator.
Order Flow Analysis: Observing the order book, time and sales data, and bid-ask imbalances to anticipate short-term direction.
Hotkeys and Automation: Speedy order entry and exits are crucial, often executed using hotkeys or algorithmic scripts.
Broker and Platform: Low-latency brokers with ECN (Electronic Communication Network) access and minimal spreads are preferred.
6. Advantages of Scalping
Frequent Opportunities: Since prices fluctuate constantly, there are continuous trading chances.
Limited Exposure: Positions are held briefly, reducing exposure to large market swings or news shocks.
Compounding Gains: Small consistent profits accumulate over time, building meaningful returns.
Adaptability: Scalping strategies can be applied to multiple asset classes globally.
7. Disadvantages and Risks of Scalping
Despite its appeal, scalping is challenging and not suitable for every trader:
High Transaction Costs: Frequent trades lead to higher commissions and fees that can erode profits.
Stress and Concentration: The need for quick decisions and constant monitoring can be mentally exhausting.
Execution Slippage: Delays in order execution can turn profitable trades into losses.
Broker Restrictions: Some brokers discourage or prohibit scalping due to the high server load and short holding times.
Small Margin of Error: One large loss can wipe out profits from dozens of successful trades.
8. Psychology of a Scalper
Scalping demands a specific mindset. Scalpers must remain calm, disciplined, and unemotional even under intense market pressure. They focus on process over outcome, knowing that statistical consistency matters more than any single trade. Impulsiveness or revenge trading can quickly destroy a scalper’s capital.
Good scalpers often have backgrounds in mathematics, data analysis, or programming, allowing them to develop or optimize trading systems that enhance precision and risk control.
9. Risk Management in Scalping
Effective risk management is crucial. Typical techniques include:
Tight Stop-Loss Orders: To prevent large drawdowns, stops are set just a few ticks away.
Position Sizing: Scalpers limit exposure per trade to a small portion of their capital.
Daily Loss Limits: Many professionals stop trading after hitting a predefined loss cap.
Avoiding Overtrading: Not every price movement is an opportunity; discipline is key.
10. The Future of Scalping in the Global Market
As global markets become increasingly digitalized, scalping is evolving rapidly. The rise of high-frequency trading (HFT), AI-driven algorithms, and machine learning models has made manual scalping less dominant but still viable for specialized traders.
Technological advances such as low-latency networks, colocation near exchange servers, and quantitative analysis tools give professional scalpers a competitive edge. However, regulators worldwide are introducing tighter rules to ensure market fairness, which affects the way scalping is conducted—especially in equity and futures markets.
Conclusion
Scalping plays a vital role in the global financial ecosystem by enhancing liquidity, narrowing spreads, and maintaining market efficiency. It attracts traders who thrive on speed, precision, and discipline. While it offers the potential for consistent profit, it demands exceptional skill, emotional control, and access to cutting-edge technology.
In essence, scalping is not just about quick profits—it is a test of reflexes, discipline, and strategy in a world where milliseconds can determine success or failure. As automation and AI reshape global trading, scalping continues to be both an art and a science, symbolizing the ultimate pursuit of efficiency in the financial markets.
Chart Patterns

The Role of the Metals Market in Global Trade1. Historical Background and Evolution of the Metals Market
Metals have played a pivotal role in the evolution of human societies. Ancient civilizations like Egypt, Mesopotamia, and the Indus Valley used copper, bronze, and gold for tools, ornaments, and trade. The discovery of iron marked the beginning of the Iron Age, revolutionizing warfare, agriculture, and construction. As maritime trade expanded during the Renaissance, gold and silver became the foundation of global commerce, with countries competing for control over mineral-rich territories.
The Industrial Revolution in the 18th and 19th centuries marked a turning point. The demand for coal, iron, and later steel surged as nations built railways, ships, and factories. This era established metals as a driving force behind industrial power. In the 20th century, aluminum, copper, and nickel became essential for the automotive, electrical, and aerospace industries. Today, the digital revolution and green transition have added new dimensions to the metals trade, with lithium, cobalt, and rare earth elements at the forefront.
2. Classification of Metals in Global Trade
Metals can broadly be classified into precious metals, base metals, and ferrous metals:
Precious metals such as gold, silver, and platinum are valued for their rarity, monetary use, and investment appeal. They often act as safe-haven assets during economic uncertainty.
Base metals like copper, aluminum, zinc, and nickel are essential industrial inputs used in construction, manufacturing, and electronics.
Ferrous metals, primarily iron and steel, form the backbone of global infrastructure, machinery, and transportation.
Each category plays a distinct role in trade flows and economic development, influencing everything from industrial output to currency stability.
3. Key Players in the Global Metals Market
The global metals trade is dominated by a few major producers and consumers:
China is the largest consumer and producer of most base metals, particularly steel and aluminum. Its rapid industrialization has made it a major influencer of global metal prices.
Australia, Brazil, and Chile are leading exporters of iron ore, copper, and other minerals, contributing significantly to global supply.
The United States, Russia, and Canada play key roles in producing precious metals and industrial metals like nickel and palladium.
Africa, particularly countries like South Africa and the Democratic Republic of Congo (DRC), is rich in gold, platinum, and cobalt resources.
These nations’ trade relationships often reflect their comparative advantages in metal production and processing, forming the foundation for global supply chains.
4. Metals as Strategic and Economic Assets
Metals are not just industrial materials—they are strategic assets that influence national security and economic resilience. Nations stockpile metals like copper, nickel, and rare earth elements to secure industrial supply chains and mitigate geopolitical risks. For example:
Rare earth metals are crucial for producing high-tech devices, defense equipment, and renewable energy systems. China’s dominance in this sector gives it significant geopolitical leverage.
Oil-to-metal transitions, driven by green energy goals, have increased the demand for metals like lithium and cobalt used in electric vehicle (EV) batteries and renewable technologies.
Consequently, control over metal reserves has become a modern form of strategic power, shaping trade alliances and economic policies.
5. Pricing and Market Dynamics
Metal prices are determined by supply-demand fundamentals, economic cycles, and speculative activities. Major commodities exchanges like the London Metal Exchange (LME), Chicago Mercantile Exchange (CME), and Shanghai Futures Exchange (SHFE) facilitate global pricing and hedging.
Factors influencing metal prices include:
Economic growth: Rising industrial activity boosts metal demand and prices.
Technological innovation: New manufacturing technologies alter consumption patterns (e.g., lightweight aluminum replacing steel).
Geopolitical tensions: Trade restrictions or sanctions can disrupt supply chains.
Environmental policies: Carbon regulations and sustainability goals affect mining and production costs.
Investment flows: Metals also serve as speculative assets, influenced by currency strength, inflation, and interest rates.
Thus, metal prices often act as economic indicators, reflecting global industrial health and investor sentiment.
6. The Role of Metals in Industrialization and Infrastructure Development
Metals are indispensable to industrialization. Steel underpins infrastructure — bridges, railways, and skyscrapers — while copper powers electrical networks and communication systems. Aluminum enables lightweight transportation and aerospace manufacturing, and nickel and cobalt are key in renewable energy storage.
Developing economies rely heavily on metal imports to build infrastructure and manufacturing capacity. For instance, India’s expanding urbanization and infrastructure development drive strong demand for iron and aluminum. Conversely, developed economies export technology and capital to resource-rich nations in exchange for raw materials, fostering interdependence in global trade.
7. Environmental and Sustainability Challenges
Mining and metal production are energy-intensive processes that contribute significantly to carbon emissions and ecological degradation. The global push toward sustainability has forced the metals industry to adopt cleaner technologies and recycling practices.
Recycling metals reduces energy consumption by up to 95% compared to primary production.
Circular economy models are being promoted to minimize waste and maximize resource efficiency.
ESG (Environmental, Social, and Governance) frameworks now influence investment in mining and metal companies, driving greener operations.
Additionally, the transition to renewable energy and electric vehicles has paradoxically increased demand for certain metals like lithium and copper, creating new sustainability dilemmas related to mining practices.
8. Trade Policies and Market Regulation
Governments play a crucial role in shaping metal trade through tariffs, export restrictions, and subsidies. For example:
The U.S.–China trade tensions have led to tariffs on aluminum and steel.
Indonesia has imposed export bans on nickel ore to encourage domestic processing.
The European Union’s Carbon Border Adjustment Mechanism (CBAM) aims to penalize imports of carbon-intensive metals, pushing producers toward cleaner production.
These policies influence global trade patterns, encouraging nations to diversify sources and invest in local refining capacities.
9. The Future of the Global Metals Market
The metals market is undergoing a structural transformation. The shift toward green technologies, digitalization, and geopolitical realignments will reshape global demand and supply chains.
Key trends include:
Rising demand for battery metals (lithium, cobalt, nickel) due to electric vehicle growth.
Technological advances in mining, such as automation and AI, enhancing efficiency.
Increased recycling and circular economy initiatives.
Geopolitical competition over strategic metals, especially between the U.S., China, and the EU.
Digital metal trading platforms improving transparency and liquidity.
These developments indicate that the future metals market will be more sustainable, technologically advanced, and geopolitically complex.
10. Conclusion
The metals market remains a cornerstone of global trade, connecting economies through resource flows and industrial demand. Metals shape not only the physical world—through construction, manufacturing, and technology—but also the geopolitical and economic landscape. As nations strive for cleaner growth, technological advancement, and strategic security, metals will continue to hold immense importance. From traditional iron and copper to modern lithium and rare earths, metals are the silent engines driving the global economy forward. Their trade will increasingly define the balance between growth, sustainability, and geopolitical influence in the 21st century.

ESG Investing and Sustainable Finance1. Understanding ESG Investing
ESG stands for Environmental, Social, and Governance — the three key pillars used to evaluate the sustainability and ethical impact of an investment.
Environmental (E):
This pillar examines how a company manages its environmental responsibilities. Factors include carbon emissions, energy efficiency, waste management, pollution control, renewable energy use, and climate change mitigation strategies.
Example: Companies that reduce greenhouse gas emissions or invest in renewable energy are seen as environmentally responsible.
Importance: Investors assess environmental performance to gauge how well a company can manage climate-related risks and comply with emerging environmental regulations.
Social (S):
This component focuses on how a company interacts with people — employees, customers, suppliers, and communities. It includes labor practices, employee welfare, diversity and inclusion, human rights, product safety, and community engagement.
Example: Firms that promote gender equality, maintain fair wages, or engage in ethical supply chains demonstrate strong social values.
Importance: Socially responsible companies tend to attract loyal customers, maintain a motivated workforce, and avoid reputational risks.
Governance (G):
Governance deals with corporate leadership, internal controls, and shareholder rights. It assesses board diversity, executive pay, ethical business conduct, transparency, and anti-corruption policies.
Example: Companies with independent boards, fair executive compensation, and transparent reporting systems score high in governance.
Importance: Good governance reduces the likelihood of fraud, mismanagement, and unethical behavior — ensuring long-term stability.
In ESG investing, these three dimensions help investors identify organizations that are not only financially sound but also sustainable and ethical in their operations.
2. The Rise of ESG Investing
ESG investing has evolved from a niche concept to a global mainstream movement. Several factors have contributed to this shift:
Investor Awareness:
Modern investors, particularly millennials and Gen Z, are increasingly motivated by values. They prefer to invest in companies that align with their ethical and environmental beliefs.
Regulatory Push:
Governments and international bodies are promoting ESG standards. For example, the European Union introduced the Sustainable Finance Disclosure Regulation (SFDR), and India’s Business Responsibility and Sustainability Report (BRSR) mandates ESG disclosures for top-listed companies.
Corporate Accountability:
Global corporations are under growing pressure to adopt ESG frameworks, not only to attract investors but also to secure long-term sustainability and brand credibility.
Risk Management:
ESG factors are now recognized as essential to identifying long-term risks such as environmental disasters, regulatory changes, or social unrest that could affect business performance.
According to data from the Global Sustainable Investment Alliance (GSIA), ESG-related investments surpassed $35 trillion globally by 2023, representing about one-third of all professionally managed assets.
3. The Concept of Sustainable Finance
While ESG investing focuses on evaluating company performance using sustainability metrics, sustainable finance refers to the broader financial system that supports sustainable development.
Sustainable finance integrates environmental, social, and governance considerations into all aspects of financial decision-making — including banking, insurance, and capital markets. It aims to channel capital toward projects and companies that contribute positively to society and the planet.
Key components of sustainable finance include:
Green Finance:
This focuses on funding environmentally friendly projects — such as renewable energy, energy-efficient infrastructure, sustainable agriculture, or water conservation.
Example: Green bonds are debt instruments used to finance environmental projects.
Social Finance:
This supports initiatives that improve social well-being — such as affordable housing, education, healthcare, or employment generation.
Climate Finance:
A subcategory of sustainable finance, it targets investments that mitigate or adapt to climate change. This includes funding clean technologies and climate-resilient infrastructure.
Impact Investing:
This approach seeks measurable positive social and environmental outcomes alongside financial returns. Investors directly fund projects or enterprises that deliver tangible societal benefits.
4. Interconnection Between ESG Investing and Sustainable Finance
ESG investing is a subset of sustainable finance. While ESG focuses on assessing companies through sustainability metrics, sustainable finance provides the financial infrastructure — such as green bonds, sustainability-linked loans, and climate funds — to support those ESG-driven companies and initiatives.
In other words:
ESG provides the criteria for evaluation.
Sustainable finance provides the capital for transformation.
Together, they form a comprehensive ecosystem where financial decisions contribute to a greener, fairer, and more transparent global economy.
5. Benefits of ESG Investing and Sustainable Finance
Long-Term Value Creation:
ESG-aligned companies tend to perform better in the long run due to better risk management, innovation, and adaptability.
Lower Risk Exposure:
Firms adhering to ESG standards are less likely to face regulatory fines, lawsuits, or reputational damage.
Improved Access to Capital:
Sustainable companies attract more investors, as many institutional funds now mandate ESG compliance.
Enhanced Reputation and Brand Loyalty:
Consumers increasingly support ethical and eco-conscious brands, boosting market share.
Positive Societal Impact:
Capital is directed toward solving global issues like climate change, poverty, and inequality, leading to inclusive growth.
6. Challenges in ESG and Sustainable Finance
Despite its growth, ESG investing faces several obstacles:
Lack of Standardization:
Different rating agencies use varying ESG criteria, leading to inconsistent evaluations of the same company.
Greenwashing:
Some companies falsely claim to be sustainable to attract investors — a practice known as “greenwashing.”
Data Limitations:
Reliable and comparable ESG data is scarce, especially in emerging markets.
Short-Term Market Pressures:
Investors often prioritize quarterly profits over long-term sustainability goals.
High Implementation Costs:
Transitioning to sustainable practices can be expensive, particularly for small and medium enterprises (SMEs).
7. Global and Indian Perspective
Globally, regions like Europe and North America lead in ESG adoption, with institutional investors such as BlackRock and Vanguard emphasizing sustainability mandates. The United Nations Principles for Responsible Investment (UN PRI) and the Paris Agreement have further driven ESG integration into the financial system.
In India, ESG and sustainable finance are gaining momentum:
SEBI (Securities and Exchange Board of India) has made ESG reporting mandatory for the top 1,000 listed companies under the BRSR framework.
The Reserve Bank of India (RBI) has initiated policies supporting green and social financing.
Indian banks like SBI and HDFC are issuing green bonds to finance renewable energy and social projects.
This marks a clear shift in India’s investment culture — aligning financial growth with sustainability.
8. The Future of ESG and Sustainable Finance
The future of finance lies in sustainability-driven innovation. Artificial intelligence, big data, and blockchain are being used to enhance ESG data transparency and traceability. Governments are introducing carbon pricing, taxonomy regulations, and sustainability-linked incentives to encourage responsible investing.
As climate risks and social inequalities intensify, ESG and sustainable finance will continue to evolve — not as alternatives but as the new standard of global financial practice.
Conclusion
ESG investing and sustainable finance represent more than just financial trends — they are part of a paradigm shift in how societies view growth and prosperity. They align economic success with social well-being and environmental preservation. By integrating sustainability into financial systems, investors and institutions are not only securing returns but also shaping a resilient, equitable, and sustainable future for generations to come.
In essence, profit and purpose are no longer opposites — they are partners in the global mission toward sustainable development.

Fractal Dimension VisualizedThere are plenty of times where fractals are mentioned across TA, from indicators like FRAMA, Williams Fractals, concepts like Elliott waves - all the way to my own way of breaking cycles through Fibonacci Channels. Pretty much most of them are about self-similar behavior of the market which is often invisible to unweponized eye.
In this piece I’m going to the core - fractal dimension . Don’t fixate on numbers! Instead, visualize the scaling process: how structures fills space as you zoom in and out.
Regular Dimensions
The most fundamental question is: How many copies (N) do we get with each magnification (R).
Line (1D): A line has only one length. If I magnify length by a factor R, the number of smaller copies that fit is N=R. (Double the length → 2 copies; in general N = R^1.)
Square (2D): Magnify side length by R: the big square splits into a grid of R x R old squares, so N=R^2.
Cube (3D): Magnify edge length by R: the big cube contains R x R x R small cubes, so N=R^3.
So in D dimensions, when you scale length by R, the count of self-similar copies is N = R^D
Hence, we can extract dimension: D = log N / log R
This is the similarity dimension formula when the object breaks into N exact copies, each scaled by 1/R in length.
Application to Fractals
Sierpinski Triangle
We actually start with a solid 2D equilateral triangle. Then we remove the central upside-down triangle to leave three smaller solid triangles. Now we repeat that step inside every remaining triangle, forever. As this process continues, any patch of solid area that survives will eventually be removed, so the total area shrinks toward zero while the number of pieces explodes. The limit is the Sierpiński triangle: not “just lines,” but a fractal set with no area and a non-integer dimension between 1 and 2
At each step you get N=3 copies, each scaled by 1/2 (so R=2).
D = log 3 / log 2 = 1.5850
How to work out D in practice
Identify the scaling length: by what factor R must you magnify so the large figure looks like a collage of smaller identical copies?
Count those copies N.
Plug into D = log N / log R.
This is highly important for perceiving scaling laws not just for self-similar shapes but also other patterns.
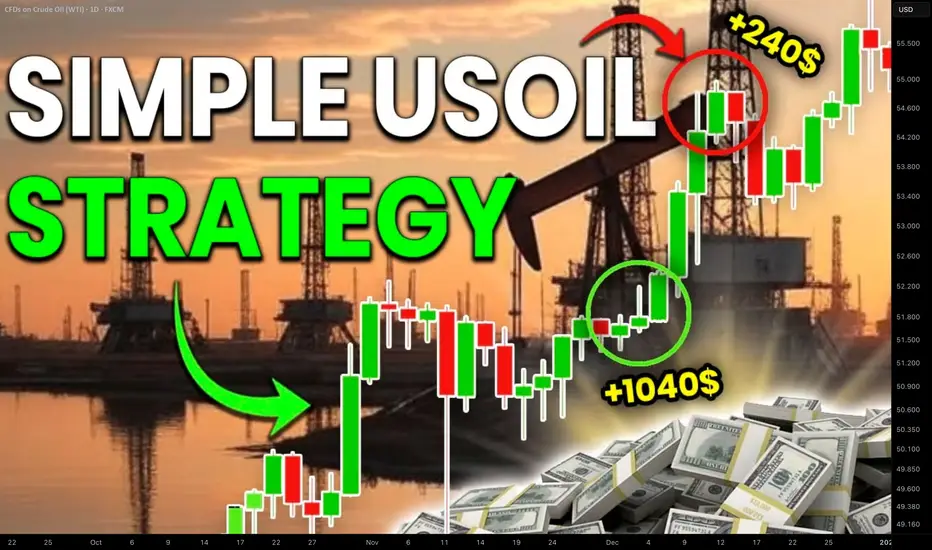
How to Trade Crude Oil with Smart Money Concepts SMC Explained
Smart Money Concepts is one of the most reliable techniques for trading WTI Crude Oil.
In this article, I will teach you a profitable SMC strategy for analysing and trading USOIL futures and CFD.
This simple strategy is based on an important event every SMC trader should know - a break of structure BoS.
In a bullish trend, the best break of structure will be based on a violation and a candle close above a current higher high.
It will signify a highly probable bullish continuation and provides a great opportunity to buy
Though you can spot a bullish break of structure on any time frame, the most reliable one is a daily.
After a formation of a new high, I suggest waiting for a short term intraday correctional movement.
With a high probability, the market will retest a recently broken structure and smart money will manipulate the market, pushing the price below that, making buyers close their positions.
Once the market starts retracing, analyze an hourly time frame. The price will need to establish an i ntraday minor bearish trend.
In this bearish trend, 2 trend lines should connect lower highs and lower lows composing an expanding, parallel or contracting channel - a bullish flag pattern.
Your best signal will be a breakout of a resistance line of the flag and a violation of the level of the last lower high - a bullish change of character of a liquidity grab.
It will confirm a completion of a correction.
Buy the market on a retest of the level of the last higher low, it will be your best entry.
Set your stop loss at least below a trend line and aim at the next strong daily resistance.
That will be a perfect model for trading break of structure on WTI Crude Oil.
We spotted such a setup in my trading academy on one of the live streams with my students.
WTI Crude Oil was trading in an uptrend on a daily time frame.
A bullish violation of the last Higher High and a candle close above that confirmed a Break of Structure BoS.
The price started a correctional movement then, and we spotted a bullish flag pattern on an hourly time frame.
The market completed a correction after grabbing a liquidity below a broken structure.
A bullish movement started then, and the price violated a resistance line of the flag and the level of the last lower high.
These 2 breakouts confirmed a completion of a correction and a resumption of a bullish trend.
We opened a buy position immediately on a retest of a broken level of the last lower high.
Stop loss was below a trend line, take profit was based on the closest key daily resistance.
And the price went straight to the target.
Break of Structure BoS will be useful for analysis, forecasting and trading WTI Crude Oil.
Combining that with top-down analysis and lower time frames confirmations will provide accurate signals and profitable trading setups.
Integrate a price model that I shared in your strategy, and good luck to you trading USOIL!
❤️Please, support my work with like, thank you!❤️
I am part of Trade Nation's Influencer program and receive a monthly fee for using their TradingView charts in my analysis.
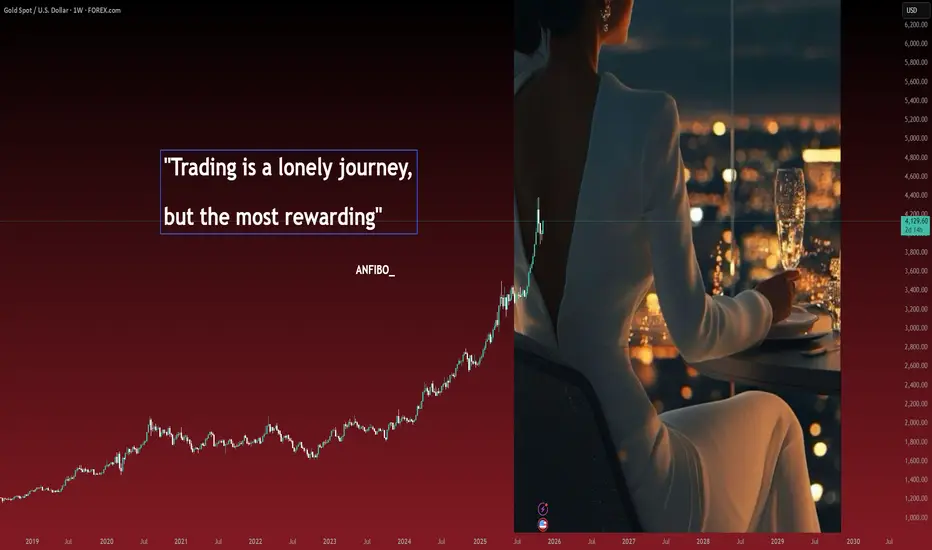
"Trading is a lonely journey, but the most rewarding""Trading is a lonely journey."
I had heard that saying a long time ago, but only when I stepped onto this path did I truly understand what it meant. On the first day I placed a trade, I thought everything was simple , just a few clicks, a few flickering green and red numbers, and I could make money. But the deeper I went, the more I realized that behind the screen was a cold, silent world where I was the only one facing myself.
No one understands the feeling of watching your account evaporate in just a few seconds. Nor can anyone share the tiny joy of a winning trade, because most outsiders only see the results — not the sleepless nights, not the heartbeats racing with every moving candle. Gradually, I learned to stay quiet : no more bragging about profits, no more complaining about losses. Trading taught me that emotions are the cruelest enemy.
There are days I stare at the chart until my eyes ache, my head spinning from those merciless price waves. I ask myself, “Am I really going in the right direction? Is trading even meant for me?” But then, in silence, I open my laptop again - analyze, take notes, place orders, as if it’s a habit I can’t let go of. Every loss hurts, but it also makes me stronger . I’ve learned to accept being wrong, to be disciplined, and to live with loneliness.
Trading isn’t just a battle with the market, it’s a battle with your own ego . It’s lonely, yes, but not meaningless. In that silence, I can hear my own thoughts more clearly ,my limits, and my desire to rise beyond them. Maybe only those who have walked this path can truly understand: behind every click lies countless emotions, unseen scars that only traders carry.
Trading is a lonely journey — but it’s also one of the most valuable journeys of all.
Try harder my friend! ;)
ANFIBO_
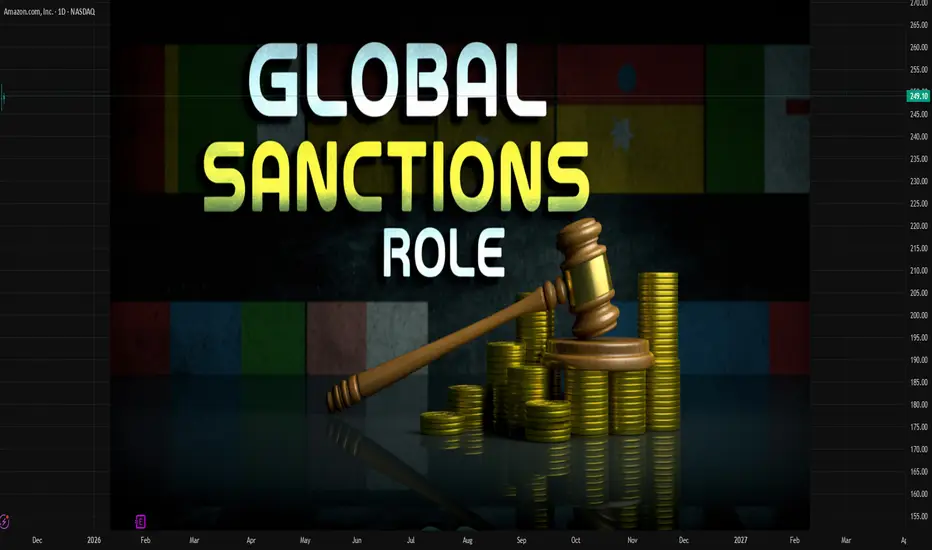
Sanctions and Their Role in the Global Market1. Understanding Sanctions
Sanctions are restrictions placed by one country or a group of countries on another nation or entity to enforce international laws or influence political or economic decisions. They are often used as alternatives to military intervention, serving as diplomatic or economic pressure tools. Sanctions can be applied for various reasons — to punish aggression, prevent nuclear proliferation, counter terrorism, or respond to human rights violations.
The key players in imposing sanctions are major economic and political blocs such as the United Nations (UN), the European Union (EU), and powerful individual nations like the United States. The U.S., for instance, uses the Office of Foreign Assets Control (OFAC) to design and enforce sanctions globally.
2. Types of Sanctions
Sanctions come in several forms, each targeting different aspects of an economy or government operation. The most common types include:
Economic Sanctions:
These restrict trade and financial transactions. Examples include import and export bans, restrictions on investments, or freezing of assets. Economic sanctions are intended to weaken a nation’s economic stability.
Trade Sanctions:
Trade restrictions can prevent the export of critical goods like oil, technology, or weapons. For instance, sanctions on Iran’s oil exports have significantly limited its main source of revenue.
Financial Sanctions:
These target banking systems, financial institutions, and access to international payment systems like SWIFT. Russia, for example, faced severe financial isolation after its 2022 invasion of Ukraine.
Travel and Visa Sanctions:
These restrict the movement of political leaders, business executives, or individuals associated with illicit activities.
Military Sanctions:
These include arms embargoes that prevent the sale or supply of weapons and military technology.
Sectoral Sanctions:
These are targeted at specific sectors, such as defense, energy, or finance, to maximize economic pressure while minimizing collateral damage.
3. Objectives of Sanctions
The main goal of sanctions is to influence the behavior of governments or organizations without direct conflict. Their objectives include:
Deterring Aggression:
Sanctions can discourage military invasions or aggressive policies by raising the economic costs of conflict.
Promoting Human Rights:
Countries imposing sanctions often aim to pressure regimes accused of human rights abuses to change their policies or release political prisoners.
Preventing Nuclear Proliferation:
Sanctions against nations like North Korea and Iran are designed to stop the development of nuclear weapons programs.
Countering Terrorism:
Sanctions can block financial channels and assets used by terrorist groups.
Maintaining Global Stability:
Sanctions can be part of a coordinated global response to maintain international peace and uphold the rules-based order.
4. Mechanisms and Enforcement
Sanctions are typically implemented through laws, executive orders, or international agreements. Enforcement mechanisms include:
Asset Freezes: Preventing access to money or property held in foreign accounts.
Export Controls: Blocking the sale of critical goods, technology, or services.
Financial Restrictions: Limiting a country's access to international capital markets or payment systems.
Secondary Sanctions: Penalizing third-party countries or companies that do business with the sanctioned nation.
Monitoring compliance is crucial. Organizations such as the Financial Action Task Force (FATF) help track illegal financial activities and ensure that sanctions are effectively enforced.
5. Impact on the Global Market
The effects of sanctions ripple through the global economy, influencing trade balances, currency values, and market confidence. The impact varies based on the size and integration of the targeted country into the global market.
a. Trade and Supply Chains
Sanctions often disrupt global supply chains. For instance, sanctions on Russia and Iran have affected oil and gas supplies, driving up energy prices worldwide. Similarly, export restrictions on high-tech goods to China have reshaped global semiconductor and electronics markets.
b. Energy Markets
Energy is one of the most affected sectors. Russia’s sanctions after the Ukraine conflict caused global oil and gas price surges, forcing Europe to seek alternative energy suppliers. The Organization of the Petroleum Exporting Countries (OPEC) also faces indirect pressure when sanctions alter global energy supply and demand dynamics.
c. Financial Markets
Financial sanctions can restrict global capital flow. When large economies face sanctions, investors often move funds to safer markets, affecting currency exchange rates and global liquidity. For example, the freezing of Russian foreign reserves shook confidence in the global financial system and led to a rethinking of foreign reserve management by other nations.
d. Currency and Inflation
Countries under sanctions often experience currency depreciation due to restricted foreign investment and reduced exports. This leads to inflation and reduced purchasing power. Conversely, global markets can see inflation spikes when critical exports like oil or metals are restricted.
e. Global Business and Investment
Multinational corporations often have to withdraw from sanctioned regions to avoid penalties. For example, Western companies left Russia in 2022, leading to billions in losses. At the same time, other countries—like China, India, and Turkey—sometimes step in to fill trade gaps, reshaping global business networks.
6. Winners and Losers of Sanctions
Sanctions do not impact all players equally.
Losers:
The sanctioned nation’s economy typically suffers severe downturns—loss of exports, unemployment, and financial isolation. Ordinary citizens bear the brunt of inflation and shortages.
Winners:
Competing countries may benefit by capturing markets vacated by the sanctioned nation. For example, when Western countries stopped buying Iranian oil, Asian importers received discounted rates.
Some nations, particularly those with large domestic markets or resource independence, can mitigate sanctions' effects. Russia and Iran, for example, have developed parallel financial systems and strengthened ties with non-Western economies.
7. Geopolitical and Strategic Consequences
Sanctions also alter geopolitical alliances. Countries facing sanctions often form new partnerships to bypass restrictions. The growing trade between Russia, China, and Iran illustrates the emergence of an alternative economic bloc.
Furthermore, sanctions can accelerate de-dollarization—efforts by countries to reduce reliance on the U.S. dollar in international trade. This trend threatens to reshape the structure of global finance in the long term.
8. Criticisms and Limitations
While sanctions aim to promote peace and justice, they often have unintended consequences. Critics argue that:
Humanitarian Impact: Sanctions can lead to shortages of food, medicine, and essentials, harming civilians more than political elites.
Limited Effectiveness: Some regimes adapt through smuggling, black markets, or new alliances, reducing the intended pressure.
Global Economic Distortion: Sanctions can destabilize global markets, raising costs for consumers worldwide.
Political Misuse: At times, sanctions are used to advance national interests rather than collective global welfare.
9. The Future of Sanctions in a Multipolar World
As global power becomes more multipolar, sanctions may evolve from unilateral tools into complex, multilateral strategies. The rise of alternative payment systems, digital currencies, and regional alliances is challenging traditional sanction mechanisms.
Future sanctions are likely to become more targeted, using data analytics and AI to precisely identify and restrict individuals or companies, minimizing collateral damage. Digital finance, blockchain monitoring, and trade transparency will shape how sanctions are enforced.
10. Conclusion
Sanctions are a central instrument of global diplomacy and economic policy. They influence trade routes, investment flows, and geopolitical alignments across the world. While they serve as a non-violent means to uphold international norms, their ripple effects on the global market can be profound—affecting everything from oil prices to inflation and financial stability.
The challenge for the international community is to design sanctions that are strategic, humane, and effective, achieving political goals without destabilizing the world economy. In an era of interconnected markets, the role of sanctions will continue to grow—reflecting not only power politics but also the evolving architecture of the global financial and trade system.
Capital Flows Impacted1. Understanding Capital Flows
Capital flows are broadly classified into two categories:
Foreign Direct Investment (FDI):
Long-term investments in physical assets like factories, infrastructure, or real estate. FDI represents stable and sustainable investment because it indicates confidence in the host country’s economy.
Portfolio Investment:
Short-term investment in financial assets like stocks, bonds, or other securities. These flows are more volatile, as investors can quickly withdraw funds based on changes in risk perception or economic conditions.
Other Capital Flows:
These include banking sector flows, loans, and remittances. While remittances are generally stable, banking flows can fluctuate depending on interest rates and credit conditions.
Capital flows contribute to a country’s balance of payments, affect exchange rates, and determine the availability of foreign reserves. They can enhance investment, technology transfer, and job creation, but excessive inflows or sudden outflows can destabilize financial markets.
2. Factors Impacting Capital Flows
Capital flows are influenced by both push factors (conditions in advanced economies) and pull factors (conditions in emerging markets).
a. Global Interest Rates
One of the most powerful influences on capital movement is the difference in interest rates between countries.
When interest rates in advanced economies like the United States rise, investors tend to pull money out of emerging markets to take advantage of higher returns on safer assets such as U.S. Treasury bonds.
Conversely, when global interest rates are low, investors seek higher yields in developing countries, leading to capital inflows.
For example, during the U.S. Federal Reserve’s monetary tightening cycles, emerging markets like India, Brazil, and Indonesia often experience capital outflows and currency depreciation.
b. Inflation and Macroeconomic Stability
High inflation reduces the real return on investments, making a country less attractive for foreign capital. Investors prefer economies with stable prices and predictable policy environments. Macroeconomic instability—such as high fiscal deficits, political turmoil, or weak governance—can trigger capital flight as investors look for safer destinations.
c. Exchange Rate Movements
Exchange rate expectations play a crucial role in capital flow decisions.
If investors expect a currency to appreciate, they increase inflows to benefit from exchange gains.
If depreciation is expected, capital outflows intensify as investors try to avoid losses.
Unstable or artificially managed exchange rates can also discourage long-term investment, as they create uncertainty about future returns.
d. Trade and Investment Policies
Governments that promote open trade, ease of doing business, and investor-friendly policies tend to attract more capital. On the other hand, restrictive trade policies, high tariffs, or uncertain regulatory environments discourage investors.
For example, India’s liberalization reforms in the 1990s led to significant FDI inflows, while policy uncertainty in some developing countries has caused capital to dry up.
e. Geopolitical and Global Uncertainties
War, sanctions, political instability, and diplomatic tensions often lead to abrupt shifts in capital flows. Investors seek safe-haven assets such as gold, the U.S. dollar, or Swiss franc during uncertain times. The Russia-Ukraine war and tensions in the Middle East have both demonstrated how quickly capital can move in response to global crises.
3. How Capital Flows Impact Economies
The impact of capital flows can be both positive and negative, depending on their nature, duration, and management.
a. Positive Impacts
Boost to Investment and Growth:
Inflows of foreign capital provide funds for domestic investment, which can increase productivity, job creation, and infrastructure development.
Technology Transfer and Knowledge Sharing:
FDI often brings advanced technologies, managerial skills, and innovation to the host country, improving competitiveness.
Strengthening of Financial Markets:
Portfolio inflows increase liquidity in stock and bond markets, deepening the financial system and promoting market efficiency.
Improved External Balances:
Stable capital inflows help countries finance current account deficits and build foreign exchange reserves.
b. Negative Impacts
Volatility and Financial Instability:
Short-term capital, especially portfolio flows, can exit the market rapidly, leading to sharp currency depreciation, stock market crashes, and financial crises.
Exchange Rate Appreciation (Dutch Disease):
Excessive capital inflows can cause the local currency to appreciate, making exports less competitive and hurting the manufacturing sector.
Asset Bubbles:
Large inflows can fuel speculative investments in real estate or equities, inflating asset bubbles that may burst later.
Dependency and External Vulnerability:
Over-reliance on foreign capital can make an economy vulnerable to global shocks. Sudden outflows can lead to liquidity crises, as witnessed during the 1997 Asian Financial Crisis.
4. Historical and Contemporary Examples
Asian Financial Crisis (1997–98):
Rapid capital inflows into Southeast Asia fueled credit and asset bubbles. When investor confidence collapsed, massive outflows led to currency crashes and economic recessions.
Global Financial Crisis (2008):
In the wake of the crisis, developed nations lowered interest rates, leading to a surge in capital inflows to emerging markets like India and Brazil. However, these flows reversed when the U.S. signaled policy tightening in 2013, causing the “taper tantrum.”
COVID-19 Pandemic (2020):
The pandemic caused unprecedented global uncertainty, leading to sudden capital outflows from emerging markets. Later, massive liquidity injections by central banks brought capital back, especially into tech and healthcare sectors.
Current Scenario (2023–2025):
Persistent global inflation, high U.S. interest rates, and geopolitical instability have created volatile capital movements. Many emerging markets are witnessing capital outflows due to a strong U.S. dollar and rising global risk aversion.
5. Policy Measures to Manage Capital Flow Impacts
Governments and central banks use various strategies to mitigate the negative effects of volatile capital movements:
Monetary Policy Adjustments:
Central banks can use interest rate changes to stabilize currencies and control inflation, influencing the direction of capital flows.
Foreign Exchange Reserves:
Maintaining adequate reserves helps cushion against sudden outflows and currency volatility.
Capital Controls:
Temporary restrictions on certain types of inflows or outflows can prevent speculative attacks and financial instability.
Macroprudential Regulations:
Strengthening the banking system through regulations reduces the risk of asset bubbles and credit booms fueled by capital inflows.
Fiscal Discipline:
A sound fiscal policy framework reassures investors of a stable economic environment, encouraging long-term investment.
6. Conclusion
Capital flows are a double-edged sword in the global economy. While they promote growth, innovation, and development, their volatility poses challenges to economic stability. Managing capital flows effectively requires a careful balance between openness and prudence.
Countries must design policies that attract long-term, productive investments while shielding their economies from the adverse effects of short-term speculative movements. As globalization deepens, the interdependence of financial markets means that even local policy decisions can have global repercussions. Therefore, maintaining financial stability amid changing global capital dynamics remains one of the most critical tasks for modern policymakers.
In essence, capital flows reflect not just the movement of money but the pulse of global confidence — a signal of how nations are perceived in an interconnected economic world.

Regional Price Differences in the Global Trade Market1. Introduction to Regional Price Differences
Regional price differences refer to the variation in the price of the same or similar goods and services across different geographic regions or countries. In global trade, these disparities influence where goods are produced, how they are traded, and who benefits most from global value chains. For instance, the same smartphone might cost significantly more in Europe than in Asia due to differing taxes, import duties, and distribution costs.
While globalization and digitalization have helped narrow some price gaps, differences remain pronounced because local economic conditions, government regulations, and logistical constraints continue to vary widely.
2. Key Causes of Regional Price Differences
a. Production Costs and Input Availability
One of the most fundamental reasons behind regional price disparities is the difference in production costs. Labor wages, raw material availability, and energy costs differ from one region to another. For example, manufacturing costs in Southeast Asia are generally lower than in North America or Western Europe, primarily because of cheaper labor and more lenient regulatory frameworks. Consequently, products made in Asia often sell at lower prices, giving the region a competitive edge in global trade.
b. Exchange Rates and Currency Valuation
Currency fluctuations significantly impact pricing in international trade. A country with a strong currency will find its exports becoming more expensive for foreign buyers, while imports may become cheaper. Conversely, a country with a weaker currency can sell goods more competitively abroad. Exchange rate volatility, therefore, introduces continuous adjustments in trade pricing across regions.
c. Trade Policies and Tariffs
Governments impose import tariffs, export duties, and non-tariff barriers to protect domestic industries. These policies alter price structures across borders. For example, U.S. tariffs on Chinese goods during the trade tensions of 2018–2020 increased prices for certain products in American markets. Similarly, the European Union’s agricultural subsidies have led to lower food prices in Europe compared to regions where farmers receive little or no government support.
d. Transportation and Logistics Costs
Geographical distance and infrastructure quality play a vital role in determining final prices. Shipping costs, fuel prices, and port handling fees vary widely between regions. Landlocked countries, such as those in Central Africa, often face higher import prices due to their reliance on overland transportation. In contrast, coastal nations with advanced port facilities, like Singapore or the Netherlands, enjoy lower trade costs and more competitive pricing.
e. Taxation and Regulatory Differences
Value-added tax (VAT), sales tax, and environmental levies contribute to price differences. Developed countries often impose higher consumption taxes, making goods more expensive than in emerging markets. Additionally, stricter quality or safety regulations in some regions may require costly compliance, raising production and retail prices.
f. Market Demand and Purchasing Power
Regional consumer behavior and purchasing power also determine pricing strategies. Companies adjust their prices based on what consumers can afford and are willing to pay. For instance, global fast-food chains often sell products at lower prices in India or Indonesia compared to the U.S. or Japan, aligning with local income levels.
3. Economic Theories Explaining Price Differences
Two key economic theories help explain regional price disparities:
a. The Law of One Price (LOOP)
This theory suggests that in efficient markets without trade barriers or transportation costs, identical goods should have the same price globally when expressed in a common currency. However, real-world frictions — like shipping expenses, tariffs, and local taxes — often violate this law, leading to price differences.
b. Purchasing Power Parity (PPP)
PPP adjusts for differences in price levels between countries, asserting that exchange rates should equalize the purchasing power of different currencies. Yet, deviations from PPP are common due to local factors like government intervention, monopolistic pricing, and varied cost structures.
4. Regional Case Studies
a. Asia: The Manufacturing Hub
Asia, especially China, India, Vietnam, and Indonesia, is known for its low-cost manufacturing advantage. The region benefits from cheaper labor, favorable trade agreements, and strong production ecosystems. As a result, products made in Asia — such as electronics, textiles, and machinery — often cost less than similar items made in Europe or the United States. This price advantage has turned Asia into the world’s factory, though rising labor costs in China are gradually narrowing the gap.
b. Europe: High Standards and High Prices
European markets tend to have higher consumer prices due to stringent labor laws, environmental regulations, and value-added taxes. Additionally, many European countries prioritize sustainable production and quality assurance, which increase costs. However, consumers in Europe are generally willing to pay a premium for quality, ethical sourcing, and environmental responsibility.
c. North America: Market Efficiency and Brand Premiums
The U.S. and Canada enjoy advanced infrastructure and technological efficiency, which can reduce costs in some sectors. However, strong brand influence and higher wage levels often lead to elevated retail prices. Moreover, the U.S. dollar’s global dominance sometimes results in price discrepancies when converted into weaker currencies.
d. Africa and Latin America: Infrastructure and Import Dependency
Many countries in Africa and Latin America face higher prices due to weak infrastructure, high import dependency, and limited manufacturing bases. Import tariffs, long shipping routes, and unstable exchange rates further raise costs. For instance, consumer electronics or cars may cost 30–50% more in these regions than in Asia or North America.
5. Implications for Global Trade
a. Competitive Advantages and Trade Patterns
Regions with lower production costs attract multinational corporations seeking efficiency and profitability. This leads to industrial clustering — such as textile hubs in Bangladesh or electronics hubs in Taiwan. However, this concentration can also cause over-dependence and trade imbalances.
b. Consumer Access and Inequality
Price differences can contribute to global inequality. Consumers in poorer nations often pay higher prices for imported goods relative to their income, limiting access to essential products. Meanwhile, consumers in wealthier nations enjoy broader choices at competitive prices due to efficient supply chains.
c. Supply Chain Strategies
Businesses use regional price data to optimize their supply chains, choosing where to source materials and where to sell products for maximum profit. The rise of digital platforms and data analytics allows companies to monitor regional trends and adjust prices dynamically.
d. Inflation Transmission
Regional price differences can also transmit inflation across borders. For example, if energy prices rise in the Middle East, importing regions like Europe and Asia experience higher fuel and transportation costs, which ripple across global supply chains.
6. Technological and Policy Developments Reducing Price Gaps
Digitalization, automation, and free trade agreements are helping reduce some regional price disparities. E-commerce platforms allow consumers to compare global prices instantly, pressuring sellers to maintain competitiveness. Additionally, trade liberalization efforts under organizations like the World Trade Organization (WTO) aim to minimize tariffs and improve market access.
However, geopolitical tensions, such as the U.S.–China trade war or Brexit, can reverse progress by introducing new trade barriers and regulatory costs, widening price gaps once again.
7. Conclusion
Regional price differences are an inevitable and integral part of the global trade system. They reflect each region’s unique combination of resources, policies, consumer preferences, and economic maturity. While globalization, technology, and policy harmonization have narrowed some disparities, complete price uniformity remains unrealistic due to local economic realities and geopolitical diversity.
For businesses and policymakers, understanding these differences is not just an academic exercise — it is a strategic necessity. It influences where companies invest, how governments design trade agreements, and how consumers experience global markets. In the end, managing regional price differences effectively is key to ensuring balanced growth, fair competition, and sustainable globalization.

Global Trade, Cost Inflation, and Interest RatesIntroduction: An Interconnected Analysis
The global economy is a complex web of interdependent factors where trade, inflation, and interest rates play pivotal roles in determining economic growth, stability, and prosperity. These three variables—global trade, cost inflation, and interest rates—are deeply interconnected. Changes in one often trigger ripple effects across the others, influencing everything from consumer prices to investment flows and geopolitical dynamics. Understanding their relationship is essential to grasp how modern economies function and respond to challenges like supply chain disruptions, energy crises, and policy shifts by central banks.
1. Global Trade: The Engine of Economic Growth
Global trade refers to the exchange of goods and services across international borders. Over the past several decades, global trade has been a major driver of economic development, technological progress, and poverty reduction. It allows countries to specialize in producing goods where they have a comparative advantage, leading to greater efficiency and lower costs.
The liberalization of trade—through organizations like the World Trade Organization (WTO) and trade agreements such as NAFTA and RCEP—has encouraged the integration of global markets. However, global trade is sensitive to macroeconomic variables like inflation and interest rates, which affect production costs, consumer demand, and investment decisions.
In recent years, global trade has been influenced by various factors:
Pandemic disruptions (COVID-19) that halted supply chains.
Geopolitical tensions, such as U.S.-China trade wars and the Russia-Ukraine conflict.
Rising protectionism, as seen in tariffs and export restrictions.
Technological shifts towards digital trade and automation.
These factors have collectively reshaped how goods move around the world and how prices respond to economic shocks.
2. Cost Inflation: Rising Prices in the Global Economy
Inflation refers to the sustained increase in the general price level of goods and services. In a globalized economy, cost inflation often arises from factors that affect the supply side of trade, such as rising commodity prices, labor shortages, or disruptions in logistics.
There are two main types of inflation relevant to global trade:
Demand-pull inflation – when global demand exceeds supply, driving up prices.
Cost-push inflation – when input costs (energy, raw materials, transportation) increase, pushing prices higher.
In recent years, the world has witnessed cost-push inflation more prominently due to:
Energy price spikes: Oil and natural gas prices rose sharply after the Russia-Ukraine war, raising production and transportation costs worldwide.
Supply chain bottlenecks: Delays in ports and shortages of semiconductors or shipping containers increased manufacturing costs.
Wage pressures: Labor shortages in many economies have led to higher wages, contributing to price rises.
As global trade depends heavily on transportation and logistics, even small increases in shipping or fuel costs can translate into significant global inflationary pressures. For example, a surge in crude oil prices affects not just fuel costs but also the prices of plastics, fertilizers, and food products.
3. Interest Rates: The Policy Tool of Central Banks
Interest rates are the primary tool used by central banks (like the Federal Reserve, European Central Bank, and Reserve Bank of India) to control inflation and stimulate or cool down economic activity. When inflation rises, central banks typically increase interest rates to make borrowing more expensive, thereby reducing spending and demand. Conversely, when economic growth slows, rates are cut to encourage investment and consumption.
Global interest rate cycles have a profound impact on trade and inflation:
High interest rates tend to strengthen a country’s currency, making exports more expensive and imports cheaper, which can reduce the trade balance.
Low interest rates have the opposite effect, weakening the currency, boosting exports, but potentially fueling inflation.
Since 2021, central banks around the world have engaged in monetary tightening to combat high inflation triggered by post-pandemic recovery and energy shocks. For instance, the U.S. Federal Reserve raised rates multiple times, leading to a stronger dollar and higher borrowing costs globally. Emerging markets, in turn, faced capital outflows and currency depreciation, which further raised import prices and inflationary pressures.
4. The Interlink Between Trade, Inflation, and Interest Rates
The three forces—global trade, inflation, and interest rates—are interdependent and influence one another in complex ways.
a) Trade and Inflation
Global trade can both mitigate and amplify inflation. On one hand, open trade allows countries to import cheaper goods, which can reduce domestic inflation. On the other hand, disruptions in trade (like sanctions or shipping blockages) can cause shortages and raise prices. For example, disruptions in global food and energy supplies due to the Ukraine war led to worldwide food inflation.
b) Inflation and Interest Rates
When inflation rises, central banks increase interest rates to curb demand. However, higher interest rates raise the cost of financing for businesses involved in trade, which can reduce investment and global trade volumes. The slowdown in trade, in turn, can ease inflation but may also hurt economic growth.
c) Interest Rates and Trade
High interest rates can appreciate a country's currency, making exports less competitive. For example, a strong U.S. dollar makes American goods more expensive for foreign buyers, reducing export demand. Conversely, low interest rates can weaken the currency, boosting exports but potentially increasing imported inflation.
5. Global Trends Since 2020
Since the onset of the COVID-19 pandemic, the relationship between these three elements has undergone major shifts:
2020: Central banks slashed interest rates to near zero to support economies. Global trade contracted sharply due to lockdowns and supply chain collapses.
2021–2022: As economies reopened, demand surged faster than supply recovery, leading to inflation spikes. Energy shortages and logistics issues worsened cost inflation.
2022–2023: Central banks began raising interest rates aggressively to control inflation. This monetary tightening slowed down global trade growth, increased borrowing costs, and affected emerging market currencies.
2024–2025: The world entered a period of adjustment. Inflation started to moderate but remained sticky due to lingering cost pressures, especially in energy and food sectors. Trade diversification, such as "China+1" strategies, began to reshape supply chains and reduce dependency on single markets.
6. Effects on Businesses and Consumers
For businesses, higher global inflation and interest rates mean increased production costs, reduced profit margins, and difficulty accessing affordable credit. Companies engaged in international trade also face exchange rate risks and tariff uncertainties.
For consumers, inflation erodes purchasing power, while high interest rates make loans (for homes, cars, education) more expensive. This leads to reduced consumption, which can further dampen global demand.
For governments, managing these variables is a balancing act—stimulating growth through trade while keeping inflation in check without triggering a recession.
7. The Path Ahead: Challenges and Opportunities
As the world adapts to new economic realities, several trends are shaping the future of global trade, inflation, and interest rates:
Digital trade and automation are reducing costs and making global supply chains more efficient.
Energy transition towards renewables is helping stabilize long-term cost inflation linked to fossil fuels.
Regional trade blocs are emerging to secure supply chains and reduce vulnerability to geopolitical risks.
Central bank coordination remains crucial in avoiding excessive volatility in exchange rates and capital flows.
However, challenges persist—rising protectionism, climate-related disruptions, and financial market instability could continue to influence inflation and interest rate dynamics.
8. Conclusion
Global trade, cost inflation, and interest rates form a powerful triad that determines the rhythm of the global economy. When trade flows smoothly and inflation remains moderate, interest rates stay stable, supporting growth and investment. But when inflation surges due to global shocks—such as wars, pandemics, or supply chain disruptions—interest rates rise, trade slows, and economic uncertainty increases.
In essence, the balance between these factors defines global economic stability. Policymakers must carefully calibrate interest rates, promote open yet resilient trade systems, and address the root causes of cost inflation to ensure sustainable growth. As the world becomes increasingly interconnected, the harmony between trade, prices, and monetary policy will remain at the heart of global prosperity.

Oil Wars and Their Impact on the World Trade Market1. The Strategic Importance of Oil
Oil is the most traded commodity in the world. It accounts for a large share of global trade value and is a key determinant of national security and economic strength. Countries that possess abundant oil reserves—like Saudi Arabia, Russia, the United States, and Iran—often wield considerable influence over the global market. Conversely, oil-importing nations, such as India, Japan, and many European countries, are highly dependent on global oil supply stability and pricing.
Oil prices directly affect inflation, transportation costs, and industrial production. Therefore, any disruption—be it due to war, sanctions, or political instability—ripples through the world economy, impacting global trade flows, currency exchange rates, and stock markets.
2. Historical Background of Oil Wars
The link between oil and conflict dates back to the early 20th century. During both World Wars, control over oil supplies was critical for military success. Germany’s lack of oil access in World War II, for example, significantly weakened its war machine.
Later, the Arab-Israeli conflicts and the 1973 Arab Oil Embargo marked the first major energy crisis in modern history. In retaliation for Western support of Israel, OPEC nations reduced oil production, causing prices to quadruple and triggering global economic turmoil. The incident demonstrated how oil could be used as a political weapon in international trade.
In the late 20th century, the Gulf Wars—especially the 1990–91 conflict following Iraq’s invasion of Kuwait—were driven largely by control over oil resources. These wars disrupted oil exports from the Middle East, affected maritime trade routes, and led to sharp volatility in global markets.
3. Modern Oil Wars: Geopolitical Rivalries and Economic Strategy
Today’s oil wars are less about open military invasion and more about economic and political control. Major powers engage in “energy diplomacy” and sanctions, using oil as leverage. For example:
United States vs. Iran: The U.S. has imposed sanctions on Iranian oil exports to limit Tehran’s revenue and geopolitical influence. This restricts global supply and often causes short-term oil price spikes.
Russia vs. the West: The 2022 Russia–Ukraine war triggered one of the largest energy crises in recent decades. Western sanctions on Russian oil and gas reshaped trade routes and forced Europe to diversify its energy imports.
Saudi Arabia vs. U.S. Shale Producers: In 2014–2016, Saudi Arabia intentionally increased oil production to lower global prices, aiming to drive out high-cost American shale producers from the market. This “price war” destabilized oil-exporting economies and caused massive losses in the energy sector.
These modern conflicts are fought through production levels, price manipulation, and supply chain disruption rather than traditional warfare. Yet their effects on world trade are equally powerful.
4. Impact on Global Oil Prices
Oil wars create volatility—the most visible effect on the world market. When supply is threatened, prices surge; when production rises excessively, prices collapse.
For instance:
The 2022 Russia–Ukraine war pushed Brent crude prices above $120 per barrel—the highest in a decade.
Conversely, during the COVID-19 pandemic in 2020, an oil price war between Russia and Saudi Arabia led to an oversupply. Prices crashed, even turning negative in U.S. futures markets for a brief period.
Price volatility affects not only oil-producing nations but also global consumers. Transportation, manufacturing, and agriculture—all dependent on energy—face rising costs, which can slow economic growth and trade activity.
5. Effects on the Global Trade Market
a. Inflation and Cost of Goods
Oil price fluctuations directly influence inflation. When oil becomes expensive, transportation and manufacturing costs rise, increasing prices for goods globally. This reduces consumer demand and can lead to trade imbalances between nations.
b. Trade Deficits and Surpluses
Oil-importing countries spend more foreign currency on imports when prices rise, worsening their trade deficits. Conversely, oil-exporting countries gain trade surpluses and stronger currencies. For example, high oil prices benefit nations like Saudi Arabia, Norway, and Russia, but hurt countries like India and Japan.
c. Currency Movements
Oil wars also affect foreign exchange markets. The U.S. dollar, traditionally the benchmark currency for oil trading (the “petrodollar”), strengthens during global crises, while currencies of oil-importing nations often weaken. In contrast, oil-exporting countries’ currencies appreciate when prices rise.
d. Supply Chain Disruptions
Many shipping lanes and chokepoints—like the Strait of Hormuz or the Suez Canal—are located in oil-rich, politically unstable regions. Conflicts here disrupt maritime trade, delay shipments, and raise insurance costs for global exporters.
6. The Role of OPEC and Non-OPEC Nations
The Organization of Petroleum Exporting Countries (OPEC), founded in 1960, remains central to global oil politics. Through coordinated production decisions, OPEC and its allies (collectively called OPEC+) attempt to stabilize prices and control supply. However, internal rivalries often lead to disputes and price wars.
Non-OPEC producers like the U.S. (via shale oil) and Russia challenge OPEC’s dominance, creating competitive dynamics that frequently spill into trade wars. Each side uses production adjustments and diplomatic alliances to secure their share of the global market.
7. Energy Transition and Future Oil Conflicts
As the world shifts toward renewable energy and climate-friendly policies, traditional oil producers face declining long-term demand. This transition could spark new forms of “energy wars,” as nations compete for dominance in emerging technologies like electric vehicles, hydrogen, and battery minerals.
For instance:
The U.S. and China are already in competition for control over rare earth elements used in clean energy systems.
Oil-exporting countries are diversifying their economies to reduce dependency, but instability could rise if revenues fall too quickly.
The future oil wars may thus be economic battles over energy influence rather than territorial control.
8. Global Economic Consequences
Oil wars have cascading effects across the global economy:
Stock Markets: Energy price volatility influences global indices. Rising oil prices often cause stock markets to decline due to higher business costs.
Commodity Prices: Oil affects other commodities like natural gas, metals, and agricultural goods, since energy is required for production and transport.
Investment Flows: Investors shift toward safer assets (like gold and U.S. Treasury bonds) during oil-related geopolitical tensions.
Developing Economies: Emerging markets reliant on oil imports suffer higher inflation, currency depreciation, and trade deficits during crises.
9. Case Studies: Notable Oil Conflicts
1973 Arab Oil Embargo: OPEC’s restriction on oil exports to the West quadrupled prices, leading to global recession and inflation.
1991 Gulf War: Iraq’s invasion of Kuwait disrupted oil supply and triggered U.S.-led military intervention, causing price surges.
2014–2016 Oil Price War: Saudi Arabia flooded the market to undercut U.S. shale, resulting in a 70% price drop.
2022 Russia–Ukraine War: Sanctions and supply restrictions reshaped the global energy trade, with Europe turning to U.S. and Middle Eastern suppliers.
10. Conclusion
Oil wars have always been more than just battles for resources—they are struggles for power, influence, and economic dominance. Every time an oil-producing nation faces conflict or sanctions, the repercussions are felt in trade balances, inflation rates, and financial markets worldwide. The volatility of oil prices remains one of the most significant risks to global economic stability.
As the world transitions toward renewable energy, new types of resource competition will emerge. But as long as oil remains the foundation of industrial energy, the geopolitics of oil will continue to shape the world trade market—deciding winners and losers in the global economic arena.

Microstructure of Institutional Trading1. Understanding Market Microstructure
Market microstructure studies how trades occur, who participates, how prices are set, and what factors influence transaction costs. It looks beyond the macro view of supply and demand to examine the “plumbing” of the market — the trading venues, order types, intermediaries, and algorithms that connect buyers and sellers.
Key components of microstructure include:
Order types (limit, market, stop-loss, iceberg orders)
Trading venues (exchanges, dark pools, electronic communication networks)
Liquidity providers and takers
Transaction costs (explicit and implicit)
Price discovery (how information becomes reflected in prices)
Institutional investors must navigate this microstructure efficiently to minimize slippage (difference between expected and actual trade price) and transaction costs.
2. Characteristics of Institutional Trading
Institutional trading differs from retail trading in several ways:
Trade Size and Impact:
Institutions often trade in very large quantities, making their orders capable of moving market prices significantly. A single institutional order can absorb much of the market’s liquidity in a stock or derivative.
Execution Goals:
Their main objectives are to obtain the best price, minimize market impact, and maintain anonymity. To achieve this, they rely on sophisticated execution strategies and algorithmic trading systems.
Time Horizon:
Institutions may operate over longer horizons (e.g., portfolio rebalancing) or shorter ones (e.g., hedge fund arbitrage). Their strategies depend on their mandates—active funds seek alpha (excess returns), while passive funds focus on tracking indices efficiently.
Information Sensitivity:
Institutional orders can reveal private information. Therefore, discretion and order-splitting techniques are vital to prevent competitors from front-running or copying trades.
3. Trading Venues and Mechanisms
Institutional traders use multiple platforms for execution, depending on their goals and the liquidity of the security.
a) Public Exchanges
These are centralized venues like the NSE, NYSE, or NASDAQ, where prices and volumes are transparent. Trading here provides liquidity but also exposes orders to the public, increasing the risk of market impact.
b) Dark Pools
Dark pools are private trading venues where orders are hidden from public view until after execution. They are crucial for institutions wishing to trade large blocks discreetly.
Advantages: Reduced market impact and anonymity.
Disadvantages: Lower transparency and potential for adverse selection (trading against informed counterparties).
c) Electronic Communication Networks (ECNs)
ECNs match buy and sell orders electronically without intermediaries. They allow fast, efficient, and often lower-cost trading but may fragment liquidity across multiple venues.
4. Types of Orders and Execution Strategies
Institutional traders use various order types to control how their trades interact with the market:
Market Orders: Execute immediately at the best available price; suitable for urgent trades but risk slippage.
Limit Orders: Execute only at a specified price or better; useful for price control but may not fill completely.
Iceberg Orders: Only a portion of the order is visible to the market, hiding true size to reduce impact.
VWAP (Volume Weighted Average Price) Orders: Designed to execute gradually throughout the day to match average market volume, minimizing disruption.
TWAP (Time Weighted Average Price) Orders: Spread execution evenly over a specific time period to achieve average pricing.
5. Algorithmic and High-Frequency Trading (HFT)
Modern institutional trading is heavily algorithm-driven. Algorithms automate execution, monitor market conditions, and adjust strategies dynamically.
Common Institutional Algorithms:
VWAP Algorithms: Match market volume to minimize detection.
TWAP Algorithms: Execute evenly over time for steady exposure.
Implementation Shortfall Algorithms: Balance between speed and cost by comparing real-time execution price with a benchmark.
Liquidity-Seeking Algorithms: Hunt for hidden liquidity across venues, including dark pools.
Smart Order Routing (SOR): Distributes portions of large orders to multiple venues for optimal fill rates.
High-frequency traders (HFTs), though distinct from traditional institutions, influence institutional execution by tightening spreads and providing liquidity—though sometimes they compete aggressively, increasing volatility.
6. Market Impact and Transaction Costs
Institutional trading must account for two main cost categories:
Explicit Costs:
Commissions
Exchange fees
Taxes and regulatory costs
Implicit Costs:
Bid-Ask Spread: Difference between buying and selling prices.
Price Impact: Movement in price caused by executing large trades.
Opportunity Cost: Loss due to unfilled or delayed orders.
Managing these costs is central to institutional execution. Large trades are often broken into smaller slices to disguise intent and reduce impact. For example, a ₹500 crore order might be executed over several days using VWAP algorithms.
7. Information Asymmetry and Adverse Selection
Market microstructure acknowledges that not all participants possess the same information. Institutional investors may trade based on private analysis or insider signals, while market makers quote prices without full knowledge of order intent.
When institutions submit large orders, market makers may widen spreads to protect themselves from potential information disadvantages, leading to adverse selection costs.
To reduce this, institutions:
Use dark pools for anonymity.
Split orders across multiple venues.
Employ execution algorithms that mimic normal trading patterns.
8. Role of Market Makers and Liquidity Providers
Market makers play a crucial role by continuously quoting buy (bid) and sell (ask) prices. For institutional traders, these entities:
Offer liquidity during low-volume periods.
Help stabilize prices by absorbing temporary imbalances.
Sometimes act as counterparties in large block trades (via investment banks or brokers).
However, the liquidity provided is not unlimited—large institutional orders may still cause slippage or gaps in price, especially in less-liquid securities.
9. Regulatory Oversight and Transparency
Regulatory frameworks—such as SEBI in India, SEC in the U.S., and MiFID II in Europe—aim to ensure:
Fairness and transparency in execution.
Prevention of market manipulation and insider trading.
Reporting of large trades and post-trade transparency.
Institutions must comply with best execution standards, meaning they must prove they sought the best possible outcome for clients across venues.
10. Technology and Data in Institutional Trading
Today’s institutional traders rely on:
Real-time data analytics for monitoring liquidity and volatility.
Machine learning models to forecast order book dynamics.
Post-trade analytics to measure execution performance (e.g., tracking VWAP deviation).
Artificial intelligence for adaptive algorithms that learn from historical patterns.
Technology bridges the gap between human strategy and automated precision, optimizing both cost and speed.
11. Conclusion
The microstructure of institutional trading is a sophisticated ecosystem shaped by liquidity dynamics, technology, regulation, and competition. Institutional traders must balance size, secrecy, and speed while minimizing costs and preserving market integrity.
Their trading activity significantly influences price discovery, volatility, and overall market efficiency. As financial markets evolve—with advances in AI, blockchain, and decentralized trading platforms—the microstructure of institutional trading will continue to adapt, becoming even more data-driven, algorithmic, and globally interconnected.
How i trade This is how i trade.
Looking at AUDJPY, I want to show you step by step how i trade using volume, momentum and rsi, looking at each timeframe from the monthly to the 5 min.

#1 Swish StrategyA simple yet a powerful tool,
Just follow the SWISH strategy, a video in detail about the steps to be followed.
Disclaimer :
It is just for educational purpose. It is not a Buy/Sell recommendation. Do your own analysis before investing.

Petrodollars and Their Global Impact1. The Origin of Petrodollars
The concept of petrodollars emerged in the early 1970s following the collapse of the Bretton Woods system and the oil shocks that reshaped global energy markets. After the U.S. decoupled the dollar from gold in 1971, the dollar’s value began to fluctuate freely. In 1973, the Organization of the Petroleum Exporting Countries (OPEC) significantly increased oil prices in response to geopolitical tensions and rising global demand.
At the same time, an agreement between the United States and Saudi Arabia ensured that oil would continue to be priced and traded exclusively in U.S. dollars. This deal effectively globalized the dollar as the primary currency for energy trade. As oil prices surged, exporting countries, particularly in the Middle East, earned enormous dollar revenues. These dollars became known as petrodollars, representing the surplus funds that oil producers accumulated from selling oil abroad.
2. Petrodollar Recycling
Petrodollar recycling refers to how oil-exporting countries reinvest or redistribute their dollar earnings. This recycling process has two main channels:
Financial Recycling: Oil-exporting nations deposit their dollar earnings in international banks or invest them in global financial markets, especially U.S. Treasury securities, stocks, and bonds. This recycling helps sustain global liquidity and supports the U.S. economy by financing its trade and fiscal deficits.
Real Recycling: Petrodollars are used for development projects, infrastructure building, or the import of goods and services. Oil-rich nations often spend their surpluses on foreign products, technology, and defense equipment, which stimulates demand in manufacturing economies such as the U.S., Europe, and increasingly, China.
During the 1970s and 1980s, the recycling of petrodollars was crucial for stabilizing global financial systems. Banks used the inflow of funds from oil exporters to lend to developing nations, leading to an expansion of global credit. However, this also contributed to the debt crises of the 1980s when many borrowing countries were unable to repay their loans.
3. Economic Impacts of Petrodollars
The accumulation and recycling of petrodollars have wide-ranging economic consequences that shape both national and global economies.
a) U.S. Dollar Dominance:
Petrodollars reinforce the U.S. dollar’s role as the world’s reserve currency. Since oil must be purchased in dollars, all countries need to hold large dollar reserves. This creates consistent demand for the dollar, giving the U.S. a unique financial advantage known as “exorbitant privilege.” It allows the U.S. to run persistent trade deficits without facing immediate pressure to devalue its currency.
b) Balance of Payments Effects:
Oil-importing nations often face balance-of-payments deficits when oil prices rise because they need to spend more dollars on energy imports. Conversely, oil-exporting nations accumulate surpluses, strengthening their fiscal positions. These imbalances influence global capital flows, interest rates, and investment patterns.
c) Inflation and Exchange Rates:
Fluctuations in oil prices directly affect inflation rates worldwide. Higher oil prices increase transportation and production costs, driving inflation. Countries with weaker currencies or heavy energy dependence experience greater inflationary pressure. At the same time, oil exporters’ currencies may appreciate due to rising export revenues, affecting their non-oil sectors’ competitiveness.
4. Political and Geopolitical Implications
Petrodollars are not just an economic concept—they carry enormous geopolitical weight. The control and flow of petrodollars often determine international alliances, diplomatic relations, and power structures.
a) U.S.–Middle East Relations:
The petrodollar system strengthened ties between the United States and major oil producers like Saudi Arabia. In exchange for pricing oil in dollars, the U.S. provided military protection and political support to these regimes. This interdependence shaped decades of Middle Eastern geopolitics, influencing regional conflicts and global energy policy.
b) Geopolitical Leverage:
Countries that control oil exports wield considerable influence over global markets. For example, OPEC’s decisions to increase or cut production affect not only oil prices but also inflation, currency values, and economic stability across the globe. The accumulation of petrodollar reserves gives these nations leverage in international diplomacy.
c) Challenge to Dollar Hegemony:
In recent years, some countries, including China, Russia, and Iran, have sought to reduce reliance on the dollar in oil trade, promoting alternatives such as the petroyuan. If major energy exporters begin accepting other currencies, it could gradually weaken the dollar’s dominance and alter global financial power dynamics.
5. Petrodollars and Global Financial Markets
Petrodollar flows significantly influence global capital markets. When oil prices are high, exporters earn more dollars and invest heavily abroad. This results in large capital inflows into Western financial markets, especially the U.S., Europe, and Japan. These funds help maintain low interest rates and high liquidity in developed economies.
For instance, during oil booms, sovereign wealth funds (SWFs) from countries like Saudi Arabia, the United Arab Emirates, and Norway invest billions of dollars in equities, bonds, and infrastructure projects worldwide. These investments provide stability to global markets but also tie the financial fortunes of oil-rich nations to the performance of global assets.
However, during oil price declines, the opposite occurs—oil exporters withdraw funds to support domestic spending, which can tighten global liquidity and trigger financial volatility.
6. Petrodollars and the Developing World
The flow of petrodollars also impacts developing economies in complex ways. On one hand, petrodollar-funded loans and investments have financed infrastructure and industrialization in many developing countries. On the other hand, easy access to petrodollar-driven credit during the 1970s led to unsustainable borrowing, resulting in debt crises across Latin America and Africa.
Today, oil-importing developing nations face fiscal stress when oil prices rise, as more of their foreign exchange reserves are spent on energy imports. This can widen trade deficits and increase inflation. Conversely, oil-exporting developing nations experience economic booms during high oil price periods, though many struggle with the “resource curse”—an overreliance on oil revenues that undermines diversification and governance.
7. The Environmental and Energy Transition Dimension
In the 21st century, the world’s transition toward renewable energy presents new challenges for the petrodollar system. As global efforts to reduce carbon emissions intensify, the demand for oil may gradually decline, reducing the flow of petrodollars. This could weaken the economic power of traditional oil exporters and reshape global financial alignments.
Countries dependent on petrodollar revenues face growing pressure to diversify their economies. Initiatives like Saudi Arabia’s Vision 2030 aim to transform oil-dependent economies into diversified, investment-driven ones. Meanwhile, the shift to green energy could also influence currency dynamics if renewable energy trade begins to operate in non-dollar terms.
8. Conclusion
The petrodollar system has been one of the most influential forces in shaping modern global economics and geopolitics. It strengthened the U.S. dollar’s dominance, facilitated global financial integration, and underpinned strategic alliances, especially between the U.S. and Middle Eastern oil producers. At the same time, it created structural imbalances—linking global liquidity and financial stability to volatile oil prices.
As the world moves toward renewable energy and multipolar finance, the traditional petrodollar system faces challenges from alternative energy sources, new trading currencies, and geopolitical shifts. Nonetheless, as long as oil remains a central component of global energy consumption, petrodollars will continue to shape the global economic order, influencing everything from exchange rates and inflation to political alliances and investment flows.
In essence, petrodollars represent far more than currency—they are the lifeblood of the global energy economy and a cornerstone of modern financial power.

Risk in International Market Trading1. Introduction to International Market Risks
When investors or companies operate globally, they face uncertainties that can significantly affect profitability and market stability. The international marketplace is dynamic, influenced by macroeconomic factors, geopolitical tensions, and regulatory shifts. These risks can either be systematic—affecting all participants (like global recessions or currency devaluations)—or unsystematic, impacting specific sectors or countries (like political instability or trade restrictions).
The ability to identify, evaluate, and mitigate these risks determines the success and sustainability of international trading activities.
2. Types of Risks in International Market Trading
a) Exchange Rate Risk (Currency Risk)
Exchange rate risk is among the most significant challenges in international trading. It arises because the value of currencies fluctuates daily due to factors like interest rate changes, inflation differentials, and macroeconomic performance.
For example, if an Indian exporter sells products to a European buyer in euros, but the euro depreciates against the rupee before payment is received, the exporter earns less in rupees than expected. Similarly, investors holding foreign assets may face losses when converting profits back to their home currency.
Hedging instruments like forward contracts, futures, and currency options are widely used to mitigate exchange rate risks. Additionally, diversification of currency exposure across multiple regions helps balance potential losses.
b) Political and Geopolitical Risk
Political instability, government policy changes, trade restrictions, sanctions, or even wars can dramatically affect international trading conditions. For instance, the Russia-Ukraine conflict caused significant disruptions in global energy markets, affecting prices and supply chains worldwide.
Geopolitical tensions can lead to nationalization of foreign assets, expropriation, or sudden changes in tariffs and trade agreements. Investors and multinational corporations must carefully assess the political climate of each country before entering or expanding operations.
Political risk insurance, offered by international agencies like the Multilateral Investment Guarantee Agency (MIGA), helps safeguard against such uncertainties.
c) Economic and Financial Risk
Economic instability—such as recessions, inflation surges, or financial crises—can harm international traders and investors. A slowdown in global demand or a liquidity crunch in one region can ripple through global markets.
For instance, the 2008 global financial crisis began in the U.S. mortgage sector but quickly impacted banks, stock markets, and economies worldwide.
Economic risk also involves the possibility of a country’s inability to meet its debt obligations, affecting the value of its bonds and currency. Monitoring macroeconomic indicators like GDP growth, fiscal balance, inflation, and interest rates is essential for managing such risks.
d) Legal and Regulatory Risk
Each country operates under different laws regarding trade, taxation, investment, and environmental protection. International traders must comply with varying legal standards, which can be complex and costly. Sudden regulatory changes, import/export restrictions, or changes in tax policy can alter the profitability of international operations.
For example, changes in customs duties or the imposition of new compliance requirements by the European Union can affect exporters from developing countries.
Legal due diligence and the use of international trade agreements like the World Trade Organization (WTO) rules can minimize exposure to regulatory uncertainties.
e) Credit and Payment Risk
Credit risk refers to the possibility that a foreign buyer or partner fails to fulfill payment obligations. In international trade, the physical distance and differing legal systems increase the difficulty of enforcing contracts.
A company exporting goods might face non-payment due to insolvency, political turmoil, or foreign exchange restrictions in the buyer’s country.
To manage this, traders often use letters of credit (LCs), export credit insurance, or advance payment agreements. These mechanisms provide assurance and reduce the likelihood of bad debts in cross-border transactions.
f) Country Risk
Country risk is a broad concept encompassing political, economic, and financial stability within a nation. It measures how likely it is that an investor or trader will face losses due to adverse events in a specific country.
For instance, a country facing high inflation, unstable government, or external debt crisis poses higher risks to investors.
Country risk assessments, often published by credit rating agencies like Moody’s, S&P, or Fitch, help investors gauge the level of safety before investing or trading.
g) Cultural and Communication Risk
Cultural differences can cause misunderstandings, negotiation failures, or marketing errors. Business practices, ethics, and communication styles vary across regions, affecting relationships and deal outcomes.
For example, marketing strategies that work in Western countries may not succeed in Asia due to differing cultural values and consumer behavior.
Cross-cultural training, hiring local experts, and adapting products to local preferences help reduce this risk.
h) Market and Liquidity Risk
International traders and investors also face market volatility due to fluctuating global demand, supply disruptions, or sudden investor sentiment changes. Liquidity risk arises when an investor cannot easily convert assets into cash without a significant price loss.
Emerging markets often have less liquid financial instruments, increasing vulnerability during economic shocks.
Portfolio diversification and maintaining adequate cash reserves can mitigate market and liquidity risks.
i) Operational and Supply Chain Risk
Operational risks stem from failures in logistics, technology, or internal processes. In global trade, disruptions in supply chains—caused by natural disasters, pandemics, or port congestion—can delay deliveries and increase costs.
For example, the COVID-19 pandemic exposed severe weaknesses in global supply chains, leading to shortages of essential goods.
Companies are now adopting risk management frameworks and diversifying supply bases to enhance resilience.
3. Methods of Managing International Market Risks
To thrive in the global marketplace, risk management must be proactive and strategic. The following approaches are commonly used:
Hedging Strategies:
Using financial instruments such as futures, options, and swaps to lock in exchange rates or commodity prices reduces exposure to market volatility.
Diversification:
Investing or trading across multiple countries, industries, and currencies helps spread risk and offset potential losses from one market.
Insurance and Guarantees:
Political risk insurance, export credit insurance, and guarantees from organizations like the Export-Import Bank reduce exposure to default and political risks.
Due Diligence and Research:
Regularly analyzing economic indicators, political developments, and market trends helps in making informed trading decisions.
Partnerships and Local Expertise:
Collaborating with local firms provides insights into regional regulations and cultural norms, reducing operational and compliance risks.
4. The Importance of Risk Management in International Markets
Effective risk management is essential for maintaining stability, profitability, and competitiveness in international markets.
It protects capital and ensures business continuity.
It enhances investor confidence, attracting global partnerships and funding.
It supports strategic decision-making, allowing firms to expand globally with calculated exposure.
It prevents major losses during unpredictable global events, such as currency crashes or political upheavals.
5. Conclusion
Trading in international markets offers vast opportunities for growth, diversification, and innovation. However, it also brings a wide range of risks—financial, political, regulatory, and cultural—that can severely impact success if not properly managed.
A structured approach to identifying, analyzing, and mitigating these risks is crucial. By using hedging tools, conducting thorough market research, and adopting diversified strategies, investors and businesses can navigate the complexities of global markets more confidently.
In an increasingly interconnected world, those who understand and manage international risks effectively are best positioned to thrive in the ever-evolving landscape of global trade and finance.
Global Market Participants1. Introduction to Global Market Participants
Global market participants are entities that take part in international financial transactions. These include individual investors, institutional investors, corporations, governments, central banks, and intermediaries. Their activities impact the stability, efficiency, and development of the financial markets. The diversity among these participants ensures liquidity, facilitates price discovery, and contributes to economic growth by channeling funds from savers to borrowers worldwide.
2. Individual Investors
Individual investors, often called retail investors, are private persons who invest their own money in various financial assets such as stocks, bonds, mutual funds, or cryptocurrencies. Their primary goals are to grow wealth, earn income, and achieve financial security.
Key Characteristics:
Smaller investment amounts compared to institutions.
Focus on long-term capital appreciation or short-term trading profits.
Tend to rely on brokers, financial advisors, and digital trading platforms.
Role in the Market:
Retail investors enhance market liquidity and promote diversity in trading behaviors. With the rise of online trading platforms and fintech innovation, the participation of individuals in global markets has increased significantly. Social media and global connectivity now allow retail investors to influence markets, as seen during events like the 2021 “meme stock” phenomenon.
3. Institutional Investors
Institutional investors are large entities that pool money from clients or members and invest in financial markets to achieve specific objectives. They include pension funds, insurance companies, mutual funds, hedge funds, and sovereign wealth funds.
a. Pension Funds:
Pension funds invest the savings of employees to ensure financial security after retirement. They typically favor long-term, stable investments like bonds and blue-chip stocks.
b. Insurance Companies:
Insurance firms invest premiums collected from policyholders in relatively safe and income-generating assets to meet future claims.
c. Mutual Funds:
These funds pool money from numerous investors to invest in diversified portfolios of stocks, bonds, or other assets. They enable individuals to access professional management and diversification benefits.
d. Hedge Funds:
Hedge funds target high returns through aggressive strategies, including leverage, derivatives trading, and short-selling. They often cater to high-net-worth individuals and institutions.
e. Sovereign Wealth Funds (SWFs):
These are government-owned investment funds that manage national reserves, often derived from oil revenues or trade surpluses. Examples include Norway’s Government Pension Fund Global and Singapore’s GIC.
Impact on Global Markets:
Institutional investors dominate global capital flows and can significantly influence market trends. Their large-scale investments affect prices, volatility, and even government bond yields.
4. Corporations and Multinational Companies (MNCs)
Corporations participate in global financial markets for financing, investment, and risk management purposes.
Key Activities:
Raising Capital: Through issuing stocks or bonds to finance expansion.
Foreign Exchange Management: Engaging in currency markets to hedge exchange rate risks.
Mergers and Acquisitions: Companies use global capital markets to fund cross-border deals.
Example:
A U.S.-based company operating in Europe may use derivatives to hedge against euro-dollar exchange rate fluctuations. Multinational corporations also issue global or Eurobonds to attract international investors.
5. Governments
Governments are major players in global markets, primarily as issuers of sovereign debt and regulators of financial systems.
Roles:
Issuers of Government Bonds: To finance public spending and infrastructure projects.
Market Regulators: Setting and enforcing financial regulations to maintain transparency, stability, and investor confidence.
Participants in the Currency Market: Governments manage foreign exchange reserves to stabilize national currencies and support trade balances.
Example:
The U.S. Treasury issues bonds that serve as global benchmarks for risk-free assets, while developing nations issue sovereign debt to attract foreign capital.
6. Central Banks
Central banks, such as the U.S. Federal Reserve, the European Central Bank (ECB), and the Reserve Bank of India (RBI), are among the most influential market participants.
Key Functions:
Monetary Policy: Controlling money supply and interest rates to manage inflation and stimulate growth.
Foreign Exchange Operations: Buying and selling currencies to stabilize exchange rates.
Liquidity Provider: Acting as lenders of last resort to the banking system.
Central banks also influence global markets through quantitative easing, where they purchase government bonds to inject liquidity into the economy. Their decisions can trigger global reactions, affecting stock, bond, and currency markets worldwide.
7. Financial Intermediaries
Financial intermediaries connect savers with borrowers, facilitating the flow of funds across the economy. These include commercial banks, investment banks, brokers, and exchanges.
a. Commercial Banks:
Provide loans, accept deposits, and offer payment systems. They are key in credit creation and financial stability.
b. Investment Banks:
Help corporations and governments raise capital through underwriting securities and managing mergers and acquisitions.
c. Brokers and Dealers:
Act as agents for investors, executing trades and providing liquidity in financial markets.
d. Exchanges:
Stock and commodity exchanges provide regulated platforms for buying and selling financial instruments. Examples include the New York Stock Exchange (NYSE), London Stock Exchange (LSE), and the Bombay Stock Exchange (BSE).
8. Speculators and Traders
Speculators take on financial risk in the hope of profiting from price movements. While often viewed as risk-takers, they serve an important function by adding liquidity and aiding price discovery.
Types of Traders:
Day Traders: Engage in short-term trades for quick profits.
Arbitrageurs: Exploit price differences between markets or instruments.
Algorithmic Traders: Use computer programs to execute high-frequency trades.
Their activities ensure continuous market operation, even during volatile periods.
9. Credit Rating Agencies
Agencies such as Moody’s, Standard & Poor’s (S&P), and Fitch Ratings assess the creditworthiness of companies, governments, and financial instruments. Their ratings influence investor confidence, bond yields, and borrowing costs.
Role in Global Markets:
Facilitate informed investment decisions.
Help maintain transparency and discipline among borrowers.
Influence capital allocation by institutional investors.
However, rating agencies have faced criticism for conflicts of interest and their role in past financial crises, such as the 2008 global meltdown.
10. International Financial Institutions
Organizations such as the International Monetary Fund (IMF) and the World Bank play a stabilizing role in the global market.
The IMF:
Provides financial assistance to countries facing balance-of-payments crises and promotes exchange rate stability.
The World Bank:
Funds infrastructure and development projects in emerging economies to promote long-term economic growth.
Their involvement ensures global financial stability and supports developing nations in integrating into global markets.
11. Hedge Funds and Private Equity Firms
Hedge funds and private equity firms are specialized investment entities managing large pools of capital with flexible strategies.
Hedge Funds: Focus on generating high returns through trading and leverage.
Private Equity Firms: Invest directly in private companies or buy out public firms to restructure them.
They are crucial in improving corporate efficiency, promoting innovation, and influencing global capital allocation.
12. Conclusion
Global market participants collectively form the backbone of the world’s financial system. From individual investors to powerful institutions like central banks and sovereign wealth funds, each plays a unique role in shaping market behavior and economic outcomes. Their interactions drive capital flows, influence asset prices, and impact global growth and stability.
Understanding these participants helps explain how financial markets function and respond to economic, political, and technological changes. In an increasingly interconnected world, the balance between these entities determines the resilience and sustainability of the global financial ecosystem.
In essence, the global market is a dynamic arena where diverse participants—each with distinct motives and influences—interact to create a continuously evolving landscape of opportunity, competition, and innovation.

Derivatives and Risk Management in the Global Market1. Understanding Derivatives
A derivative is a financial contract whose value is derived from the performance of an underlying asset, index, rate, or event. The underlying asset can be anything with a fluctuating market value—such as stocks, bonds, commodities, currencies, or interest rates. Derivatives do not represent ownership of the underlying asset; rather, they are agreements to exchange cash flows based on the asset’s future price movements.
The four primary types of derivatives are:
Futures – Standardized contracts traded on exchanges, obligating parties to buy or sell an asset at a predetermined price on a future date.
Forwards – Customized over-the-counter (OTC) agreements similar to futures but negotiated privately between parties.
Options – Contracts that give the buyer the right (but not the obligation) to buy or sell an asset at a specific price within a set time frame.
Swaps – Agreements between two parties to exchange cash flows or other financial instruments, often used to manage interest rate or currency exposure.
Each of these instruments serves different strategic purposes—ranging from speculation and arbitrage to hedging and portfolio diversification.
2. Evolution of the Global Derivatives Market
The global derivatives market has grown exponentially over the past few decades. Initially, derivatives were developed to help agricultural producers hedge against crop price volatility. However, with the advent of modern finance and technology, they have expanded into nearly every sector of the global economy.
By the early 2000s, derivatives trading had moved from traditional exchanges to sophisticated electronic platforms, and the notional value of outstanding derivatives had reached hundreds of trillions of dollars. Today, the global derivatives market includes both exchange-traded derivatives (ETDs) and over-the-counter (OTC) derivatives, with the latter representing the majority of global trading volume due to their flexibility and customization.
Regulatory reforms following the 2008 financial crisis, such as the Dodd-Frank Act in the U.S. and EMIR in Europe, have made derivatives trading more transparent, requiring central clearing and reporting to mitigate systemic risks.
3. The Role of Derivatives in Risk Management
The primary purpose of derivatives is risk management. In an unpredictable global economy, price volatility in commodities, currencies, interest rates, and equities can pose significant threats to profitability and financial stability. Derivatives provide tools for hedging—reducing exposure to unwanted risks while allowing firms to focus on their core operations.
a. Currency Risk (Foreign Exchange Risk)
In international trade, companies deal in multiple currencies. Exchange rate fluctuations can significantly impact profits. For instance, an Indian exporter receiving payment in U.S. dollars can use currency forwards or options to lock in an exchange rate, ensuring predictable revenue even if the rupee appreciates later.
b. Interest Rate Risk
Banks, financial institutions, and corporations with loans or debt instruments face exposure to changes in interest rates. Interest rate swaps are widely used to manage this risk—allowing companies to exchange fixed-rate obligations for floating-rate ones, or vice versa, depending on market conditions.
c. Commodity Price Risk
Producers and consumers of commodities such as oil, gold, or agricultural products use futures contracts to hedge against price volatility. For example, an airline company may use oil futures to stabilize fuel costs, protecting itself from rising crude prices.
d. Equity Market Risk
Investors in stock markets can use equity options and index futures to hedge portfolio risks. For example, if a fund manager expects market volatility, purchasing put options can provide downside protection.
4. Speculation and Arbitrage
While risk management is the core function, derivatives are also used for speculation and arbitrage.
Speculators seek to profit from price movements without owning the underlying asset. For instance, traders may buy a futures contract anticipating a price increase.
Arbitrageurs exploit price discrepancies between markets or instruments. For example, if gold futures in London are priced differently than in New York, an arbitrageur can buy low and sell high simultaneously to earn a risk-free profit.
Although speculation adds liquidity and efficiency to markets, excessive leverage through derivatives can lead to systemic risks if not properly managed—as seen during the 2008 crisis.
5. Risks Associated with Derivatives
Despite their advantages, derivatives carry inherent risks that can amplify losses if misused.
Market Risk: Adverse price movements can result in significant financial losses.
Credit (Counterparty) Risk: In OTC derivatives, one party may default on its obligation.
Liquidity Risk: Some derivatives are hard to unwind due to low trading volumes.
Operational Risk: Errors, fraud, or system failures can cause unexpected losses.
Systemic Risk: Large interconnected derivative exposures can threaten global financial stability, as was evident in the collapse of Lehman Brothers in 2008.
6. Regulatory Reforms and Risk Controls
Following the global financial crisis, regulators worldwide introduced measures to make derivative markets more transparent and secure. Key reforms include:
Central Clearing: Mandating that standardized OTC derivatives be cleared through central counterparties (CCPs) to reduce counterparty risk.
Trade Reporting: Requiring all derivative transactions to be reported to trade repositories for transparency.
Margin Requirements: Imposing collateral requirements on non-centrally cleared derivatives to mitigate credit exposure.
Position Limits: Restricting speculative trading positions to prevent market manipulation.
Organizations like the International Swaps and Derivatives Association (ISDA) have also established standardized documentation and practices that enhance global consistency and reduce legal uncertainties.
7. Derivatives in Emerging Markets
Emerging economies such as India, China, and Brazil have increasingly integrated derivatives into their financial systems. For instance, the National Stock Exchange (NSE) of India is among the world’s largest derivatives exchanges, offering futures and options on indices, equities, and commodities. These instruments help local businesses manage currency volatility, interest rate exposure, and commodity price risks more effectively.
However, emerging markets face challenges such as limited liquidity, regulatory inefficiencies, and lack of market awareness among smaller investors. Continuous education and strong regulatory oversight are essential for sustainable growth.
8. Technological Innovations in Derivatives Trading
Technology has transformed the global derivatives landscape. Electronic trading platforms, algorithmic trading, and blockchain-based smart contracts have made derivatives trading faster, cheaper, and more transparent.
Blockchain and Smart Contracts: Enable automated settlement and verification, reducing counterparty and operational risks.
Artificial Intelligence and Analytics: Help institutions predict market movements and manage complex derivative portfolios.
Cloud Computing: Facilitates real-time risk monitoring and regulatory compliance across global markets.
These innovations are reshaping how institutions manage derivative risks and opportunities.
9. The Future of Derivatives and Risk Management
The global derivatives market continues to evolve in response to new financial products, geopolitical changes, and sustainability challenges. A growing trend is the emergence of climate derivatives and carbon credits, which allow businesses to hedge against environmental and regulatory risks. As ESG (Environmental, Social, and Governance) investing gains traction, derivatives will play a key role in financing green initiatives and managing sustainability-related risks.
Moreover, the integration of AI-driven risk models and real-time data analytics will further enhance the precision and responsiveness of global risk management systems.
Conclusion
Derivatives are the cornerstone of modern financial risk management. They empower corporations, investors, and governments to safeguard against uncertainties while facilitating efficient capital allocation and price discovery in global markets. However, their complexity requires robust understanding, disciplined use, and stringent regulatory oversight. When applied responsibly, derivatives strengthen financial stability, promote liquidity, and support the growth of the global economy.
In essence, derivatives are not merely speculative tools—they are vital instruments that, when managed prudently, transform financial uncertainty into strategic opportunity.
Foreign Market: Functions, Opportunities, and Challenges 1. Definition and Importance of the Foreign Market
A foreign market refers to any market outside a company’s home country where it sells goods or services, invests, or operates. It encompasses not only international trade in goods but also services, investments, intellectual property, and financial assets.
The importance of foreign markets lies in their ability to expand business horizons beyond domestic limitations. For firms, entering a foreign market means accessing new customers, diversifying risk, reducing dependency on one economy, and exploiting comparative advantages. For countries, it promotes economic growth, creates jobs, boosts innovation, and fosters cultural exchange.
2. Evolution of Foreign Markets
The evolution of foreign markets has been a journey shaped by trade routes, technological progress, and policy reforms. Historically, ancient civilizations such as the Greeks, Egyptians, and Chinese engaged in cross-border trade through the Silk Road and maritime routes.
In the modern era, the Industrial Revolution of the 18th and 19th centuries accelerated foreign trade by introducing mass production and improved transport systems. The 20th century witnessed the rise of multinational corporations (MNCs), globalization, and free trade agreements that connected economies more than ever before.
Today, digital platforms, e-commerce, and blockchain technology are transforming the landscape once again—making foreign markets accessible even to small businesses and entrepreneurs.
3. Structure of the Foreign Market
The foreign market can be divided into several interconnected components:
Foreign Exchange Market (Forex): The world’s largest financial market, where currencies are traded. It facilitates international trade and investment by allowing currency conversion and hedging against exchange rate risks.
International Goods Market: Involves the export and import of tangible products like machinery, oil, food, or electronics between countries.
International Services Market: Covers intangible goods such as banking, tourism, IT services, and education.
Capital and Investment Market: Facilitates cross-border investments, including Foreign Direct Investment (FDI) and Foreign Portfolio Investment (FPI).
Commodity Market: Trades raw materials like gold, crude oil, and agricultural products that are crucial for global production chains.
4. Major Participants in Foreign Markets
The foreign market is a dynamic ecosystem involving various stakeholders:
Governments: Regulate trade through tariffs, subsidies, and agreements to protect domestic industries or encourage exports.
Multinational Corporations (MNCs): Operate in multiple countries to access global markets, labor, and resources.
Financial Institutions: Banks and investment firms facilitate foreign exchange transactions, international loans, and trade financing.
Investors and Traders: Engage in buying and selling foreign assets to earn profits or diversify portfolios.
Consumers: Ultimately drive demand for imported goods and services, influencing trade patterns.
5. Entry Strategies for Foreign Markets
Businesses can enter foreign markets through several strategic methods depending on their goals, resources, and risk tolerance:
Exporting: The simplest method—selling domestically produced goods abroad.
Licensing and Franchising: Allowing foreign firms to use intellectual property, brand names, or business models in exchange for royalties.
Joint Ventures: Partnering with a foreign company to share ownership, risk, and profits.
Foreign Direct Investment (FDI): Establishing or acquiring production units in another country for long-term operations.
E-commerce Platforms: Leveraging online sales channels to reach international customers directly.
Each entry mode offers distinct advantages. For instance, exporting minimizes investment risk, while FDI offers greater control and long-term presence in the market.
6. Opportunities in the Foreign Market
Global markets provide a vast array of opportunities for businesses and investors:
Market Expansion: Companies can reach millions of new customers across different regions.
Cost Advantages: Outsourcing and offshoring help firms reduce production costs.
Innovation and Technology Transfer: Exposure to international competition drives innovation and technology exchange.
Portfolio Diversification: Investors can reduce risk by spreading assets across different economies.
Economic Development: Developing nations gain access to capital, employment, and infrastructure through FDI.
7. Challenges and Risks in the Foreign Market
While foreign markets offer opportunities, they also come with significant risks and challenges:
Exchange Rate Fluctuations: Currency volatility can affect profit margins.
Political and Legal Risks: Changes in government policies, trade restrictions, or instability can disrupt business operations.
Cultural Differences: Misunderstanding local customs and consumer behavior can hinder market success.
Tariffs and Trade Barriers: Import duties or quotas can make foreign products less competitive.
Economic Uncertainty: Global recessions or inflation can reduce demand for exports and impact investments.
Managing these risks requires careful planning, market research, and diversification.
8. Role of Global Institutions in Foreign Markets
Several international organizations play key roles in maintaining the stability and fairness of the global trading system:
World Trade Organization (WTO): Regulates international trade and resolves disputes between member nations.
International Monetary Fund (IMF): Provides financial stability and monetary cooperation.
World Bank: Supports economic development projects in emerging economies.
Regional Trade Blocs: Such as the European Union (EU), ASEAN, and NAFTA/USMCA, promote free trade and economic integration.
These institutions ensure that global markets operate on transparent, rules-based systems that promote sustainable growth.
9. Impact of Technology on Foreign Markets
Technology has revolutionized the functioning of foreign markets in several ways:
E-commerce and Digital Trade: Platforms like Amazon, Alibaba, and Shopify have globalized retail.
Blockchain and Cryptocurrency: Offer secure, decentralized ways to transfer money across borders.
Artificial Intelligence (AI): Enhances market analysis, logistics, and consumer targeting.
Fintech Innovations: Enable smoother cross-border payments and online banking.
Digital transformation has made it easier for small businesses and startups to enter foreign markets without the need for physical infrastructure.
10. The Future of Foreign Markets
The future of foreign markets lies in sustainable globalization, digital integration, and inclusive growth. Climate change, geopolitical shifts, and technological disruption will continue to reshape international trade patterns.
Emerging markets such as India, Brazil, Indonesia, and Nigeria are expected to play a larger role in global trade as they experience rapid industrialization and urbanization. Simultaneously, green finance, ESG (Environmental, Social, and Governance) standards, and digital currencies will redefine investment behavior in global markets.
To succeed in this evolving landscape, businesses must embrace innovation, cultural understanding, and adaptability.
Conclusion
The foreign market, once a domain for large corporations and wealthy nations, has now become a global platform accessible to everyone—from local entrepreneurs to digital startups. It is a living ecosystem shaped by economic policies, technology, culture, and consumer demand.
Understanding the foreign market is not just about knowing where to sell or invest—it’s about grasping the global pulse of trade, finance, and innovation. As globalization continues to evolve, the ability to navigate, adapt, and capitalize on foreign markets will determine which nations and businesses lead in the 21st century.
Global Financial Market: An In-Depth OverviewIntroduction
The global financial market is a vast and interconnected system that facilitates the flow of money and capital across national borders. It acts as the backbone of the world economy, enabling governments, businesses, and individuals to raise funds, invest, trade currencies, manage risk, and allocate resources efficiently. The financial market’s evolution, driven by technological advancements and globalization, has made it an essential component of modern economic activity.
Definition and Importance
A financial market is a platform where buyers and sellers engage in the trade of financial assets—such as stocks, bonds, currencies, commodities, and derivatives. When these transactions occur across countries and continents, it forms the global financial market. Its significance lies in enabling:
Efficient capital allocation, ensuring that funds move from savers to productive users.
Liquidity creation, allowing investors to easily buy or sell assets.
Price discovery, where the true market value of assets is determined.
Risk management, by providing hedging instruments and diversification opportunities.
Economic growth, by financing business expansions and innovation.
Structure of the Global Financial Market
The global financial market is not a single physical location but a network of interlinked markets operating 24 hours a day. It can be broadly classified into several segments:
1. Capital Markets
Capital markets deal with long-term financing instruments like stocks and bonds.
Equity Markets: Companies issue shares to raise funds, and investors trade these shares on exchanges such as the New York Stock Exchange (NYSE), London Stock Exchange (LSE), Tokyo Stock Exchange (TSE), and Bombay Stock Exchange (BSE).
Debt Markets (Bond Markets): Governments and corporations issue bonds to borrow money. Major bond markets include U.S. Treasuries, Eurobonds, and corporate bonds.
Capital markets are essential for wealth creation and corporate growth, linking global investors with firms seeking funding.
2. Money Markets
Money markets handle short-term debt instruments like Treasury bills, certificates of deposit, and commercial paper. These instruments typically mature within one year and are crucial for maintaining liquidity in the financial system. Central banks and large institutions participate actively in this segment to manage short-term funding and interest rates.
3. Foreign Exchange (Forex) Market
The foreign exchange market is the world’s largest financial market, with a daily turnover exceeding $7 trillion. It allows participants to trade currencies, facilitating international trade and investment. Major currencies such as the U.S. dollar (USD), euro (EUR), Japanese yen (JPY), and British pound (GBP) dominate the market. Forex trading operates 24 hours a day, connecting centers in London, New York, Tokyo, and Singapore.
4. Derivatives Market
Derivatives are financial instruments whose value is derived from an underlying asset, such as stocks, bonds, commodities, or interest rates. Common derivatives include futures, options, swaps, and forwards. They are used for hedging, speculation, and arbitrage. Exchanges like the Chicago Mercantile Exchange (CME) and Euronext play a major role in global derivatives trading.
5. Commodity Markets
Commodity markets facilitate the trading of physical goods such as oil, gold, silver, agricultural products, and industrial metals. The prices of these commodities are critical indicators of global economic health. Major exchanges include the London Metal Exchange (LME) and the New York Mercantile Exchange (NYMEX).
Key Participants in the Global Financial Market
The global financial system involves a diverse set of players, each performing specific roles:
Central Banks – Such as the U.S. Federal Reserve, European Central Bank (ECB), and Reserve Bank of India (RBI). They control monetary policy, regulate interest rates, and ensure financial stability.
Commercial Banks – Provide credit, handle deposits, and act as intermediaries for individuals and businesses.
Investment Banks – Specialize in underwriting securities, managing mergers and acquisitions, and facilitating market liquidity.
Institutional Investors – Include pension funds, mutual funds, hedge funds, and insurance companies that manage large pools of capital.
Retail Investors – Individual investors participating in stock and bond markets.
Corporations – Issue securities to raise funds for expansion and operations.
Governments – Borrow money by issuing bonds to finance public projects.
Regulatory Bodies – Like the U.S. SEC, India’s SEBI, and the UK’s FCA, which oversee transparency, fairness, and investor protection.
Global Financial Centers
Certain cities have become global hubs for financial activity due to their infrastructure, regulation, and innovation. The most influential centers include:
New York City (USA) – Home to Wall Street and major investment banks.
London (UK) – A leader in forex and derivatives trading.
Tokyo (Japan) – Asia’s financial powerhouse.
Hong Kong and Singapore – Bridges between Western and Asian markets.
Frankfurt (Germany) – The heart of European banking.
These centers operate across time zones, ensuring continuous global market activity.
Integration and Globalization of Financial Markets
The integration of global markets has been accelerated by:
Technological advancements, allowing real-time trading and digital transactions.
Liberalization of capital flows, reducing barriers to cross-border investment.
Growth of multinational corporations, which require global financing and hedging.
Global institutions, such as the International Monetary Fund (IMF) and World Bank, which stabilize and support financial systems worldwide.
This interconnectedness means that events in one country—such as interest rate hikes by the Federal Reserve or geopolitical conflicts—can influence asset prices and investor sentiment globally.
Benefits of the Global Financial Market
Efficient Resource Allocation: Funds are directed to productive sectors and projects.
Investment Opportunities: Investors can diversify across regions and asset classes.
Economic Growth: Access to global capital stimulates business expansion and innovation.
Liquidity and Flexibility: Continuous trading ensures easy entry and exit for participants.
Risk Management: Derivatives and hedging tools allow protection against volatility.
Risks and Challenges
Despite its benefits, the global financial market also poses significant challenges:
Volatility and Crises: The 2008 Global Financial Crisis and 2020 pandemic market crash highlight systemic risks.
Speculative Bubbles: Excessive speculation can inflate asset prices beyond fundamentals.
Currency Fluctuations: Exchange rate instability can disrupt trade and investment.
Regulatory Differences: Inconsistent global regulations can lead to loopholes and arbitrage.
Cybersecurity Threats: Increasing digitization exposes markets to cyberattacks and fraud.
Geopolitical Risks: Trade wars, conflicts, and political instability can influence investor confidence.
Technological Innovations in Financial Markets
The last two decades have witnessed transformative changes driven by technology:
Algorithmic and High-Frequency Trading (HFT): Enables automated trading at lightning speeds.
Fintech Revolution: Digital banking, blockchain, and cryptocurrencies are reshaping financial ecosystems.
Artificial Intelligence (AI): Used in risk management, fraud detection, and predictive analytics.
Decentralized Finance (DeFi): Allows peer-to-peer transactions without intermediaries, powered by blockchain.
These advancements enhance efficiency but also introduce new risks and regulatory challenges.
Regulation and Oversight
Global financial stability relies on effective oversight. Regulatory coordination among institutions like:
The International Monetary Fund (IMF)
The World Bank
The Bank for International Settlements (BIS)
The Financial Stability Board (FSB)
These bodies work to ensure transparency, prevent crises, and promote sustainable growth through guidelines and cooperation.
Future of the Global Financial Market
The future will likely be shaped by:
Sustainability and ESG investing, focusing on environmental and social responsibility.
Digital currencies, including Central Bank Digital Currencies (CBDCs).
Greater regulatory harmonization to manage cross-border risks.
Artificial Intelligence and Quantum Computing, further enhancing market efficiency.
As financial systems continue to evolve, maintaining stability while fostering innovation will remain a central challenge.
Conclusion
The global financial market is the lifeblood of the modern economy—linking nations, investors, and institutions in a complex web of transactions. It drives economic development, facilitates global trade, and shapes the wealth of nations. However, its interconnectivity also means that local shocks can quickly become global crises. Therefore, maintaining a balance between innovation, regulation, and risk management is crucial for a stable and inclusive global financial future.
What is bitcoin CME Gap? How to use BTC gap IndicatorWhat is bitcoin CME Gap? How to use BTC gap Indicator
The 'Gap' in the CME (Chicago Mercantile Exchange) futures market, which offers a glimpse into the movements of institutional investors, is one of the key indicators many professional traders watch closely.
1️⃣ What is the Bitcoin CME Gap?
CME is one of the primary avenues for institutional investors to access Bitcoin. However, the CME Bitcoin futures market closes over the weekend (from Friday afternoon to Sunday afternoon, Chicago time, USA). Additionally, there is a one-hour trading break after market close on weekdays.
Conversely, spot exchanges like Binance and OKX, which we commonly see, operate 24 hours a day.
This difference is where a 'Gap' occurs. Especially during weekends, when the break is longer, gaps tend to be larger.
Bearish Gap: Occurs when the opening price after the CME market closes is lower than the closing price. This means that the Bitcoin price fell in the spot market during the off-hours.
Bullish Gap: Occurs when the opening price after the CME market closes is higher than the closing price. This means that the Bitcoin price rose significantly in the spot market during the off-hours.
Abrupt Psychological Shift: This implies that investor sentiment leaned heavily towards one side during the weekend.
Unfilled Order Blocks: The gap area is interpreted as a region where potential unfilled orders (buy/sell pressure) may exist.
Gap Fill Phenomenon: Many traders believe in the adage "gaps get filled" and use it as a trading strategy. This suggests a tendency for the price to move in the opposite direction of the gap, eventually attempting to cover the gap area. However, this phenomenon is not 'mandatory', and whether a gap will be filled immediately or much later must be judged through various analyses.
2️⃣ Easily Find CME Gaps
The Bitcoin CME gaps multi-timeframe auto finder indicator automates CME candle analysis and displays it intuitively on the chart.
⚡Indicator Features and Usage
Multi-Timeframe Gap Detection: 5-minute, 15-minute, 30-minute, 1-hour, 4-hour, and even 1-day candles! It simultaneously detects and displays CME gaps occurring across various timeframes. Whether you're a short-term trader or a long-term investor, you can check gaps according to your trading style.
Automatic Box and Label Display: The detected gap areas are drawn as rectangular boxes on the chart. Bullish gaps are displayed in green tones, and bearish gaps in red tones, making them easy to identify at a glance. The size of each gap (%) is displayed as a label above its respective box.
Highlight Function: Large gaps above a set threshold (e.g., 0.5%) are highlighted with an emphasized color. 'Big gaps' can have a greater impact on the market, so they should be noted.
Chart Price Synchronization: The price of spot charts from other exchanges may differ from the CME futures price. This indicator adjusts the price of the gap boxes to the price level of the chart you are currently viewing via the "Chart_price" mode. By using the "Chart_price" mode, you can more intuitively grasp the price level of the gap box on the spot chart and make direct trading plans on the chart of another exchange you are viewing.
Real-time Alerts: You can receive real-time alerts when a new CME gap is detected. You can also set alerts to notify you only about gaps from a specific timeframe. This is extremely useful when you can't continuously watch the chart during weekends or specific times on weekdays.
3️⃣ Trading Strategies
💡Gap Fill Strategy:
When a Bullish Gap Occurs: If the price breaks above a bullish gap but then falls back into the gap area attempting to fill it, one might consider a long position near the bottom of the gap, or a short position if the price fails to rebound from the top of the gap. Alternatively, a strategy of considering a short position in a resistance zone before the gap is filled is also possible.
When a Bearish Gap Occurs: If the price breaks below a bearish gap but then rises back into the gap area attempting to fill it, one might consider a short position near the top of the gap, or a long position if the price fails to fall from the bottom of the gap. Alternatively, a strategy of considering a long position in a lower support zone before the gap is filled is also possible.
💡Utilizing as Support/Resistance Areas:
Old CME gap areas can act as strong support or resistance lines when the price retests those levels in the future.
Observe whether the price encounters resistance and falls again when it reaches the top of a bearish gap, or if it finds support and rises again when it reaches the bottom of a bullish gap. Gaps that overlap across multiple timeframes can hold even stronger significance.
💡Trend Confirmation and Reversal Signals:
If a strong bearish gap occurs and is not immediately filled, but the price continues to fall, this could indicate the start or continuation of a strong downtrend.
If a strong bullish gap occurs and is not immediately filled, but the price continues to rise, this could indicate the start or continuation of a strong uptrend.
You can use the price movement after a gap occurs to gauge market momentum and apply trend-following or trend-reversal strategies.
For example, if a bearish gap occurs but is quickly filled within a few days and breaks above the top of the gap, this could be interpreted as an early sign that the bearish market has ended.
💡Multi-Timeframe Analysis:
When looking for key support/resistance levels, check not only the gaps of the current timeframe you are viewing but also gaps from higher timeframes (e.g., 4-hour or daily gaps on a 1-hour chart).
Gaps from larger timeframes are areas of stronger market interest. When making trading decisions in smaller timeframes, consider the location of important gaps from higher timeframes for risk management or to set entry/exit targets.
Short-term Gaps (5m, 15m): Most gaps occur within 1% and can be utilized for short-term volatility, high-leverage scalping, or day trading. They are suitable for quick entry/exit strategies, with caution against whipsaws. They tend to be filled before the 4-hour candle closes after the market opens.
Medium-term Gaps (1h, 4h): Can be referenced for swing trading or position trading. They can become significant support/resistance areas depending on price movement after the gap occurs.
Long-term Gaps (1d): Can act as major turning points in market trends or as important support/resistance levels from a long-term perspective. If a 'big gap' occurs, the possibility of a shift in the market's overall direction should also be considered. They usually occur during the weekend off-hours, and sometimes large gaps of over 3% occur.
A weekday short-term gap that was filled 4 hours ago.
A weekend long-term gap that saw a trend increase after a 4% big gap occurred.
4️⃣ Conclusion
The 'Bitcoin CME Gap Multi-Timeframe Auto Detector' indicator is a powerful tool that helps you not miss crucial price fluctuation points in the market.
However, no indicator should be blindly trusted. Gaps may not be fully filled, or the price may immediately break out in the opposite direction after surpassing a gap. Instead of relying solely on gap filling, it is crucial to analyze it in conjunction with other indicators to increase your win rate.
We hope you utilize the information gained from this indicator and combine it with your existing analysis methods (chart patterns, auxiliary indicators, macroeconomic analysis, etc.) to build more sophisticated trading strategies.
📌If this content was useful, please support us with a boost and comments. Your small encouragement is a great strength for creating better analyses and content. By following, you can also receive notifications about our postings

Dark Pools & Position Trading for Monthly IncomeHow Dark Pools Create Monthly Income Opportunities for Position Trading
Dark Pools create a tight sideways trend I call a "Platform" because the highs and lows within the sideways trend are very consistent and form a trend that is wider than a consolidation but narrower than a typical sideways trend which lacks the consistent highs and lows of a platform.
Position Hold trading holds the stock longer than Swing trading, and thus generates higher profits over time.
When markets are stressed, or when retail groups are sidelined due to fears of an event that has not happened yet, or due to problems with their swing or day trading, then the Dark Pool Buy Zones appear as the retail groups' trading does not disrupt the Buy Zone range of price.
Position-style Trading is a good transitional short-term trading style for long-term investors who are just starting to learn how to trade stocks for monthly income. It has much lower risk, takes less time, and is more forgiving of entry or math mistakes.

Emerging Markets vs. Developed Markets1. Definition and Core Characteristics
Developed markets, also known as advanced economies, are countries with high per capita income, diverse industrial bases, mature financial systems, and stable governance. Examples include the United States, Japan, Germany, the United Kingdom, Canada, and Australia. These nations typically exhibit consistent GDP growth, low unemployment, high standards of living, and robust infrastructure.
Emerging markets, on the other hand, refer to nations transitioning from developing to developed status. They possess fast-growing economies, rising income levels, improving infrastructure, and expanding industrial sectors. Examples include India, China, Brazil, South Africa, Indonesia, and Mexico. Although they experience higher growth potential, they also face greater economic and political risks compared to developed economies.
2. Economic Growth and Development Patterns
A defining difference between emerging and developed markets lies in their growth trajectories.
Developed Markets:
Growth in these economies is steady but slower, usually ranging between 1–3% annually. Since they already have established industries and saturated markets, economic expansion is mainly driven by innovation, technology, and services rather than basic infrastructure or manufacturing.
Emerging Markets:
These economies grow at a much faster pace, often 5–8% per year or more. Growth is fueled by industrialization, urbanization, and rising domestic consumption. For instance, India’s growing middle class and digital revolution are major drivers of its economic expansion. However, such rapid growth is often accompanied by volatility, due to political instability, fluctuating currencies, or changes in foreign investment trends.
3. Industrial and Sectoral Composition
Developed economies are service-oriented, with a significant share of GDP coming from finance, healthcare, technology, and education. For example, the U.S. economy is dominated by companies like Apple, Google, and Microsoft that symbolize the knowledge economy. Manufacturing remains important but is often outsourced to lower-cost regions.
Emerging economies, meanwhile, are production-driven, focusing on manufacturing, agriculture, and resource extraction. However, a gradual transition toward services and technology is underway. Countries like China and India are prime examples of economies moving from manufacturing-led growth to innovation-led development, with increasing emphasis on digitalization and sustainability.
4. Income Levels and Living Standards
One of the clearest distinctions between these two market types is per capita income.
Developed Markets:
These countries have high per capita GDP, often exceeding $40,000, accompanied by strong social welfare systems, high literacy rates, and excellent healthcare. The Human Development Index (HDI) is consistently high, reflecting better living standards and longer life expectancy.
Emerging Markets:
Per capita income is significantly lower, ranging between $5,000 and $15,000. However, income levels are rising rapidly due to economic reforms and industrial growth. Although inequality remains a concern, urbanization and globalization are improving access to education, healthcare, and employment opportunities.
5. Financial Markets and Investment Opportunities
Developed markets have deep, liquid, and mature financial systems, with stable currencies, advanced stock exchanges, and well-regulated banking sectors. Investors in developed markets usually enjoy lower risks but modest returns. For example, investing in the U.S. S&P 500 index offers steady long-term growth and low volatility.
Emerging markets, conversely, provide higher risk and higher reward opportunities. Their stock markets are often less efficient, meaning prices may not fully reflect all available information. This creates potential for outsized returns, especially for informed or institutional investors. However, challenges like currency volatility, regulatory unpredictability, and political risk can cause abrupt market swings.
For instance, while investing in Indian or Brazilian equities may yield double-digit returns during expansion phases, sudden policy shifts or inflation spikes can quickly erode gains.
6. Political and Institutional Stability
Developed nations usually maintain stable political systems, transparent legal frameworks, and efficient governance. Investors trust these systems because of predictable policies, strong property rights, and low corruption levels. This stability enhances long-term economic confidence.
In emerging markets, political and institutional environments are often less stable. Corruption, weak legal enforcement, and unpredictable regulations can pose serious risks. Nevertheless, many emerging economies are actively implementing reforms to strengthen democratic institutions, promote transparency, and attract foreign direct investment (FDI).
7. Infrastructure and Technology
Infrastructure is another area of sharp contrast.
Developed Economies:
Have world-class infrastructure — from advanced transport networks and reliable power supply to high-speed internet and digital governance. Technology adoption is widespread, and industries are at the forefront of innovation, artificial intelligence, and green technology.
Emerging Economies:
Often struggle with infrastructure gaps such as inadequate roads, unreliable electricity, or limited internet penetration, though rapid progress is visible. Countries like India and Indonesia are investing heavily in digital public infrastructure, renewable energy, and smart cities, aiming to bridge the gap with developed nations.
8. Demographics and Labor Markets
Emerging markets generally have younger populations with larger labor forces, providing long-term growth potential. This “demographic dividend” can be a major advantage if coupled with education and skill development. India, for example, is expected to have one of the youngest workforces in the world, fueling economic productivity for decades.
In contrast, developed countries face aging populations and shrinking labor pools, which pose challenges for social security systems and economic sustainability. These countries rely increasingly on automation, immigration, and productivity gains to offset demographic decline.
9. Global Trade and Integration
Developed markets dominate global trade, contributing a significant portion of global exports and imports. Their economies are highly integrated through multinational corporations and global supply chains.
Emerging markets are catching up fast, playing an increasingly crucial role in global trade. China’s rise as the “world’s factory” is a prime example. Moreover, emerging economies are forming regional alliances (like BRICS) to promote trade cooperation and reduce dependency on Western markets.
10. Risks and Challenges
While developed markets offer stability, they face slow growth, market saturation, and low interest rates, which limit investment returns. Political populism and high public debt in some regions (like the EU or Japan) also pose long-term challenges.
Emerging markets, on the other hand, face macroeconomic volatility, currency risks, political uncertainty, and dependency on global capital flows. External shocks—such as rising U.S. interest rates or global recessions—can trigger capital flight, weakening their currencies and economies.
11. Opportunities and Future Outlook
The future growth engine of the world economy is expected to come from emerging markets. With young populations, digital transformation, and expanding consumer bases, these nations are set to drive global demand for goods and services. By 2050, emerging economies like India, China, and Indonesia are projected to rank among the world’s largest economies.
However, developed markets will continue to lead in innovation, research, and governance, providing technological leadership and financial stability. The ideal global investment strategy may thus combine the stability of developed markets with the growth potential of emerging ones.
12. Conclusion
In summary, the contrast between emerging and developed markets lies not only in income and infrastructure but also in growth dynamics, risks, and opportunities. Developed markets represent stability, maturity, and innovation, while emerging markets symbolize growth, transformation, and potential. Together, they form a balanced ecosystem in the global economy — one driving advancement through stability, the other through dynamism and change.
For investors and policymakers alike, the key is to understand both sides — to appreciate the security of developed markets while harnessing the growth of emerging ones. In the decades ahead, the synergy between these two worlds will shape the future of global finance, trade, and prosperity.