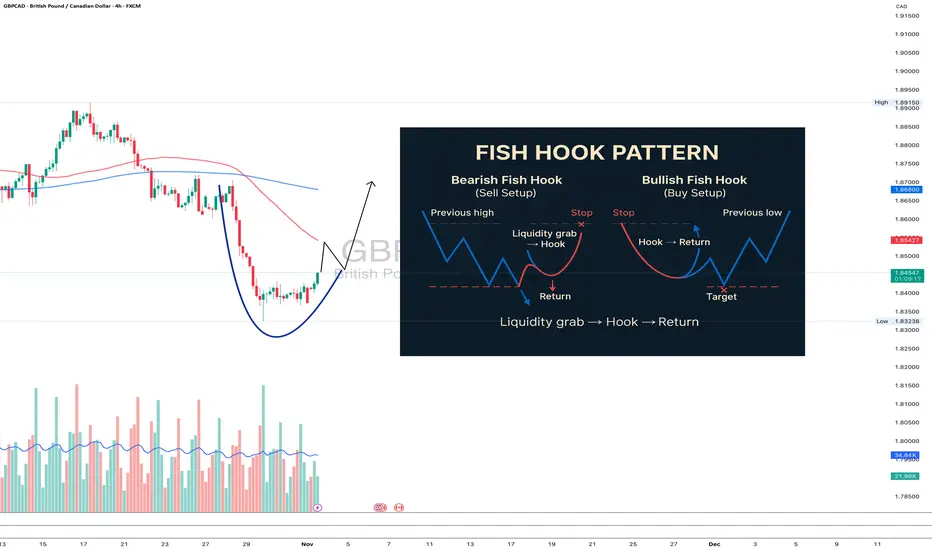
Fish Hook Pattern: the setup that catches liquidity, not tradersThere’s one pattern that never gets enough attention in textbooks, yet it’s one of the purest reflections of smart money logic - the Fish Hook.
It looks simple: price breaks out, triggers stops, traps breakout traders, and snaps back just as fast. But the psychology behind it is what makes it truly powerful.
When the market consolidates under a level, stop orders start to pile up. Big money knows that liquidity sits there - waiting to be taken. They push the price beyond the level, trigger the stops, and absorb liquidity. The breakout traders think they’ve caught momentum, but in reality, they’ve just become the exit liquidity.
Then comes the reversal - fast, decisive, emotional. That sharp return to the range is the “hook.”
If price breaks a key high or low and immediately rejects it - without structure, without a clean retest - you’re watching a Fish Hook in action.
The entry comes on the retest of that level from the opposite side. The stop goes right beyond the “hook’s tip.” Targets? The opposite edge of the range or the next liquidity pool.
The beauty of the Fish Hook lies in its simplicity. It’s not an indicator or a signal. It’s the behavior of money - watching how capital manipulates emotion.
When you start to see it often, you realize the market isn’t random. It’s intentional.
Trading becomes less about chasing candles and more about reading footprints. Fish Hook setups happen daily across pairs, stocks, and crypto and once you train your eye, you’ll never unsee them.
If your stops keep getting hit before the move - congratulations, you just met the Fish Hook from the wrong side.
Chart Patterns
AVOID LOSSES - BE SMART - LIVE ANALYSIS AVOID LOSSES - BE SMART - LIVE ANALYSIS
FRGNT
Be smart — avoid needless and pointless losses.
Anyone can trade, but what truly defines your return is your level of professionalism.
Use the facts to your advantage and build your bias using multiple sources of information. Build your confluence from correlating pairs, not just the pair you’re looking to trade.
Remember — GBPUSD, EURUSD, and AUDUSD are correlating.
So if you believe a trade is ready on one pair, but not showing the same readiness on the others, ask yourself: does this make sense?
Am I acting in line with a professional trader’s mindset?
Use the facts. Trade with logic. Think like a professional.
🔍 Analysis Approach:
I’m applying Smart Money Concepts, focusing on:
Identifying Points of Interest on the Higher Time Frames (HTFs) 🕰️
Using those POIs to define a clear trading range 📐
Refining those zones on Lower Time Frames (LTFs) 🔎
Waiting for a Break of Structure (BoS) for confirmation ✅
This method allows me to stay precise, disciplined, and aligned with the market narrative, rather than chasing price.
💡 My Motto:
"Capital management, discipline, and consistency in your trading edge."
A positive risk-to-reward ratio, paired with a high win rate, is the backbone of any solid trading plan 📈🔐
⚠️ Losses?
They’re part of the mathematical game of trading 🎲
They don’t define you — they’re necessary, they happen, and we move forward 📊➡️
🙏 I appreciate you taking the time to review my Daily Forecast.
Stay sharp, stay consistent, and protect your capital
— FRNGT 🚀

Global Payments RevolutionizedThe Transformation of Money Movement in the Modern Era
The global payments industry has undergone a remarkable transformation in recent decades. Once dominated by cash, checks, and manual bank transfers, today’s payment systems have evolved into fast, secure, and borderless networks driven by innovation, technology, and globalization. The shift from traditional to digital transactions has redefined how individuals, businesses, and governments interact financially. This revolution has not only simplified commerce but also expanded financial inclusion, improved transparency, and accelerated economic growth across the world.
1. The Historical Context of Global Payments
For centuries, global trade relied heavily on physical currency and paper-based systems. International trade payments involved cumbersome processes such as letters of credit, telegraphic transfers, and intermediary banks, often taking days or even weeks to complete. These systems were expensive, slow, and prone to fraud and error. As globalization intensified in the late 20th century, the need for more efficient, standardized, and secure payment systems became evident.
The introduction of credit cards, electronic fund transfers (EFT), and the SWIFT (Society for Worldwide Interbank Financial Telecommunication) network in the 1970s marked the first wave of modernization. SWIFT allowed banks to communicate securely about international payments, while card networks like Visa and Mastercard made cross-border consumer transactions simpler. However, true transformation came with the rise of the internet and digital technologies in the 21st century.
2. Digital Transformation and Fintech Disruption
The emergence of financial technology (fintech) startups in the 2000s redefined the payments ecosystem. Traditional banks faced competition from nimble, tech-driven firms offering faster, cheaper, and user-friendly payment solutions. Companies like PayPal, Stripe, and Square introduced digital payment systems that allowed seamless online transactions, transforming e-commerce globally.
Mobile payment platforms, such as Apple Pay, Google Pay, and Samsung Pay, enabled consumers to make purchases with just a tap of their smartphones. Peer-to-peer (P2P) transfer apps like Venmo, Cash App, and Revolut made splitting bills or sending money internationally almost instant.
Fintech innovation has also driven down transaction costs and improved accessibility. Through digital wallets, even unbanked populations in developing regions can participate in the global economy. For example, M-Pesa in Kenya revolutionized financial inclusion by enabling millions to send, receive, and save money via mobile phones without traditional bank accounts.
3. Rise of Real-Time Payment Systems
One of the most significant advances in modern payments has been the adoption of real-time payment (RTP) systems. Unlike traditional bank transfers that may take days, RTP enables instant fund settlement, 24/7. Countries like the U.K. (with Faster Payments), India (with UPI – Unified Payments Interface), and Brazil (with Pix) have set global benchmarks for efficient domestic payment systems.
India’s UPI, launched in 2016, has become a global model for digital transactions. It allows users to transfer money instantly across different banks using a mobile device, supporting billions of monthly transactions. The success of such systems has inspired other nations to modernize their infrastructure, leading to initiatives like the European Union’s SEPA Instant and the U.S. FedNow system.
These innovations have also enhanced cross-border payment efficiency, allowing businesses to settle invoices, pay suppliers, and manage global operations with unprecedented speed.
4. Blockchain and Cryptocurrency: The Next Frontier
The emergence of blockchain technology and cryptocurrencies such as Bitcoin, Ethereum, and stablecoins has redefined the meaning of global payments. Blockchain’s decentralized ledger allows transactions to be verified and recorded without intermediaries, reducing costs and increasing transparency.
Cryptocurrencies enable near-instant cross-border transfers, bypassing traditional banking channels that often charge high fees. Stablecoins, digital tokens pegged to fiat currencies, provide the stability needed for practical payment use.
Moreover, central bank digital currencies (CBDCs) are being developed globally as a government-backed alternative to private cryptocurrencies. China’s Digital Yuan, the European Union’s Digital Euro, and India’s Digital Rupee are examples of how national monetary authorities are embracing blockchain to modernize payment systems. These initiatives could further enhance financial inclusion and make international payments more secure and efficient.
5. E-commerce and the Rise of Global Payment Gateways
The global e-commerce boom has accelerated the demand for seamless international payment solutions. Platforms like PayPal, Stripe, and Adyen have made it possible for businesses to accept payments in multiple currencies while complying with local regulations.
Additionally, buy-now-pay-later (BNPL) services such as Klarna and Afterpay have transformed consumer behavior by allowing flexible payments without traditional credit cards. These digital solutions have expanded global consumer bases for businesses, enabling cross-border trade like never before.
In parallel, marketplaces such as Amazon, Alibaba, and Shopify have integrated payment gateways into their platforms, ensuring that sellers and buyers worldwide can transact effortlessly.
6. Security, Regulation, and Trust
With the expansion of digital payments comes the challenge of cybersecurity and regulatory compliance. Fraud, data breaches, and money laundering risks have increased, prompting governments and financial institutions to strengthen digital identity verification, encryption, and anti-money laundering (AML) measures.
Frameworks like PSD2 (Payment Services Directive 2) in Europe mandate strong customer authentication and promote open banking. Open banking allows third-party developers to build financial services around consumer data, further promoting innovation while maintaining security standards.
Consumer trust remains crucial, and innovations such as biometric authentication, tokenization, and AI-based fraud detection have made digital payments safer than ever.
7. Financial Inclusion and Socioeconomic Impact
One of the most profound impacts of the payment revolution is the expansion of financial inclusion. Digital payment platforms have brought millions of people—especially in Africa, Asia, and Latin America—into the formal financial system.
For small businesses and entrepreneurs, access to digital payments means access to credit, savings, and investment opportunities. Governments are also using digital payment infrastructure to deliver subsidies, pensions, and social welfare programs directly to citizens, reducing corruption and inefficiency.
The democratization of payments has empowered women, rural communities, and informal workers by giving them control over their finances, thus contributing to overall economic development.
8. The Future of Global Payments
The next decade of payments will likely focus on interoperability, sustainability, and AI-driven automation. Efforts are underway to connect domestic real-time systems globally through initiatives like the Bank for International Settlements (BIS) Project Nexus, which aims to create seamless cross-border payment corridors.
Artificial Intelligence and machine learning will continue to optimize fraud detection, customer experience, and transaction processing. Meanwhile, sustainability is gaining importance—digital payments reduce the carbon footprint associated with cash production and transportation.
Moreover, embedded finance, where payment capabilities are integrated directly into apps, vehicles, or devices, will make payments invisible and frictionless. For instance, electric vehicles might automatically pay for charging, or smart refrigerators could reorder groceries autonomously.
9. Challenges Ahead
Despite rapid progress, challenges persist. Many developing countries still face digital infrastructure gaps, internet connectivity issues, and limited financial literacy. Additionally, regulatory differences between countries complicate global payment interoperability.
There is also an ongoing debate about privacy and surveillance in digital payments, especially concerning CBDCs and data sharing. Balancing innovation, efficiency, and individual rights will be crucial as global payments continue to evolve.
10. Conclusion
The revolution in global payments represents far more than technological advancement—it symbolizes a transformation in how humanity exchanges value. From the days of barter and coins to instant digital transfers and decentralized currencies, payment systems have continuously adapted to the needs of global commerce and society.
Today’s payment revolution is breaking down economic barriers, fostering inclusion, and enabling a truly connected global economy. As technology continues to evolve—powered by blockchain, artificial intelligence, and open banking—the future of global payments promises to be faster, more inclusive, and more intelligent than ever before.
In essence, money is no longer just a medium of exchange—it has become a dynamic, digital ecosystem driving the next phase of global economic growth.

Startups Reshaping the Global Market1. The Startup Revolution: A Global Phenomenon
The startup ecosystem has evolved from being a niche community to a global economic force. Fueled by venture capital, digital connectivity, and technological progress, startups have transformed every sector—from finance and healthcare to transportation and energy. In many ways, they embody the spirit of the 21st-century economy: fast-moving, borderless, and data-driven.
Countries like the United States, India, Israel, China, and the United Kingdom have become major startup hubs, each contributing to the rise of global innovation. India, for instance, has over 100 unicorns (startups valued at over $1 billion), making it the third-largest startup ecosystem in the world. Similarly, regions in Africa, Latin America, and Southeast Asia are now producing startups that serve both local and international markets, contributing to inclusive global growth.
2. Technology as the Great Equalizer
One of the key factors enabling startups to reshape the global market is technology. The digital revolution has drastically lowered entry barriers for new businesses. Cloud computing, artificial intelligence (AI), blockchain, and the Internet of Things (IoT) have provided startups with tools to compete with global corporations without massive capital investments.
For example, fintech startups such as Revolut, Paytm, and Stripe have democratized financial services, enabling millions of unbanked or underserved people to access digital payments, loans, and investments. Similarly, Zoom and Slack revolutionized communication, empowering remote work and global collaboration.
These technological innovations not only improve efficiency but also reshape industries—blurring geographical boundaries and redefining what is possible in business and commerce.
3. Disruption Across Industries
Startups have introduced disruption as a permanent feature of global markets. They challenge established business models and force incumbents to innovate.
In transportation, companies like Uber, Lyft, and Grab transformed mobility through app-based ride-hailing, reshaping how people commute and think about car ownership.
In hospitality, Airbnb created a new asset-light model where ordinary homeowners could become hospitality providers, shaking up the hotel industry.
In retail, Shopify, Shein, and Temu have empowered small businesses and direct-to-consumer models, altering how brands reach global audiences.
In health tech, startups such as Practo, Teladoc, and Cure.ai have revolutionized telemedicine, diagnostics, and data-driven healthcare delivery.
This wave of disruption has compelled traditional players to adapt or perish. Giants like General Motors, Walmart, and even banks have been forced to adopt startup-like agility, investing heavily in innovation to remain competitive.
4. The Power of Data and AI
Artificial intelligence and data analytics have become the lifeblood of modern startups. With access to vast amounts of consumer data, startups can personalize experiences, predict trends, and automate processes.
For instance, Netflix and Spotify use algorithms to curate personalized entertainment experiences, reshaping how people consume content. Similarly, Bytedance (TikTok) leveraged AI-powered recommendation engines to redefine the global social media landscape.
Startups are not just using AI as a tool—they are shaping the ethics, regulation, and practical applications of AI across industries. Their innovations are influencing everything from healthcare diagnosis and logistics optimization to environmental monitoring and autonomous vehicles.
5. Globalization Through Digital Platforms
The internet has erased traditional boundaries, allowing startups to scale globally within months. Digital-first businesses such as Amazon, Alibaba, and Shopee have shown how online marketplaces can integrate suppliers, manufacturers, and consumers across continents.
Cloud-based services, digital payments, and e-commerce platforms have enabled startups in small nations to sell products and services globally. For example, a small design startup in Estonia or a fintech app in Nigeria can reach users in North America or Asia thanks to digital distribution and mobile technology.
This borderless expansion has also diversified global trade. Instead of being dominated by multinational giants, the digital economy now includes countless smaller, agile startups that serve specialized niches with global reach.
6. Sustainability and Social Impact Startups
In an era of environmental awareness and social responsibility, startups are also leading the charge toward sustainability. They are developing solutions that address climate change, waste management, renewable energy, and social inclusion.
Startups like Tesla, Beyond Meat, and Ola Electric have demonstrated how innovation can align profitability with sustainability. Similarly, Too Good To Go and Olio are tackling food waste through technology-driven community sharing models.
These startups represent a shift in global capitalism—from profit maximization to purpose-driven entrepreneurship. Investors, governments, and consumers now prioritize businesses that combine growth with environmental and social impact, reshaping the moral fabric of global markets.
7. Venture Capital and the Funding Ecosystem
Behind every successful startup lies an ecosystem of investors, incubators, and accelerators. Venture capital (VC) has played a critical role in nurturing innovation and scaling new ideas.
Global VC investments reached record highs in the 2020s, with firms like Sequoia Capital, SoftBank, and Andreessen Horowitz funding disruptive startups across continents. Beyond capital, these investors provide mentorship, networks, and strategic guidance.
Interestingly, new funding models such as crowdfunding and angel syndicates have democratized entrepreneurship. Today, even small investors can participate in early-stage funding, fostering a culture of innovation beyond traditional financial centers.
8. Startups and the Future of Work
Startups have redefined the workplace itself. They popularized flexible work cultures, remote operations, and gig-based employment. Platforms like Upwork, Fiverr, and Toptal have enabled millions of freelancers worldwide to participate in the digital economy.
The COVID-19 pandemic accelerated this trend, and startups were the first to adapt. They introduced tools and platforms that made remote work efficient and scalable. The result is a new global labor market—one that values skills over geography and innovation over hierarchy.
9. Challenges Facing Global Startups
Despite their success, startups face numerous challenges. Many struggle with scalability, regulatory compliance, and competition from well-funded incumbents. The global economic slowdown, fluctuating valuations, and rising interest rates have also made fundraising more difficult.
Moreover, startups that grow too fast without solid business fundamentals risk collapse—as seen in the cases of WeWork and FTX. Cybersecurity threats, data privacy issues, and talent retention further complicate the global expansion of startups.
Still, these challenges often fuel innovation. Startups continually evolve, learning from failures and adopting more sustainable growth models.
10. The Future: A Startup-Driven Global Economy
The influence of startups on the global market is only expected to grow. As emerging technologies such as quantum computing, biotech, and Web3 evolve, startups will continue to lead their commercialization. Governments are also recognizing the importance of fostering startup ecosystems, offering tax benefits, innovation grants, and infrastructure support.
In the coming decade, we can expect startups to drive the next wave of global economic transformation—creating smarter cities, cleaner energy systems, inclusive financial networks, and personalized digital services.
Conclusion
Startups are no longer the underdogs of the economy—they are its architects. Through relentless innovation, digital empowerment, and global collaboration, they are reshaping industries, societies, and the world economy itself.
From the smallest local app to the next global unicorn, startups symbolize the power of ideas in motion. As they continue to challenge the status quo and expand their reach, the global market will increasingly reflect their dynamism, creativity, and vision. In essence, the future of global trade and commerce is being written—not in boardrooms—but in the innovation labs, co-working spaces, and digital platforms of startups across the world.

Venture capital’s impact on the global trade marketHow VC affects global trade: the mechanisms
Financing innovation that changes traded goods and services.
VC funds back high-growth firms that commercialize new technologies — cloud computing, advanced manufacturing, fintech, biotech, logistics automation, and more. When those firms scale, they create new tradable goods and services (SaaS, precision-manufactured components, platform-enabled logistics). This changes the composition of trade: more intangible flows (software, data services, algorithms) and more niche high-value physical goods replace or complement traditional commodity exports.
Accelerating cross-border platformization.
Many VC-backed companies are platforms (marketplaces, payment networks, cloud providers) whose value increases rapidly with scale and cross-border adoption. Platforms reduce transaction costs for international trade — matching buyers and sellers, enabling payments, providing reputational signals, and coordinating logistics. As platforms spread, they lower entry barriers for SMEs to sell abroad, boosting smaller-scale cross-border commerce and diversifying trade flows.
Transforming supply chains and logistics.
VC funds startups that digitize procurement, inventory, freight matching, customs compliance, and last-mile delivery. Innovations such as real-time tracking, AI-driven demand forecasting, and digital freight marketplaces make supply chains more responsive and efficient, enabling just-in-time and cross-border manufacturing models that wouldn’t be feasible earlier. This increases the volume and complexity of trade while reducing friction and cost.
Enabling services trade and digital exports.
VC concentrates in sectors with low marginal-cost reproduction (software, digital media, professional services delivered online). This encourages countries and firms to export services rather than only goods. Digital exports scale quickly and change balance-of-trade dynamics: countries with strong VC ecosystems often become net exporters of digital services, platform access, and intellectual property.
Shifting where value is captured.
VC incentives — fast growth, winner-take-most dynamics — tend to cluster value capture into a handful of global hubs (Silicon Valley, Shenzhen, Berlin, Bengaluru). This concentration affects trade patterns: components and raw inputs might be sourced globally, but design, IP, and high-margin services concentrate in VC hubs, shifting where trade-related revenue accrues.
Mobilizing global capital and cross-border investment.
VC syndicates, limited partners, and crossover investors operate internationally. Cross-border VC flows channel capital into emerging markets, enabling local firms to scale for export and import substitution. Conversely, outbound VC by multinationals can seed ecosystems abroad that later integrate into global production networks.
Regional patterns and asymmetries
VC’s trade effects are uneven. Advanced economies with deep VC ecosystems tend to export high-value services, software, and specialized capital goods, while importing raw materials and standardized manufactured goods. Emerging markets often receive VC that helps them move up the value chain (e.g., fintech in Africa enabling cross-border remittances, or manufacturing startups in Southeast Asia adding localized tech to global supply chains). However, the scale and type of VC differ: early-stage consumer apps proliferate in populous markets, while deep-tech VC concentrates where research and IP protection exist.
Risks, distortions, and unintended consequences
Concentration and monopoly power.
VC’s “go big fast” model favors market concentration. Dominant platforms can extract rents, distort trade by locking sellers into their ecosystems, and raise barriers for competitors from other countries.
Short-termism and fragility.
Chasing growth sometimes prioritizes market share over sustainable trade relationships or resilient supply chains. VC-backed firms that expand rapidly but lack stable unit economics can fail, disrupting cross-border networks they had come to enable.
Uneven benefits and inequality.
Regions without VC access may be relegated to low-value segments of global value chains. Even within countries, VC-backed growth can widen gaps between digitally integrated exporters and traditional exporters.
Regulatory arbitrage and data flows.
VC-backed platforms often operate across jurisdictions with differing data, privacy, and competition rules. This can create regulatory tensions that affect trade in digital services and cross-border data transfers.
Overreliance on external capital.
Countries that depend on foreign VC inflows for digital export growth may be vulnerable to cyclical capital flows. A sudden retrenchment in global VC can stall export-oriented startups and compress trade.
Policy implications and responses
Invest in complementary assets.
Governments wanting to maximize trade benefits from VC should strengthen research institutions, IP frameworks, digital infrastructure, and skills training. These make local startups more likely to scale into export-capable firms.
Support inclusive access to VC and alternatives.
Programs to broaden investor access (local LPs, public co-investment, blended finance) can reduce regional disparities and keep value capture local. Supporting later-stage finance domestically helps startups mature without forced early exits.
Regulate to preserve competition and resilience.
Antitrust and data-governance policies should balance innovation incentives with prevention of monopolistic platform dominance that can distort trade. Similarly, policies encouraging supply-chain diversification and transparency improve resilience against startup failures.
Promote standards and cross-border agreements.
Trade agreements and harmonized digital regulations (data portability, e-invoicing, digital ID) reduce friction for VC-enabled cross-border services and platforms.
Mitigate risks of capital volatility.
Macroprudential tools, sovereign wealth participation in funds, or public venture vehicles can dampen boom-bust cycles that otherwise cascade into trade disruptions.
Conclusion
Venture capital significantly reconfigures global trade by financing innovations that change what is traded, how trade is organized, and who captures its value. Its power to accelerate platformization, digitization, and supply-chain optimization brings opportunities for growth, diversification, and inclusion — but it also concentrates value, introduces fragility, and can amplify inequalities without careful policy design. For countries and firms, the goal should be to harness VC’s dynamism while building institutions, regulations, and financing structures that spread benefits, preserve competition, and shore up the resilience of the global trade networks VC helps create.

Shipping, Freight, and Logistics in World Trade1. The Importance of Shipping in Global Trade
Shipping is the lifeline of international trade. Around 90% of world trade by volume is transported by sea, making maritime transport the most cost-effective and energy-efficient mode for moving large quantities of goods over long distances. Without global shipping, the modern economy would collapse—no country could sustain its industries or consumer demand without importing raw materials, energy, and manufactured products.
The shipping industry supports the global supply chain, linking developing nations that supply raw materials with developed economies that manufacture and consume finished goods. For instance, crude oil from the Middle East is transported to refineries in Asia and Europe, while electronics from East Asia are shipped to markets in North America and Africa. This interdependence underscores shipping’s role as the engine of globalization.
2. Understanding Freight in International Trade
Freight refers to the transportation of goods in bulk by various modes—sea, air, rail, or road. Freight services determine how products move from one point to another and how efficiently they reach their destinations. Freight is typically divided into three main categories:
Sea Freight – Used for large and heavy shipments, ideal for commodities such as oil, coal, grain, machinery, and vehicles. Containerization has revolutionized sea freight, enabling efficient and secure movement.
Air Freight – Offers the fastest mode of delivery, mainly for perishable or high-value items like electronics, pharmaceuticals, and luxury goods.
Land Freight (Rail and Road) – Connects ports to inland cities and neighboring countries, playing a vital role in regional trade and last-mile delivery.
Freight costs significantly affect product pricing and competitiveness in the global market. Efficient freight management reduces transportation costs and delivery times, making products more affordable and accessible.
3. The Role of Logistics in World Trade
Logistics refers to the planning, coordination, and management of the movement and storage of goods throughout the supply chain—from production to the final customer. It is the strategic process that integrates shipping and freight into a seamless operation.
Key elements of logistics include:
Transportation Management – Selecting the best mode of transport and optimizing routes.
Warehousing – Storing goods safely before they are distributed or sold.
Inventory Management – Ensuring supply meets demand without overstocking.
Customs Clearance – Handling documentation and compliance with international trade regulations.
Last-Mile Delivery – Delivering goods from distribution centers to consumers.
Modern logistics rely heavily on technology, including GPS tracking, warehouse automation, and data analytics, which provide real-time visibility and improve decision-making.
4. Evolution of Global Shipping and Logistics
The modern logistics industry has come a long way since the days of wooden ships and manual cargo handling. The container revolution in the 1950s, introduced by Malcolm McLean, transformed global trade. Standardized containers allowed goods to be loaded, shipped, and unloaded efficiently across ships, trains, and trucks, drastically reducing costs and time.
The digital revolution of the 21st century further enhanced logistics efficiency. Artificial intelligence, blockchain, and Internet of Things (IoT) technologies now streamline supply chains, track shipments in real time, and reduce human error. E-commerce giants like Amazon and Alibaba have set new standards in global logistics, emphasizing speed, reliability, and transparency.
5. Major Global Shipping Routes
World trade depends on critical maritime routes that connect producers and consumers. Some of the most vital shipping routes include:
The Suez Canal (Egypt): Links Europe and Asia via the Mediterranean and Red Seas.
The Panama Canal (Central America): Connects the Atlantic and Pacific Oceans, crucial for trade between the Americas and Asia.
The Strait of Malacca (Southeast Asia): One of the busiest routes connecting the Indian and Pacific Oceans.
The English Channel and Gibraltar Strait: Important for European trade.
Disruptions in these routes—such as the Suez Canal blockage in 2021—can cause massive delays and losses across global supply chains, showing how fragile yet essential maritime networks are.
6. Key Players in Global Shipping and Logistics
Several major companies dominate international shipping and logistics:
Shipping Lines: Maersk, MSC, CMA CGM, and COSCO handle millions of containers annually.
Freight Forwarders: DHL, FedEx, and Kuehne+Nagel provide end-to-end logistics solutions.
Port Operators: DP World, PSA International, and Hutchison Ports manage the world’s busiest ports.
Ports such as Shanghai, Singapore, Rotterdam, and Dubai’s Jebel Ali are global trade hubs, facilitating the import and export of goods worldwide.
7. Challenges Facing the Shipping and Logistics Industry
Despite its importance, the global shipping and logistics industry faces several challenges:
Supply Chain Disruptions: Events like the COVID-19 pandemic, wars, or natural disasters expose vulnerabilities in global supply chains.
Rising Fuel Costs: Shipping is heavily dependent on oil, and fluctuations in fuel prices directly affect freight rates.
Environmental Regulations: Pressure to reduce carbon emissions has forced the industry to invest in cleaner fuels and green technologies.
Port Congestion: Overcrowded ports lead to delays and increased costs, especially during peak trade periods.
Geopolitical Tensions: Trade wars and sanctions can reroute or restrict global shipping flows.
8. Green and Sustainable Shipping
Sustainability has become a key priority for the maritime industry. The International Maritime Organization (IMO) has set targets to reduce carbon emissions by 50% by 2050. Innovations such as LNG-powered ships, wind-assisted propulsion, and electric container vessels are being developed. Companies are also investing in carbon offset programs and exploring hydrogen fuel as a cleaner alternative.
Green logistics also focus on reducing waste, optimizing routes, and using eco-friendly packaging materials, contributing to a more sustainable global trade ecosystem.
9. The Future of Global Logistics
The future of logistics lies in automation, digitalization, and resilience. Emerging technologies are reshaping the industry:
Artificial Intelligence (AI): Enhances demand forecasting and route optimization.
Blockchain: Provides secure and transparent documentation for international transactions.
Autonomous Ships and Drones: Expected to revolutionize cargo transport and delivery.
Smart Ports: Use IoT sensors and data analytics to streamline operations.
Moreover, the rise of regional trade agreements and nearshoring (relocating production closer to consumers) is redefining supply chains to reduce risks and costs.
10. Conclusion
Shipping, freight, and logistics are the invisible engines powering world trade. They connect nations, support industries, and ensure that goods flow seamlessly across borders. As globalization deepens and technology advances, the logistics sector continues to evolve, balancing efficiency, sustainability, and resilience.
However, the challenges of environmental impact, geopolitical instability, and supply chain vulnerabilities demand innovation and cooperation. The future of global trade depends on a smarter, greener, and more adaptive logistics network—one capable of sustaining the demands of an interconnected world while protecting the planet for generations to come.
Successful Forex Trading1. Understanding the Forex Market
The forex market operates 24 hours a day, five days a week, across major financial centers like London, New York, Tokyo, and Sydney. Currencies are traded in pairs such as EUR/USD, GBP/JPY, or USD/INR, where one currency is bought while the other is sold.
Forex prices fluctuate due to various factors—economic indicators, geopolitical events, interest rate changes, and global demand for currencies. A successful trader understands that the forex market is influenced by both technical and fundamental dynamics.
2. The Foundation: Education and Knowledge
Knowledge is the backbone of successful forex trading. Before risking money, traders must learn how the market works, understand price action, and study trading tools. Beginners should grasp basic concepts such as:
Pips and lots: The smallest unit of price movement and standard trade size.
Leverage and margin: Borrowed capital that amplifies both profits and losses.
Bid-ask spread: The difference between the buying and selling price.
Stop-loss and take-profit: Tools to manage risk and lock in gains.
Reading books, taking courses, and following reliable market news sources like Bloomberg or Reuters can help traders stay informed. Continuous learning is vital, as market conditions and trading technologies evolve rapidly.
3. Developing a Solid Trading Strategy
A well-defined trading strategy is what separates successful traders from impulsive gamblers. Strategies can be short-term (scalping, day trading) or long-term (swing trading, position trading). Some of the popular trading strategies include:
Trend following – Identifying and trading in the direction of the market’s momentum.
Breakout trading – Entering trades when price moves beyond key resistance or support levels.
Range trading – Buying at support and selling at resistance during sideways markets.
News trading – Capitalizing on price volatility during major economic releases.
A successful trader tests strategies through backtesting (using historical data) and demo trading (using virtual money). This builds confidence before risking real funds.
4. Mastering Technical Analysis
Technical analysis helps traders forecast future price movements based on historical data. It involves studying charts, patterns, and indicators. Commonly used tools include:
Moving Averages (MA): To identify trends and smooth price fluctuations.
Relative Strength Index (RSI): To detect overbought or oversold market conditions.
Fibonacci Retracements: To identify potential reversal levels.
Candlestick Patterns: To reveal market sentiment through price behavior.
Technical analysis is most effective when combined with risk management and market psychology, rather than used in isolation.
5. Importance of Fundamental Analysis
While technical analysis focuses on charts, fundamental analysis examines the economic and political forces behind currency movements. Key indicators include:
Interest rates – Currencies with higher interest rates tend to attract more investors.
Inflation and GDP data – Indicate economic health and purchasing power.
Employment reports – Such as U.S. Non-Farm Payrolls, which can cause sharp volatility.
Geopolitical stability – Political crises can weaken a nation’s currency.
Successful traders often blend both technical and fundamental analysis to make informed trading decisions.
6. Risk Management: Protecting Capital
No matter how skilled a trader is, losses are inevitable. The key is to control risk so one bad trade doesn’t wipe out the account. Effective risk management includes:
Position sizing – Risking only 1–2% of trading capital per trade.
Stop-loss orders – Automatically closing trades at a predetermined loss level.
Diversification – Avoiding concentration in a single currency pair.
Avoiding over-leverage – High leverage amplifies both gains and losses.
Successful forex traders focus more on capital preservation than on quick profits. As the saying goes, “Take care of your losses, and profits will take care of themselves.”
7. The Psychology of Trading
Emotions are a trader’s biggest enemy. Fear and greed often lead to irrational decisions, like exiting trades too early or chasing losing positions. To succeed, traders must cultivate:
Discipline: Stick to the trading plan and rules consistently.
Patience: Wait for high-probability setups rather than forcing trades.
Confidence: Trust in analysis and avoid self-doubt after losses.
Emotional control: Accept losses as part of the process.
Maintaining a trading journal helps track performance, recognize emotional triggers, and improve over time.
8. Using Technology and Trading Tools
In today’s digital era, technology plays a massive role in forex trading success. Platforms like MetaTrader 4/5, cTrader, or TradingView offer real-time data, charting tools, and automated trading options.
Successful traders also use:
Economic calendars to track important news events.
Algorithmic trading systems for consistent execution.
VPS hosting to reduce latency for automated strategies.
Staying updated with fintech innovations gives traders a competitive edge in execution speed and market insight.
9. Continuous Improvement and Adaptation
The forex market is dynamic—strategies that worked yesterday may not work tomorrow. Therefore, traders must constantly adapt. Successful forex traders regularly:
Review past trades to learn from mistakes.
Refine strategies based on changing volatility or trends.
Stay updated on global economic developments.
Seek mentorship or community support to exchange insights.
Flexibility and adaptability ensure that traders survive both bullish and bearish cycles.
10. Building Long-Term Success
Successful forex trading is not about overnight riches—it’s about consistency, patience, and growth. The most successful traders:
Focus on steady returns rather than big wins.
Maintain discipline in both winning and losing streaks.
Keep records of all trades for analysis.
Continue to learn, adapt, and evolve with the market.
They treat trading as a business, not a hobby—an enterprise requiring planning, analysis, and emotional balance.
Conclusion
Success in forex trading is a journey that combines knowledge, discipline, strategy, and self-control. It’s not about predicting every market move but about managing risks and maximizing opportunities. A trader who focuses on education, follows a tested strategy, controls emotions, and practices sound risk management can thrive in the volatile world of forex.
The essence of successful forex trading lies in one rule: “Trade smart, not hard.” With persistence, patience, and proper planning, anyone can achieve consistent profitability and long-term success in the global forex market.
Forex Trading Secrets: The Hidden Keys of the Currency Market 1. Understanding the Core Mechanics of Forex
Before diving into strategies, it’s crucial to grasp how Forex truly works. Currencies trade in pairs, such as EUR/USD or USD/JPY, where one currency is bought while the other is sold. The movement of these pairs is driven by supply and demand, interest rate differentials, economic strength, and global political events.
Professional traders understand that the Forex market is not random — it responds to global economic forces and liquidity flows. The key secret is recognizing that Forex is a relative market — success depends not on whether a single economy is strong or weak, but how one performs relative to another.
2. The Power of Institutional Footprints
Retail traders often forget that big banks and institutions control 80% of Forex volume. These institutions move markets through large orders and sophisticated algorithms. They use tactics like stop-hunting, liquidity grabbing, and false breakouts to trap smaller traders.
A smart trader learns to read institutional footprints — areas where price repeatedly reverses or consolidates are often zones where large players enter positions. Watching for liquidity pools near major support and resistance levels can reveal where “smart money” is accumulating or distributing.
3. Mastering Technical Analysis — But With Simplicity
Most traders clutter their charts with too many indicators. Successful Forex traders rely on price action — the pure movement of price — rather than indicator overload.
Candlestick patterns, trendlines, and moving averages remain powerful tools when used wisely. The secret is to use confluence, or the alignment of multiple signals, before taking a trade. For example, if a bullish engulfing pattern appears at a long-term support zone along with an oversold RSI, that’s a higher-probability trade setup.
In short, simplicity beats complexity. The best traders use clear, minimal charts and focus on market structure, not prediction.
4. The Role of Fundamental Forces
Forex is heavily influenced by macroeconomic data such as inflation, GDP growth, interest rates, and employment figures. Central banks — especially the Federal Reserve, ECB, Bank of Japan, and Bank of England — play a dominant role in shaping currency direction.
The “secret” is to trade fundamental momentum, not news headlines. For instance, if the U.S. economy shows consistent strength and the Fed is hiking interest rates, the U.S. dollar tends to appreciate for months — not just during the news release.
Smart traders don’t chase volatility; they position themselves with the macro trend and ride long-term moves based on global monetary cycles.
5. The Secret of Risk Management
Risk management is perhaps the most guarded secret of professional trading. The best traders don’t win every trade; they protect capital so they can stay in the game.
Here are core risk rules:
Never risk more than 1–2% of your account on a single trade.
Always use a stop-loss to cap potential losses.
Calculate your risk-to-reward ratio — aim for at least 1:2, meaning you risk $1 to make $2.
Avoid overleveraging; high leverage can destroy an account quickly.
Remember: Forex success isn’t about being right all the time — it’s about making more on winners than you lose on losers.
6. Psychological Discipline — The Real Edge
Even with perfect analysis, traders often fail due to emotional trading. Fear, greed, and impatience are the true enemies of profit.
Winning traders cultivate discipline and emotional control. They follow their trading plan strictly, never revenge trade after losses, and avoid overconfidence after wins.
Keeping a trading journal is a secret weapon for developing discipline — it helps identify emotional patterns, bad habits, and areas for improvement.
In Forex, your mindset determines your success more than your strategy. As the saying goes, “Trading is 10% strategy and 90% psychology.”
7. The Power of Trading Plans and Backtesting
Every professional trader operates with a clear trading plan — a blueprint defining when to enter, exit, and manage trades. This plan includes:
Entry conditions (technical or fundamental signals)
Exit rules (take profit and stop loss)
Risk parameters
Market conditions to avoid (e.g., major news events)
Before going live, experts backtest their strategies using historical data to assess profitability. This process filters out weak setups and builds confidence. The secret here is consistency — following one well-tested method instead of jumping between strategies after every loss.
8. Liquidity Timing and Session Secrets
The Forex market operates across three main sessions: Asian, European, and U.S. Each has unique volatility and behavior.
The Asian session is typically slower and range-bound.
The London session brings high liquidity and strong trends.
The New York session overlaps with London, creating the most volatile moves of the day.
Seasoned traders know that the London-New York overlap (about 12:30 PM to 3:30 PM IST) offers the best opportunities for strong, sustained moves. Additionally, institutional traders often enter or exit positions around session opens — understanding these patterns can greatly improve timing.
9. Avoiding the Common Retail Traps
Most retail traders fail due to predictable mistakes:
Overtrading and using high leverage
Ignoring stop-losses
Trading during low-liquidity hours
Following social media “gurus” or random signals
Lacking patience for long-term growth
The secret is to trade like a business, not a lottery. Treat capital as inventory, risk as cost, and profits as sustainable growth. Focus on consistency, not overnight success.
10. Continuous Learning and Adaptation
The final secret of Forex mastery is lifelong learning. The market evolves as economies, technology, and monetary policies change. Even the best traders constantly adapt their systems.
Follow economic news, study macroeconomic trends, and refine strategies through experience. Many professionals also use algorithmic tools or AI-driven indicators to enhance precision — but they still rely on human judgment for execution.
The best traders stay students of the market forever. They don’t seek shortcuts; they seek understanding.
Conclusion: The Real Secret Behind Forex Success
In truth, there are no “magic” Forex secrets — only disciplined principles practiced consistently. Success comes from combining technical clarity, macro awareness, emotional discipline, and risk control.
The world’s top traders don’t predict the market — they react intelligently to what it shows. They know when to trade, when to wait, and when to walk away.
The real secret is patience and mastery of self. Once you control your emotions, respect risk, and understand market behavior, the Forex market becomes not a mystery — but a mirror reflecting your own discipline and intelligence.
In the end, Forex trading is not about beating the market — it’s about mastering yourself within it.
Spotting Inefficiencies in an Efficient MarketMarket Efficiency Theory;
Core Idea: Stock prices already include and reflect all available information.
Implication: It is very difficult (if not impossible) to consistently outperform the market because prices adjust quickly when new information appears.
Note: Markets are not perfectly efficient all the time — they can become inefficient in the short term due to emotions, news, or sudden events.
⚙️ Three Forms of Efficiency
Weak Form Efficiency
All past market prices and data are already reflected in current prices.
Therefore, technical analysis (chart patterns, trends) is useless because it can’t predict future prices.
Semi-Strong Form Efficiency
All public information (both technical and fundamental) is reflected in prices.
This means fundamental analysis (using financial statements, news, etc.) is also useless for gaining an edge.
Strong Form Efficiency
All information, including insider or private information, is already priced in.
So, no one can consistently outperform the market — not even insiders.
💡 Why Inefficiencies Exist
Markets aren’t perfectly efficient because human behavior and emotions often cause mispricing:
Investor emotions — Fear and greed can drive irrational buying or selling.
Market sentiment extremes — Overconfidence or panic can push prices too far.
Short-term behavioral mistakes — Herd mentality or cognitive biases lead to temporary inefficiencies.
🔍 Finding Inefficiencies
Although hard, traders can sometimes find and exploit short-lived inefficiencies:
Market sentiment indicators like VIX (volatility index) or put/call ratios signal extremes.
Seasonal trading strategies such as “Sell in May” patterns or year-end rallies.
Time arbitrage — taking advantage of short-term market overreactions.
Exploiting short squeezes when traders betting against a stock are forced to buy back.
⚠️ Difficult Markets for Traders
Some markets are naturally harder to trade efficiently:
Forex market: Highly competitive with huge volumes and professional players.
Commodities market: Often volatile and erratic due to unpredictable factors like weather, geopolitics, or demand shocks.
Conclusion:
Is it possible to find inefficiencies in the markets?
The markets are probably to a certain degree efficient, but we believe you can make good and consistent returns by using the right approach – which is to use empirical and quantified data for short-term strategies and by using common sense. Moreover, we believe the best place to start is in the stock market.
The markets are somewhat inefficient because of human folly. This is unlikely to change, which is good for the rational trader and investor. So the correct answer about inefficiencies is this: Yes, it’s possible to find inefficiencies in the markets.

Effects of Currency Wars on Forex MarketsIntroduction
Currency wars—also known as competitive devaluations—occur when countries deliberately devalue their currencies to gain trade advantages, stimulate exports, and support domestic economic growth. The term “currency war” was popularized in 2010 by Brazil’s Finance Minister Guido Mantega, who warned of nations engaging in deliberate exchange rate manipulation. In the modern forex (foreign exchange) market, where over $7 trillion is traded daily, the implications of such actions are vast and deeply interconnected with global economic stability.
This essay explores the origins, mechanisms, and multifaceted effects of currency wars on forex markets, examining both short-term and long-term consequences for traders, investors, and national economies.
1. Understanding Currency Wars
A currency war takes place when a country intentionally lowers the value of its currency relative to others to make its exports cheaper and imports costlier. The logic is straightforward: a weaker currency helps boost exports by making goods more affordable to foreign buyers, which can support domestic industries and job creation. However, it simultaneously raises import prices, which can lead to inflationary pressures.
Currency wars can emerge through monetary policy tools, such as:
Quantitative easing (QE): Central banks inject liquidity into the economy by purchasing government bonds, indirectly weakening the currency.
Interest rate cuts: Lowering interest rates makes the currency less attractive to foreign investors seeking higher yields, reducing demand.
Foreign exchange interventions: Direct buying or selling of foreign currencies to influence exchange rates.
While such policies can serve domestic goals, they often have international repercussions—triggering countermeasures from other nations and volatility in forex markets.
2. Historical Context of Currency Wars
Currency wars are not new phenomena. Understanding their history helps illustrate how they shape forex market dynamics:
1930s: The Great Depression Era
Many countries, including the U.S. and Britain, abandoned the gold standard and devalued their currencies to promote exports. This led to competitive devaluations, trade barriers, and worsened global economic conditions.
1980s: The Plaza Accord (1985)
In response to a strong U.S. dollar that was hurting American exports, major economies (U.S., Japan, Germany, France, and the U.K.) agreed to coordinate currency interventions to weaken the dollar.
Post-2008 Financial Crisis:
With the global financial meltdown, central banks worldwide adopted aggressive monetary easing policies. The U.S. Federal Reserve’s quantitative easing led to accusations of a “new currency war,” as emerging markets faced unwanted capital inflows and exchange rate appreciation.
These historical examples show how currency manipulation can trigger chain reactions in forex markets and global trade balances.
3. Mechanisms Through Which Currency Wars Affect Forex Markets
Currency wars impact forex markets through multiple transmission channels:
a. Exchange Rate Volatility
When countries engage in competitive devaluations, exchange rates fluctuate dramatically. For instance, if Japan devalues the yen through monetary easing, the U.S. dollar may appreciate, prompting other countries to adjust policies in response. This constant tug-of-war leads to instability in forex markets, affecting traders’ confidence and investment planning.
b. Capital Flows and Investor Behavior
Investors seek safe havens when volatility rises. During currency wars, capital often flows into stable currencies such as the U.S. dollar (USD), Swiss franc (CHF), or Japanese yen (JPY). This movement can distort global capital distribution, cause currency misalignments, and even impact emerging markets through capital flight.
c. Trade Balances
A nation’s trade balance is directly influenced by exchange rate movements. While a weaker currency may boost exports, if multiple countries devalue simultaneously, the competitive advantage disappears, leading to a “race to the bottom.” This disrupts global trade dynamics and can reduce overall demand for goods and services.
d. Inflationary and Deflationary Pressures
Currency devaluation raises the price of imported goods, leading to inflation. Conversely, countries facing appreciation (due to other nations’ devaluation) may experience deflationary pressures. Forex markets adjust accordingly, pricing in expectations of future central bank actions to control inflation or deflation.
4. Short-Term Effects on Forex Trading
In the short term, currency wars create fertile ground for traders seeking profit opportunities, but they also heighten risks.
a. Increased Market Volatility
Forex traders often witness sharp intraday moves during periods of competitive devaluation. For example, central bank announcements or interventions can cause sudden spikes in currency pairs, such as USD/JPY or EUR/USD, leading to both profit opportunities and losses for leveraged traders.
b. Speculative Positioning
Speculators in forex markets often take advantage of anticipated devaluations. If the market expects the euro to weaken due to the European Central Bank’s dovish stance, traders may short the EUR/USD pair. Such speculative flows can accelerate the very devaluation that policymakers seek to manage.
c. Safe-Haven Demand
During currency wars, uncertainty drives investors toward stable assets—gold, U.S. Treasury bonds, and safe-haven currencies like the CHF or JPY. This shifts forex demand patterns and alters global capital distribution temporarily.
5. Long-Term Effects on Forex Markets
While short-term volatility defines immediate reactions, long-term effects reshape global economic relationships and trading patterns.
a. Shifts in Currency Valuations
Prolonged currency wars may lead to sustained undervaluation or overvaluation of certain currencies. Persistent intervention by central banks (e.g., China’s managed yuan policy) can distort true market equilibrium, leading to imbalances that eventually correct violently.
b. Structural Changes in Forex Market Dynamics
Currency wars can encourage nations to diversify away from traditional reserve currencies. For instance, emerging economies may reduce reliance on the U.S. dollar and increase holdings in other currencies or commodities (like gold). This diversification affects long-term forex flows and liquidity distribution.
c. Impact on Global Confidence
Persistent currency manipulation undermines faith in fair trade and stable exchange rate mechanisms. Traders and multinational corporations face higher hedging costs to protect against unpredictable currency swings, making long-term contracts and investments riskier.
d. The Rise of Regional Currencies
As global currency tensions rise, regional trade blocs often move toward establishing independent payment systems or regional currencies to reduce exposure to forex volatility. The European Union’s euro and proposed BRICS currency are prime examples.
6. Case Studies of Currency Wars and Their Forex Impact
a. Japan’s Yen Devaluation (2012–2013)
Under “Abenomics,” Japan implemented massive quantitative easing to fight deflation and stimulate growth. The yen weakened sharply, boosting exports but triggering retaliatory rhetoric from other economies. The USD/JPY pair saw unprecedented volatility, attracting global forex traders and speculative capital inflows.
b. China’s Yuan Policy (2015–2019)
China’s central bank allowed a sudden yuan devaluation in 2015, sending shockwaves through forex markets. The move was seen as an attempt to boost exports amid slowing growth. The USD/CNY surged, global markets sold off, and emerging currencies weakened, reflecting how one nation’s policy can ripple across global forex systems.
c. U.S. Dollar Strength Post-QE (2014–2018)
When the Federal Reserve began tapering its QE program and raising interest rates, the dollar strengthened significantly. This created global capital outflows from emerging markets, which had previously benefited from U.S. liquidity. Forex markets saw heavy pressure on emerging currencies like the Indian rupee (INR), Turkish lira (TRY), and Brazilian real (BRL).
7. Implications for Traders and Investors
Currency wars reshape trading strategies, risk management, and portfolio allocation:
Hedging Becomes Crucial: Businesses and investors use derivatives—like forward contracts and options—to protect against currency risk.
Shift Toward Short-Term Trading: Increased volatility encourages short-term speculative trading rather than long-term investing.
Greater Dependence on Central Bank Guidance: Traders closely monitor policy statements, interest rate decisions, and quantitative easing announcements for cues on currency direction.
Diversification Across Currencies: Investors spread risk across multiple currency pairs to hedge against sudden policy shocks.
8. Policy and Regulatory Consequences
Central banks and international bodies often step in to prevent prolonged currency wars. The International Monetary Fund (IMF) and World Trade Organization (WTO) advocate for coordinated monetary policies to maintain global stability. Unchecked currency devaluations can lead to retaliatory tariffs, protectionism, and a breakdown of cooperative trade relations.
For instance, during the 2010–2013 currency tensions, the G20 nations agreed to refrain from “competitive devaluations,” emphasizing that monetary policies should focus on domestic stability rather than exchange rate manipulation. However, adherence remains inconsistent, especially during economic downturns.
9. Emerging Technologies and Currency Wars
In recent years, digital currencies and fintech have introduced new dimensions to currency competition. Central Bank Digital Currencies (CBDCs), like China’s digital yuan, could shift global forex dynamics by reducing dependency on traditional payment networks dominated by the U.S. dollar.
Moreover, cryptocurrencies like Bitcoin offer an alternative asset class immune to direct government manipulation, though their volatility makes them less suitable for trade settlements. As digital currencies grow, they could potentially neutralize some of the destabilizing effects of traditional currency wars.
10. The Future of Currency Wars and Forex Markets
As globalization deepens and economies become more interdependent, the consequences of currency wars grow more complex. Future conflicts may not involve overt devaluations but subtle forms of monetary manipulation—like prolonged negative interest rates or unconventional liquidity injections.
Traders and policymakers must adapt to an environment where monetary policy divergence, digital innovation, and geopolitical competition define forex market trends. Collaborative frameworks between major economies will be essential to prevent destructive cycles of devaluation that could undermine global economic recovery.
Conclusion
Currency wars are powerful forces that shape the global forex landscape, influencing everything from short-term market volatility to long-term investment flows. While devaluation can serve as a tool for economic recovery, uncoordinated competitive policies can trigger instability, inflation, and loss of global trust.
For forex traders, currency wars present both opportunities and risks—volatile price movements can yield profits but demand vigilant risk management. For policymakers, the challenge lies in balancing national interests with global stability.
In the interconnected world of modern finance, no currency moves in isolation. A single policy decision in Washington, Tokyo, or Beijing can reverberate across markets worldwide—reminding us that in a currency war, there are rarely true victors, only shifting tides in the global economic battlefield.

Reserves and Their Role in Controlling InflationIntroduction
Inflation — the sustained rise in the general price level of goods and services — is a central concern for every economy. When prices rise too quickly, purchasing power declines, savings lose value, and economic uncertainty increases. To manage inflation, policymakers and central banks rely on several tools, and reserves play a crucial role among them.
Reserves, in an economic and financial sense, refer to the assets or holdings that a central bank or a nation keeps to stabilize its currency, support the banking system, and influence liquidity in the economy. They are the backbone of monetary policy — providing a safety net during crises and a lever to control inflationary or deflationary pressures.
This article explores what reserves are, the types of reserves, how they interact with the broader economy, and most importantly, how they are used as instruments to control inflation.
1. Understanding Reserves
1.1 Definition
Reserves are the portion of assets that financial institutions or nations hold and do not actively circulate in the economy. They are typically kept in the form of:
Foreign exchange reserves (foreign currencies, gold, IMF Special Drawing Rights)
Bank reserves (funds held by commercial banks with the central bank)
Strategic reserves (such as oil or commodities held by governments for stability)
Monetary reserves (central bank’s holdings that back the issuance of currency)
In the context of inflation control, foreign exchange reserves and bank reserves are most relevant.
2. Types of Reserves and Their Economic Importance
2.1 Bank Reserves
Bank reserves refer to the cash or deposits that commercial banks hold with the central bank. These reserves are essential for meeting withdrawal demands, ensuring liquidity, and adhering to regulatory requirements.
Required Reserves: The minimum percentage of deposits that banks must hold and not lend out, set by the central bank.
Excess Reserves: Any reserves that banks hold beyond the required minimum.
2.2 Foreign Exchange Reserves
Foreign exchange reserves are assets held by a central bank in foreign currencies. These reserves include:
U.S. dollars, euros, or yen
Gold holdings
IMF’s Special Drawing Rights (SDRs)
These reserves help stabilize a nation’s currency and manage exchange rate volatility, both of which directly affect inflation levels.
2.3 Strategic Reserves
Governments often maintain reserves of essential commodities like crude oil, food grains, and fertilizers. These strategic reserves protect the economy from supply shocks, which could lead to cost-push inflation if shortages occur.
3. How Reserves Influence Inflation
Reserves act as a monetary control mechanism. By adjusting reserve requirements, managing liquidity, and using foreign reserves strategically, a central bank can control money supply — the key driver of inflation.
3.1 The Link Between Money Supply and Inflation
According to the Quantity Theory of Money, expressed as:
MV = PQ
Where:
M = Money supply
V = Velocity of money
P = Price level
Q = Output
If money supply (M) increases faster than economic output (Q), prices (P) rise — leading to inflation.
Hence, controlling money supply via reserves becomes a vital anti-inflationary tool.
4. Mechanisms: How Reserves Help Control Inflation
4.1 Reserve Requirement Ratio (RRR)
The reserve requirement is the percentage of deposits that banks must hold with the central bank and cannot lend.
When inflation is high, central banks increase the reserve ratio, reducing banks’ capacity to lend.
→ This decreases money supply and dampens spending, cooling inflation.
When inflation is low or the economy is slowing, the ratio is reduced to encourage lending and spending.
For example, if the Reserve Bank of India (RBI) raises the Cash Reserve Ratio (CRR), commercial banks have less liquidity to issue new loans, thereby reducing credit growth and inflationary pressure.
4.2 Open Market Operations (OMO)
Central banks use reserves to buy or sell government securities:
Selling securities → absorbs liquidity → reduces money supply → controls inflation.
Buying securities → injects liquidity → increases money supply → combats deflation.
Thus, OMOs are a dynamic way of using reserves to regulate inflation without drastic policy shifts.
4.3 Managing Foreign Exchange Reserves
Foreign reserves can indirectly control inflation through exchange rate management:
When a currency depreciates, import prices rise, increasing inflation (imported inflation).
Central banks can use foreign reserves to buy their own currency, strengthening it and reducing inflationary pressure.
Conversely, when inflation is low, the central bank may allow the currency to weaken slightly to boost exports and growth.
4.4 Sterilization Policy
When a country experiences large foreign capital inflows, it increases domestic money supply and may fuel inflation.
To counter this, central banks conduct sterilization — selling government securities to absorb the excess liquidity created by foreign inflows.
4.5 Interest Rate Adjustments Using Reserves
Reserves influence interbank liquidity, which affects interest rates.
When reserves are high, liquidity is ample, and short-term rates fall — boosting spending.
To control inflation, the central bank may reduce liquidity (through higher CRR or OMO sales), pushing up rates and discouraging borrowing.
5. Case Studies: Reserves in Action
5.1 India – Reserve Bank of India (RBI)
The RBI actively uses CRR and Statutory Liquidity Ratio (SLR) to control inflation.
For instance:
During the 2010–2011 period, when inflation crossed 9%, RBI raised CRR to restrict liquidity.
Conversely, in 2020 (pandemic period), RBI reduced CRR from 4% to 3% to ease liquidity and support economic recovery.
Additionally, RBI manages over $650 billion in forex reserves, which it uses to stabilize the rupee and prevent imported inflation caused by a depreciating currency.
5.2 United States – Federal Reserve System
The U.S. Federal Reserve influences inflation through reserve balances and open market operations.
During high inflation (e.g., post-2021 pandemic period), the Fed reduced excess reserves in the banking system through Quantitative Tightening (QT) — selling bonds and raising interest rates to control money supply.
5.3 China – People’s Bank of China (PBOC)
China maintains one of the world’s largest foreign exchange reserves (over $3 trillion).
It uses these reserves to:
Stabilize the yuan’s exchange rate
Control import-export price volatility
Manage inflation driven by currency movements
6. Relationship Between Reserves and Exchange Rate Stability
Exchange rate stability is directly linked to inflation control.
A strong domestic currency reduces the cost of imported goods and keeps inflation low.
A weak currency, on the other hand, makes imports expensive, triggering inflation.
By holding substantial forex reserves, central banks can intervene in currency markets — buying or selling domestic currency to maintain a stable exchange rate and prevent inflationary shocks.
7. The Role of Gold and Commodity Reserves
Gold reserves historically backed national currencies and still act as a hedge against inflation.
When inflation rises globally and fiat currencies lose value, central banks often increase gold reserves to preserve asset value and stability.
Similarly, commodity reserves like oil and grains help governments buffer supply-side shocks, which are a major cause of inflation spikes (e.g., oil crises or food shortages).
8. Challenges and Limitations
While reserves are powerful tools, their use in inflation control faces several challenges:
8.1 Limited Effectiveness in Supply-Side Inflation
Reserves can control demand-pull inflation (caused by excessive spending) but are less effective against cost-push inflation (caused by supply shocks like oil price hikes).
8.2 Risk of Over-tightening
Excessive tightening through high reserve requirements or OMO sales can stifle credit growth and economic expansion, leading to recession.
8.3 Foreign Exchange Volatility
Using forex reserves for inflation control via currency stabilization can deplete reserves quickly if global market pressures persist.
8.4 Sterilization Cost
Sterilization operations (offsetting capital inflows) can be expensive and may strain central bank balance sheets.
9. Coordinated Use of Reserves and Other Tools
For effective inflation management, reserves are used in conjunction with:
Interest rate policy
Fiscal discipline
Supply-side reforms
Targeted liquidity management
A well-coordinated monetary-fiscal framework ensures that reserves act as a stabilizing force rather than a reactive one.
10. Future Outlook: Reserves and Inflation in the Global Economy
In today’s interconnected world, inflation control is not just a domestic concern.
Global commodity prices, exchange rate fluctuations, and capital flows can all influence inflation levels.
As digital currencies, blockchain-based payment systems, and cross-border trade evolve, the composition and management of reserves will also transform.
Central banks may diversify away from traditional reserves like the U.S. dollar and hold multi-currency baskets, digital assets, or even climate-linked reserves to ensure sustainable control of inflation.
Conclusion
Reserves — whether held by central banks, governments, or financial institutions — form the foundation of monetary stability. They serve as both a defensive shield and an active instrument in combating inflation.
By managing bank reserves, foreign exchange holdings, and strategic commodities, policymakers can influence liquidity, exchange rates, and overall price stability.
However, the effectiveness of reserves depends on timely policy coordination, global conditions, and domestic fiscal discipline.
In essence, reserves are not merely a pile of assets — they are a reflection of a nation’s economic strength, policy credibility, and capacity to maintain price stability. Through prudent reserve management, central banks can ensure sustainable growth while keeping inflation under control — achieving the delicate balance every economy strives for.
Fundamental Analysis and Technical Analysis in the Forex Market1. Understanding the Forex Market
Before diving into the analytical methods, it’s important to grasp the nature of the forex (foreign exchange) market. Forex trading involves the simultaneous buying of one currency and selling of another — for example, buying the EUR/USD means buying euros while selling U.S. dollars.
Unlike stock markets that focus on individual companies, forex prices reflect macroeconomic conditions and the relative strength of nations’ economies. Therefore, both economic fundamentals and market psychology play vital roles in determining currency values.
2. What Is Fundamental Analysis in Forex?
2.1 Definition and Core Idea
Fundamental analysis in the forex market focuses on evaluating a country’s economic, financial, and political factors to determine the intrinsic value of its currency. It seeks to answer the question: “Is a currency undervalued or overvalued compared to another?”
Just as stock analysts study company balance sheets, forex traders study national balance sheets — economic growth rates, employment levels, inflation, trade balances, and monetary policies. These elements influence the demand and supply for currencies and ultimately drive long-term exchange rate trends.
3. Key Components of Fundamental Analysis
3.1 Economic Indicators
Economic indicators provide measurable data about an economy’s performance. Forex traders pay close attention to these releases because they directly impact currency strength.
Gross Domestic Product (GDP): A strong GDP growth rate indicates a healthy economy, attracting foreign investment and strengthening the currency.
Inflation Data (CPI, PPI): Central banks adjust interest rates based on inflation trends. Rising inflation often leads to higher rates, boosting currency value.
Employment Reports: Data like the U.S. Non-Farm Payroll (NFP) report shows labor market health. Higher employment typically signals economic expansion.
Retail Sales and Consumer Confidence: These reflect domestic demand and overall economic optimism.
Trade Balance: A trade surplus supports a currency as foreign buyers need to purchase the nation’s currency to pay for goods and services.
3.2 Central Bank Policies
Central banks such as the Federal Reserve (U.S.), European Central Bank (ECB), or Bank of Japan (BoJ) play a pivotal role in the forex market. Their monetary policies — especially interest rate decisions — are among the most influential drivers of currency movements.
Higher interest rates generally attract foreign capital inflows, strengthening the currency.
Lower interest rates discourage investment, leading to depreciation.
Traders carefully interpret central bank statements, interest rate announcements, and forward guidance to anticipate policy direction. Even subtle hints from central bank officials can trigger significant market reactions.
3.3 Political and Geopolitical Factors
Political stability and government policies influence investor confidence. Elections, trade negotiations, wars, or sudden leadership changes can cause volatility. For instance, Brexit negotiations in 2016 led to sharp fluctuations in the British pound (GBP), highlighting how geopolitics affect currency sentiment.
3.4 Global Events and Market Sentiment
Unexpected global developments — such as natural disasters, pandemics (e.g., COVID-19), or financial crises — can impact risk appetite and drive safe-haven flows. During uncertainty, investors often move funds into stable currencies like the U.S. Dollar (USD), Swiss Franc (CHF), or Japanese Yen (JPY).
3.5 Intermarket Analysis
Currencies don’t move in isolation. They are linked with other asset classes:
Rising commodity prices often strengthen commodity-linked currencies (e.g., AUD, CAD).
A strong stock market can indicate investor confidence, leading to higher-risk currencies.
Conversely, falling bond yields can weaken a currency due to lower returns.
Intermarket relationships help traders form a comprehensive view of market dynamics.
4. Advantages of Fundamental Analysis
Long-term Perspective: Provides insight into underlying economic trends, ideal for long-term investors.
Macro Understanding: Helps traders align with the broader economic cycle.
Informed Decision-Making: Reduces speculative risk by grounding trades in economic reality.
Predictive Power: Can anticipate major currency shifts driven by policy or growth changes.
5. Limitations of Fundamental Analysis
Complexity: Requires deep knowledge of economics and constant monitoring of multiple data points.
Delayed Impact: Economic fundamentals often influence prices over longer periods, making short-term timing difficult.
Unpredictable Reactions: Markets don’t always react logically to news; sentiment can override fundamentals.
Information Overload: With continuous data releases, it’s challenging to filter relevant information.
6. What Is Technical Analysis in Forex?
6.1 Definition and Philosophy
Technical analysis focuses on studying price charts, market patterns, and trading volume to forecast future price movements. It assumes that all fundamental information is already reflected in price and that market psychology repeats over time through recognizable patterns.
Instead of analyzing GDP or inflation, technical traders (often called chartists) rely on historical price action. They believe that “price is truth” and that market movements follow trends influenced by human behavior.
7. Core Principles of Technical Analysis
Market Discounts Everything: All available information — economic data, news, and expectations — is already priced in.
Prices Move in Trends: Currencies tend to move in identifiable trends rather than random patterns.
History Repeats Itself: Market patterns and investor behaviors are cyclical.
8. Major Tools of Technical Analysis
8.1 Chart Types
Line Chart: Simplifies data by connecting closing prices.
Bar Chart: Displays open, high, low, and close (OHLC) for each period.
Candlestick Chart: Popular among traders; shows price movements visually with color-coded candles.
8.2 Trend Analysis
Identifying trends is the cornerstone of technical analysis:
Uptrend: Series of higher highs and higher lows.
Downtrend: Series of lower highs and lower lows.
Sideways Trend: Prices move within a range, indicating market indecision.
Trendlines, moving averages, and channels help traders visualize and trade with the trend.
8.3 Support and Resistance
Support: A price level where demand exceeds supply, preventing further decline.
Resistance: A level where supply outweighs demand, preventing further rise.
These levels often act as psychological barriers where traders place buy or sell orders.
8.4 Technical Indicators
Technical indicators help quantify price action and provide signals.
Popular Indicators:
Moving Averages (MA): Smooth out price data to identify trends.
Relative Strength Index (RSI): Measures momentum and identifies overbought/oversold conditions.
MACD (Moving Average Convergence Divergence): Detects trend changes and momentum shifts.
Bollinger Bands: Measure market volatility using standard deviations from a moving average.
Fibonacci Retracement: Predicts potential reversal levels using mathematical ratios.
8.5 Chart Patterns
Patterns reflect market psychology and indicate potential reversals or continuations.
Reversal Patterns: Head & Shoulders, Double Top/Bottom.
Continuation Patterns: Flags, Pennants, and Triangles.
Traders use these formations to predict breakout directions and plan entries/exits.
8.6 Volume Analysis
Volume confirms price movement strength. Rising volume during a breakout suggests strong conviction, while declining volume indicates weakening momentum.
9. Advantages of Technical Analysis
Short-Term Precision: Ideal for intraday or swing traders seeking quick entries and exits.
Visual Clarity: Price charts provide immediate market insights.
Timing Tool: Helps identify entry and exit points efficiently.
Adaptable: Works across multiple markets and timeframes.
10. Limitations of Technical Analysis
Subjectivity: Different traders may interpret the same chart differently.
False Signals: Indicators may give misleading buy/sell signals in volatile markets.
Lagging Nature: Many indicators react to past prices rather than predicting future moves.
No Fundamental Context: It doesn’t account for unexpected economic or political events that can alter trends instantly.
11. Combining Fundamental and Technical Analysis
The most successful forex traders often combine both approaches — fundamental for direction, technical for timing.
For example:
A trader expects the U.S. Dollar to strengthen due to rising interest rates (fundamental view).
They wait for a bullish breakout on the USD/JPY chart to confirm entry (technical signal).
This combination allows traders to align economic logic with precise timing, improving accuracy and confidence.
12. Real-World Example: EUR/USD
Fundamental View: Suppose the European Central Bank announces an interest rate cut while the Federal Reserve maintains rates. This fundamental shift makes the euro less attractive, suggesting potential depreciation.
Technical View: The trader identifies a bearish head-and-shoulders pattern on the EUR/USD chart.
Combining both insights provides a strong case to short EUR/USD.
13. Choosing the Right Approach
Your choice depends on your trading style and time horizon:
Fundamental Traders: Prefer long-term positions, focusing on macroeconomic trends.
Technical Traders: Focus on short-term patterns, intraday trading, or scalping.
Hybrid Traders: Combine both to balance precision and context.
14. Conclusion
Both Fundamental Analysis and Technical Analysis are indispensable tools in the forex market.
Fundamentals reveal why a currency might move.
Technical analysis shows when it is likely to move.
While fundamental analysis offers insight into long-term value, technical analysis provides actionable entry and exit points. The key to mastery lies in blending both perspectives — understanding economic forces while respecting the market’s technical structure.
In essence, successful forex trading is not about predicting the future but about aligning probability, discipline, and timing. Whether you lean on data releases or chart patterns, the ultimate goal remains the same: to interpret the language of the market and trade with clarity, not emotion.
How Currency Trading Works1. Introduction
Currency trading, also called foreign exchange (forex or FX) trading, is the global process of buying and selling different currencies. It’s the largest financial market in the world, with over $7.5 trillion traded daily. The main goal is to profit from fluctuations in exchange rates between currencies — for example, buying euros and selling U.S. dollars if you believe the euro will strengthen.
Unlike stock exchanges that operate in specific locations, the forex market is decentralized and functions electronically through a network of banks, institutions, brokers, and traders. It operates 24 hours a day, five days a week, covering all major time zones — from Sydney to London to New York.
2. Structure of the Forex Market
The forex market operates over-the-counter (OTC), meaning there’s no central exchange. Trades occur electronically between participants worldwide. Key market participants include:
Central Banks: Influence currency values through interest rates and monetary policy.
Commercial and Investment Banks: Provide liquidity and handle large transactions.
Corporations: Exchange currencies for global trade and hedging.
Hedge Funds and Financial Institutions: Engage in large-scale speculation.
Retail Traders: Individuals trading through online brokers.
This decentralized structure ensures constant liquidity and continuous trading opportunities.
3. Currency Pairs and Exchange Rates
Currencies are traded in pairs, such as EUR/USD or USD/JPY.
The first currency is the base currency.
The second is the quote currency.
The exchange rate shows how much of the quote currency is needed to buy one unit of the base currency.
Example:
If EUR/USD = 1.1000, it means 1 euro = 1.10 U.S. dollars.
When a trader buys EUR/USD, they are buying euros and selling dollars, expecting the euro to rise. Selling the pair means expecting the euro to fall against the dollar.
4. Major, Minor, and Exotic Pairs
Currency pairs fall into three main categories:
Major Pairs: Include the U.S. dollar and another major currency like the euro, yen, or pound. (Examples: EUR/USD, USD/JPY)
Minor Pairs (Crosses): Don’t include the U.S. dollar. (Examples: EUR/GBP, GBP/JPY)
Exotic Pairs: Combine a major currency with one from a developing economy. (Examples: USD/INR, EUR/TRY)
Majors are the most liquid and widely traded, while exotic pairs are less liquid but often more volatile.
5. How Forex Trading Works
In forex trading, you buy one currency and sell another simultaneously. For example:
You buy EUR/USD at 1.1000 expecting the euro to rise.
If the rate increases to 1.1100, you can sell for a profit.
If it falls to 1.0900, you incur a loss.
This system allows traders to profit in both rising and falling markets — one of the key attractions of forex.
6. Bid, Ask, and Spread
Each currency pair quote shows two prices:
Bid price: Price at which you can sell the base currency.
Ask price: Price at which you can buy the base currency.
Spread: The difference between the two, representing the broker’s fee.
Example: EUR/USD = 1.1000 / 1.1002 → spread = 0.0002 (2 pips).
Tight spreads mean lower trading costs.
7. Leverage and Margin
Forex trading often involves leverage, which lets traders control large positions with small capital.
For instance, with 1:100 leverage, $1,000 can control a $100,000 position.
If the trade moves 1% in your favor, you gain $1,000; if it moves 1% against you, you lose the same amount.
While leverage boosts potential returns, it also magnifies risks — making proper risk management essential.
8. Fundamental Drivers of Currency Prices
Currency values are influenced by a mix of economic and political factors, including:
Interest Rates: Higher rates attract foreign investment, boosting demand for the currency.
Inflation: Low inflation strengthens a currency’s value.
Economic Growth: Strong GDP and employment data support currency appreciation.
Central Bank Policy: Actions by the Federal Reserve, ECB, or RBI directly move markets.
Trade Balance: Surpluses strengthen a currency; deficits weaken it.
Political Stability: Investors prefer politically stable nations.
Successful traders follow economic calendars and analyze these events to anticipate market reactions.
9. Technical Analysis
Apart from economic fundamentals, traders use technical analysis — studying price charts and patterns to forecast future moves.
Common tools include:
Support and Resistance levels – key price zones where markets tend to reverse.
Candlestick Patterns – like Doji, Engulfing, and Pin Bar.
Indicators – Moving Averages, RSI, MACD, Bollinger Bands.
Trendlines and Channels – to identify overall direction.
Technical analysis helps traders time entries and exits more precisely.
10. Trading Styles
Forex traders use different approaches depending on their risk tolerance and goals:
Scalping: Very short-term trades lasting seconds or minutes.
Day Trading: Positions opened and closed within the same day.
Swing Trading: Holding positions for days or weeks to capture medium-term moves.
Position Trading: Long-term approach based on macro trends.
Each style demands discipline, strategy, and awareness of market volatility.
11. The 24-Hour Forex Market
The forex market operates continuously across four major sessions:
Sydney Session: Opens early but with low volume.
Tokyo Session: Focused on yen and Asian pairs.
London Session: Most liquid and volatile; overlaps with other sessions.
New York Session: Active for USD-based pairs and overlaps with London.
The London–New York overlap (around 7 PM to 10 PM IST) is the busiest period with the most price action.
12. Role of Brokers and Trading Platforms
Retail traders access forex via brokers, who connect them to global liquidity providers. Brokers offer trading platforms like MetaTrader 4 (MT4), MetaTrader 5 (MT5), and cTrader, which display live prices, charts, and order tools.
Two main broker models exist:
ECN/STP Brokers: Directly route orders to the interbank market with transparent pricing.
Market Makers: Quote their own prices and act as the counterparty to trades.
When choosing a broker, traders look for tight spreads, fast execution, and strong regulation.
13. Risk Management
Because leverage and volatility are high in forex, risk management is critical.
Some essential practices include:
Stop-Loss Orders: Automatically limit losses when the market moves unfavorably.
Take-Profit Orders: Lock in gains at preset targets.
Position Sizing: Adjust trade size relative to account balance.
Avoiding Over-Leverage: Using excessive leverage can lead to rapid losses.
Emotional Discipline: Avoid chasing losses or impulsive trades.
Smart risk control ensures longevity in trading, even when not every trade is profitable.
14. Technology and Automation
Technology plays a huge role in modern forex trading.
Algorithmic trading systems and Expert Advisors (EAs) automatically execute trades based on programmed strategies.
AI and big data are increasingly used to analyze sentiment, volatility, and macroeconomic patterns in real time.
Additionally, mobile apps and online platforms have made trading accessible to millions of individuals worldwide.
15. Regulation and Legal Aspects
Due to its global nature, forex regulation varies across countries.
Major regulators include:
U.S.: CFTC and NFA
U.K.: FCA
Europe: ESMA
India: SEBI and RBI
In India, trading is allowed only through recognized exchanges like NSE or BSE, and only in INR-based pairs (USD/INR, EUR/INR, GBP/INR, JPY/INR). Offshore forex trading using foreign brokers is restricted under Indian regulations.
16. Pros and Cons of Currency Trading
Advantages:
High liquidity and 24-hour access
Low transaction costs
Opportunity to profit in both up and down markets
Low capital requirement due to leverage
Challenges:
High risk due to leverage and volatility
Emotional stress and discipline demands
Unpredictable geopolitical and economic shocks
Potential for scams in unregulated regions
Understanding both sides helps traders maintain realistic expectations and develop sustainable strategies.
17. Example of a Simple Trade
Let’s consider a practical example:
Suppose a trader believes that the British pound (GBP) will strengthen against the U.S. dollar (USD) due to better U.K. economic data.
They buy GBP/USD at 1.2500.
Later, the rate rises to 1.2600 — a 100-pip gain.
If the trader’s position size is $100,000, each pip is worth $10.
Profit = 100 pips × $10 = $1,000.
However, if the rate falls to 1.2400, the trader loses the same amount.
This shows how small movements can produce large profits or losses, especially with leverage.
18. The Psychology of Forex Trading
Beyond strategy, trading psychology determines long-term success.
Emotions like fear, greed, and impatience often lead traders to exit early or overtrade.
Maintaining discipline — sticking to a plan, accepting losses, and managing expectations — separates professionals from beginners.
Many traders adopt journals or checklists to review trades and control behavior.
19. Global Importance of Forex Trading
Forex plays a crucial role in the global economy by facilitating:
International trade and investment
Cross-border business operations
Hedging against currency risks
Global financial stability
Every multinational company, bank, and government depends on currency conversion — making forex the lifeblood of global commerce.
20. Conclusion
Currency trading is a dynamic, high-liquidity financial arena that connects economies across the world.
By understanding how currencies are traded, what drives their value, and how to manage risk effectively, traders can navigate this vast market with confidence.
However, success in forex isn’t just about knowledge — it requires patience, emotional balance, and continuous learning. When approached responsibly, currency trading offers a unique opportunity to participate in the heartbeat of the world’s financial system.
Types of Arbitrage Strategies in Global ExchangesIntroduction
In global financial markets, arbitrage represents the pursuit of risk-free or low-risk profits by exploiting price discrepancies between different markets, instruments, or timeframes. Traders, institutions, and algorithmic systems constantly monitor global exchanges for such inefficiencies. While arbitrage opportunities may exist only for a fraction of a second, the principle behind them remains timeless — buy low, sell high, but simultaneously and strategically.
Arbitrage is vital for ensuring market efficiency, liquidity, and fair pricing across borders. As global trading platforms become more interconnected, arbitrage has evolved from simple manual trades to complex algorithmic and statistical models involving multiple asset classes, currencies, and derivatives.
This article explores the major types of arbitrage strategies practiced in global exchanges, their mechanisms, challenges, and significance in modern markets.
1. Pure or Spatial Arbitrage
Pure arbitrage, also known as spatial arbitrage, is the most fundamental form. It occurs when an asset trades at different prices in two or more markets at the same time. The trader buys the asset from the cheaper market and sells it in the more expensive one.
Example:
If gold futures are trading at $2,000 per ounce on the New York Mercantile Exchange (NYMEX) and at $2,010 on the London Metal Exchange (LME), an arbitrageur can buy gold on NYMEX and sell simultaneously on LME to earn a $10 per ounce profit, excluding transaction costs.
Markets Where It Occurs:
Equities: Dual-listed stocks (e.g., Royal Dutch Shell listed in London and Amsterdam).
Commodities: Gold, oil, or agricultural commodities traded on multiple exchanges.
Currencies: Foreign exchange markets across different trading hubs like London, New York, and Tokyo.
Significance:
Pure arbitrage enforces price parity across exchanges and enhances market integration.
2. Statistical Arbitrage
Statistical arbitrage (StatArb) uses quantitative models and algorithms to identify pricing inefficiencies between related securities. Rather than relying on clear price differences, it depends on statistical correlations and mean-reversion principles.
Key Features:
Uses mathematical models, machine learning, and historical data.
Exploits temporary mispricings in correlated assets.
Positions are typically short-term and high-frequency.
Example:
If two historically correlated stocks like Coca-Cola (KO) and PepsiCo (PEP) diverge abnormally in price, a trader may go long on the undervalued one and short on the overvalued one, expecting convergence.
Used By:
Hedge funds (like Renaissance Technologies)
Quantitative trading firms
High-frequency traders
Benefits:
Works even in balanced markets (without visible price gaps)
High automation potential
Risks:
Model inaccuracy
Breakdown of historical correlations during volatile periods
3. Triangular Arbitrage (Currency Arbitrage)
Triangular arbitrage occurs in the foreign exchange (forex) markets when discrepancies arise between three related currency pairs.
Mechanism:
Traders exploit the mispricing among three currencies by converting them sequentially to lock in a profit, ensuring that the cross-exchange rates are consistent.
Example:
Assume:
EUR/USD = 1.2000
USD/GBP = 0.8000
EUR/GBP = 0.9600
The implied EUR/GBP rate should be (1.2000 × 0.8000 = 0.9600).
If the actual EUR/GBP rate is 0.9650, the trader can buy the undervalued currency and sell the overvalued combination, earning a small profit per cycle.
Significance:
Triangular arbitrage keeps exchange rates aligned across currency pairs in global forex markets. It also showcases the law of one price, ensuring consistent valuation across all trading hubs.
4. Index Arbitrage
Index arbitrage involves exploiting price discrepancies between a stock index and its constituent stocks or between the index futures and spot index.
Example:
If the S&P 500 futures are trading above the theoretical value implied by the underlying cash index, a trader can:
Sell futures
Buy all component stocks of the index
As the prices converge, the arbitrageur closes the positions, realizing a profit.
Technology Used:
Algorithmic trading platforms capable of executing thousands of trades within milliseconds to manage all underlying index components simultaneously.
Benefits:
Helps maintain equilibrium between the derivative and spot markets
Improves efficiency in index pricing
Challenges:
Requires high capital
Needs automated execution and low latency infrastructure
5. Merger or Risk Arbitrage
Merger arbitrage, also known as risk arbitrage, focuses on the price difference between the current market price of a company being acquired and the proposed acquisition price.
Mechanism:
When Company A announces plans to acquire Company B for $50 per share, but Company B’s stock trades at $47, the $3 difference reflects deal risk.
Arbitrageurs buy Company B’s shares expecting the deal to close and pocket the $3 gain when it does.
Types of Deals:
Cash mergers – Fixed payout, lower risk
Stock-for-stock mergers – Complex due to share exchange ratios and market volatility
Risks:
Deal may fail due to regulatory issues or financing problems
Delays can reduce annualized returns
Example:
During Microsoft’s acquisition of Activision Blizzard, risk arbitrage funds took long positions in Activision anticipating the regulatory approval would lead to price convergence with the offer.
6. Convertible Bond Arbitrage
Convertible bond arbitrage exploits mispricing between a company’s convertible bonds and its underlying stock.
Mechanism:
A convertible bond can be exchanged for equity at a preset conversion rate.
If the bond is undervalued relative to the stock, traders go long the bond and short the stock.
The strategy profits from bond yield and volatility adjustments, regardless of stock direction.
Used By:
Hedge funds specializing in credit and volatility markets.
Risks:
Credit risk of issuer
Interest rate changes
Liquidity risk in bond markets
Significance:
Balances pricing between equity and fixed-income instruments of the same issuer, enhancing cross-asset efficiency.
7. Cross-Border Arbitrage
Cross-border arbitrage involves exploiting price differences for the same asset or similar assets across different countries’ exchanges.
Example:
A stock listed in both the New York Stock Exchange (NYSE) and the Tokyo Stock Exchange (TSE) may trade at slightly different prices due to exchange rate fluctuations or trading hour differences. Traders use ADR (American Depositary Receipts) and GDR (Global Depositary Receipts) to execute such arbitrage.
Factors Affecting Prices:
Exchange rates
Tax policies
Market liquidity
Capital controls
Importance:
Encourages global price synchronization and helps maintain efficient capital allocation across regions.
8. ETF Arbitrage
Exchange-Traded Funds (ETFs) track indices or baskets of assets. When an ETF’s market price deviates from its Net Asset Value (NAV), arbitrage opportunities arise.
Mechanism:
If ETF price > NAV → Sell ETF, buy underlying assets.
If ETF price < NAV → Buy ETF, sell underlying assets.
Example:
If the SPDR S&P 500 ETF (SPY) trades at $501 while the index value is equivalent to $500, an arbitrageur sells SPY and buys the basket of S&P 500 stocks.
Who Performs It:
Authorized Participants (APs) such as large financial institutions that can create or redeem ETF shares in bulk.
Outcome:
Maintains price parity between ETFs and their underlying assets, ensuring accurate tracking performance.
9. Futures Arbitrage (Cash and Carry)
Cash and carry arbitrage involves exploiting differences between the spot price of an asset and its futures price.
Mechanism:
When futures are overpriced relative to spot, traders short futures and buy spot.
When futures are underpriced, they buy futures and short spot.
Example:
If crude oil trades at $80 (spot) and the 3-month futures are at $85, a trader can buy oil at $80, store it, and sell the futures at $85, locking in a risk-free return (adjusted for carrying costs).
Applications:
Common in commodities, currencies, and equity indices.
Impact:
Ensures futures contracts remain aligned with their underlying assets, enforcing cost-of-carry relationships.
10. Options Arbitrage
Options offer several arbitrage setups based on pricing inconsistencies between options and their underlying assets.
Common Strategies:
Put-Call Parity Arbitrage: Exploits violations of the relationship between call, put, and underlying asset prices.
Box Spread Arbitrage: Combines options to lock in a risk-free payoff.
Reverse Conversion Arbitrage: Uses options and underlying stock to capture overpricing in call or put options.
Example:
If put-call parity is violated (Call – Put ≠ Stock Price – Present Value of Strike), arbitrageurs construct synthetic positions to earn the difference.
Benefit:
Enhances derivative market efficiency and volatility pricing accuracy.
11. Cross-Asset Arbitrage
Cross-asset arbitrage identifies pricing inefficiencies across different asset classes such as equities, bonds, commodities, and derivatives.
Example:
When the movement in the oil market affects airline stock prices disproportionately, arbitrageurs may exploit the imbalance using statistical models.
Importance:
Promotes multi-market integration
Encourages price alignment across sectors
Helps in portfolio hedging and diversification
12. High-Frequency and Algorithmic Arbitrage
Modern arbitrage strategies rely heavily on high-frequency trading (HFT) and algorithmic systems capable of executing trades in microseconds.
Techniques Include:
Latency arbitrage (profiting from speed differences between exchanges)
Quote stuffing and order book imbalances
Cross-exchange liquidity scanning
Infrastructure Needs:
Co-location servers near exchange data centers
Low-latency networks
Advanced AI models for predictive execution
Impact:
Enhances liquidity and efficiency
Reduces price gaps
But also raises concerns about market fairness and flash crashes
Conclusion
Arbitrage is the heartbeat of global financial efficiency. From simple cross-market trades to complex algorithmic models, each type of arbitrage contributes to price uniformity, market liquidity, and systemic stability. While profit margins per trade are razor-thin, large-scale institutional participation and automation make it an essential function in maintaining balance across global exchanges.
However, with evolving technology, regulation, and competition, arbitrage has transitioned from being a manual opportunity to a data-driven discipline. Traders who understand not only the price discrepancies but also the structure of global markets, latency, and cross-asset relationships hold the edge in today’s interconnected world.
In essence, arbitrage ensures that no asset remains mispriced for long — making global markets fairer, more integrated, and efficient for all participants.
Understanding the Structure of Global Financial Markets1. Introduction: The Backbone of the Global Economy
The global financial market is the lifeblood of the world economy. It connects investors, governments, institutions, and corporations across borders, allowing capital to flow seamlessly where it is most needed. Whether it’s a farmer in India taking a loan, a startup in Silicon Valley raising funds through IPOs, or a central bank managing currency reserves, all these activities are influenced by the structure of the global financial system.
Understanding how these markets operate provides insight into how money moves, how wealth is created, and how economic growth is sustained. The structure of global financial markets is not just about trading stocks or currencies—it represents a vast ecosystem that includes banks, exchanges, institutions, and regulatory bodies working in tandem.
2. The Core Components of Global Financial Markets
The financial market is broadly divided into five major segments, each serving a unique function in the flow of funds and risk management.
a. Capital Markets
Capital markets are where long-term securities are bought and sold. They include:
Equity Markets (Stock Markets): Where companies issue shares to raise capital, and investors trade those shares. Examples include the New York Stock Exchange (NYSE), London Stock Exchange (LSE), and National Stock Exchange (NSE) of India.
Bond Markets (Debt Markets): Governments and corporations issue bonds to borrow money for development projects, infrastructure, or business expansion. Bonds provide investors with fixed returns and are a safer investment option compared to equities.
These markets are vital for economic development, as they help mobilize savings and channel them into productive investments.
b. Money Markets
The money market deals with short-term borrowing and lending, typically for periods less than one year. It provides liquidity to financial institutions, corporations, and governments.
Key instruments include Treasury Bills, Certificates of Deposit (CDs), Commercial Papers, and Repurchase Agreements (Repos).
Money markets are crucial for maintaining monetary stability and ensuring that businesses have access to working capital.
c. Foreign Exchange (Forex) Markets
The foreign exchange market is the largest and most liquid financial market in the world, with over $7 trillion traded daily. It enables the conversion of one currency into another and supports international trade and investment.
Participants include banks, hedge funds, corporations, and central banks.
For example, an Indian company importing goods from the U.S. must convert INR to USD, a process facilitated by the forex market.
d. Derivatives Markets
Derivatives are financial contracts whose value is derived from underlying assets like stocks, bonds, commodities, or interest rates. Common types include futures, options, forwards, and swaps.
These markets allow investors to hedge risks or speculate on price movements.
For instance, airlines use derivatives to lock in fuel prices, protecting themselves from price volatility.
e. Commodity Markets
The commodity market deals with the trading of physical goods such as oil, gold, natural gas, and agricultural products.
There are two major types:
Hard commodities: Metals and energy resources like crude oil or gold.
Soft commodities: Agricultural goods like coffee, sugar, and wheat.
Commodity prices often reflect global supply-demand imbalances and geopolitical tensions, making them a key indicator of economic health.
3. The Participants in the Financial Market Ecosystem
Global financial markets are powered by a diverse set of participants, each playing a specific role in ensuring efficiency, liquidity, and transparency.
a. Central Banks
Institutions like the Federal Reserve (U.S.), European Central Bank (ECB), and Reserve Bank of India (RBI) oversee monetary policy, control inflation, and maintain currency stability. Their interest rate decisions and liquidity measures have global ripple effects.
b. Commercial and Investment Banks
Banks serve as intermediaries between savers and borrowers. Investment banks, such as Goldman Sachs or Morgan Stanley, help corporations raise capital through stock or bond issuance and advise on mergers and acquisitions.
c. Institutional Investors
These include mutual funds, pension funds, insurance companies, and sovereign wealth funds. They manage large pools of money and play a dominant role in capital allocation and price discovery.
d. Retail Investors
With technological advancements and low-cost trading platforms, retail participation in global markets has surged. Platforms like Robinhood, Zerodha, and Interactive Brokers have democratized investing.
e. Regulatory Bodies
Regulators ensure market integrity, transparency, and investor protection.
Examples include:
SEC (U.S.) – Securities and Exchange Commission
FCA (U.K.) – Financial Conduct Authority
SEBI (India) – Securities and Exchange Board of India
These institutions enforce compliance and curb insider trading, market manipulation, and systemic risks.
4. The Role of Technology in Modern Financial Markets
Technology has completely reshaped global finance, making markets faster, more efficient, and accessible.
Algorithmic and High-Frequency Trading (HFT): Automated systems execute trades in milliseconds, enhancing liquidity but also introducing flash crash risks.
Blockchain and Cryptocurrencies: Decentralized finance (DeFi) and cryptocurrencies like Bitcoin and Ethereum challenge traditional banking structures, offering transparency and borderless transactions.
Artificial Intelligence and Big Data: AI analyzes massive datasets to predict market trends, optimize portfolios, and assess credit risks.
Fintech Platforms: Apps and online brokers have made trading, investing, and lending more convenient for individuals worldwide.
The rise of digital transformation ensures that even small investors can participate in global opportunities that were once limited to large institutions.
5. Interconnectedness of Global Markets
Global financial markets are interlinked. A shock in one region can quickly ripple across others—a phenomenon known as financial contagion.
The 2008 Global Financial Crisis began in the U.S. housing market but spread to Europe and Asia.
The COVID-19 pandemic disrupted global supply chains, leading to massive volatility in stock and commodity markets.
Today, geopolitical tensions (e.g., U.S.–China trade conflicts or Russia–Ukraine war) impact global energy prices, currencies, and investment flows.
This interconnectedness makes coordination among central banks and international institutions (like the IMF and World Bank) essential to maintaining financial stability.
6. The Importance of Financial Market Infrastructure
Behind every trade or transaction lies a complex network of infrastructure institutions ensuring smooth operation:
Stock Exchanges (e.g., NYSE, NSE, HKEX)
Clearing Houses (which ensure settlement of trades)
Depositories (which hold securities electronically)
Payment Systems (SWIFT, RTGS, NEFT, etc.)
These systems enable trust and efficiency, allowing billions of transactions daily with minimal risk of default or delay.
7. Global Financial Centers
Certain cities serve as nerve centers of the global financial system, each with its specialization:
New York: Global leader in equities and investment banking.
London: Known for foreign exchange and derivatives trading.
Hong Kong & Singapore: Gateways to Asian capital markets.
Dubai: Emerging as a Middle Eastern financial hub.
Mumbai: India’s financial powerhouse, home to NSE, BSE, and a growing fintech ecosystem.
These hubs attract multinational corporations, financial institutions, and investors, reinforcing the global network of finance.
8. Integration of Emerging Markets
Emerging markets such as India, Brazil, China, and Indonesia have become major players in global finance.
They offer:
Higher growth potential
Expanding consumer bases
Attractive investment opportunities
However, they also carry higher risks — including currency volatility, regulatory uncertainty, and political instability.
Global investors increasingly view emerging markets as essential diversification opportunities, while international organizations like the World Bank and IMF provide financial support and stability frameworks.
9. Challenges Facing the Global Financial Market Structure
Despite technological and institutional progress, several structural challenges persist:
a. Systemic Risks
The interconnected nature of finance means that a collapse in one sector or country can trigger a global chain reaction.
b. Regulatory Divergence
Different countries have varying financial regulations, making global harmonization difficult.
c. Cybersecurity Threats
As markets digitalize, cyberattacks pose significant risks to data security and financial stability.
d. Market Inequality
Wealth concentration among institutional investors and developed economies often widens inequality between nations.
e. Climate and ESG Challenges
Sustainability has become a key issue. Markets are increasingly adapting to ESG (Environmental, Social, Governance) frameworks, integrating ethical and ecological considerations into investment decisions.
10. The Future of Global Financial Markets
The future structure of global financial markets will be shaped by innovation, regulation, and inclusivity.
Key trends include:
Central Bank Digital Currencies (CBDCs) revolutionizing payment systems.
Tokenization of Assets, allowing fractional ownership of real estate or art.
Sustainable Finance, where green bonds and ESG-focused funds dominate portfolios.
Cross-border interoperability, enabling faster and cheaper global transactions.
The focus will increasingly shift toward resilience, transparency, and financial inclusion—ensuring that economic growth benefits both developed and developing economies alike.
11. Conclusion: A System of Opportunity and Responsibility
Understanding the structure of global financial markets is essential not just for investors or policymakers, but for anyone who wants to comprehend how the modern world operates. These markets determine everything from interest rates on home loans to the prices of everyday commodities.
At its core, the global financial system represents a balance between risk and reward, stability and innovation, and regulation and freedom. As globalization deepens and technology evolves, financial markets will continue to transform — becoming more interconnected, intelligent, and inclusive.
However, this evolution also demands responsible participation. Ethical investing, prudent regulation, and financial literacy are vital to ensure that the benefits of global finance reach everyone — not just a privileged few.
In short, the global financial market is a dynamic, living system — a mirror reflecting the collective ambitions, fears, and progress of the world’s economies.
FII Inflows vs. Outflows: Understanding Market SentimentIntroduction
In the ever-evolving landscape of global finance, Foreign Institutional Investors (FIIs) play a pivotal role in shaping the sentiment and direction of emerging markets like India. FIIs — such as hedge funds, pension funds, mutual funds, and insurance companies — bring large volumes of capital into domestic markets, seeking growth and diversification. Their investment behavior, whether inflows (buying) or outflows (selling), often acts as a powerful barometer of market confidence, macroeconomic outlook, and global risk appetite.
Understanding the dynamics between FII inflows and outflows helps investors, policymakers, and analysts interpret shifts in market sentiment and anticipate potential market movements. These capital flows can amplify trends, fuel rallies, or trigger corrections — depending on their magnitude and timing.
1. Who Are Foreign Institutional Investors (FIIs)?
Foreign Institutional Investors are large investment entities registered outside the domestic country that invest in financial assets like equities, bonds, or derivatives. They differ from Foreign Direct Investors (FDIs) because FIIs typically invest in financial markets for shorter durations rather than building physical assets or infrastructure.
Examples of FIIs:
Global mutual funds like BlackRock, Vanguard, and Fidelity.
Sovereign wealth funds from countries such as Singapore’s GIC or Norway’s NBIM.
Hedge funds and private equity firms seeking high returns in emerging economies.
Pension and insurance funds looking for diversification and long-term growth.
Their decisions to enter or exit a market depend on several factors — ranging from macroeconomic stability and policy reforms to global interest rates and currency strength.
2. The Concept of FII Inflows and Outflows
FII Inflows
These occur when FIIs purchase securities in the domestic market, leading to a net inflow of foreign capital. This typically indicates positive sentiment, suggesting investors have confidence in the country’s growth prospects, policy stability, or corporate earnings potential.
FII Outflows
Conversely, when FIIs sell domestic assets and repatriate funds, it leads to an outflow. This usually signals risk aversion, uncertainty, or profit-taking, reflecting a decline in investor confidence or shifts toward safer global assets.
The net FII position — inflows minus outflows — is a key metric that analysts monitor daily. Sustained inflows can lift stock indices, strengthen the domestic currency, and improve liquidity, while sustained outflows can depress markets and weaken sentiment.
3. Why FIIs Matter to Emerging Markets
FIIs are critical to the functioning of emerging economies for several reasons:
Capital Boost: They inject much-needed liquidity into the capital markets, helping firms raise funds efficiently.
Market Depth and Efficiency: FII participation improves price discovery and reduces volatility over the long term.
Currency Support: Inflows strengthen the domestic currency as foreign investors convert their dollars or euros into local currency.
Confidence Indicator: The presence of FIIs signals global confidence in the country's financial stability and growth prospects.
However, dependence on foreign capital can also make markets vulnerable to global shocks. Sudden withdrawals, as seen during crises like 2008 or 2020, can trigger sharp corrections and currency depreciation.
4. Factors Influencing FII Flows
The movement of FII money is influenced by a complex mix of global and domestic factors:
A. Global Factors
US Federal Reserve Policies: Higher US interest rates often trigger FII outflows from emerging markets as investors shift to safer, higher-yielding US assets.
Global Risk Sentiment: During geopolitical tensions or financial crises, FIIs typically move money to safe havens like the US dollar or gold.
Commodity Prices: Changes in crude oil or commodity prices can influence inflation and currency strength, indirectly affecting FII behavior.
Exchange Rates: A weakening local currency reduces returns for foreign investors, often leading to outflows.
B. Domestic Factors
Economic Growth Outlook: Strong GDP growth, industrial production, and corporate earnings attract FIIs.
Inflation and Interest Rates: Moderate inflation and stable monetary policy create a favorable investment climate.
Government Reforms: Policy measures such as tax simplification, infrastructure development, or digitalization enhance investor confidence.
Political Stability: A stable political environment assures investors of continuity in policy and governance.
5. The Relationship Between FII Flows and Market Sentiment
A. Inflows Reflect Optimism
When FIIs pour money into equity markets, it signals confidence in future growth and profitability. Such periods often coincide with bullish market phases, rising stock prices, and increased participation from domestic investors.
For example, in 2020–2021, FIIs heavily invested in Indian markets, betting on post-pandemic recovery, leading to a massive rally in benchmark indices like Nifty and Sensex.
B. Outflows Indicate Caution or Fear
Outflows usually occur during economic uncertainty, inflation fears, or political instability. When FIIs sell, markets tend to correct sharply due to the sheer volume of their trades. Domestic investors often interpret outflows as early warning signs, triggering a chain reaction of selling.
C. Market Sentiment Feedback Loop
FII behavior not only reflects market sentiment but also amplifies it. Positive inflows drive asset prices up, which in turn attracts more investors — creating a self-reinforcing cycle. Conversely, heavy outflows can depress prices, leading to panic and further withdrawals.
6. Impact of FII Flows on Key Market Variables
A. Stock Market Performance
FII inflows increase demand for equities, driving prices up and expanding market capitalization. Conversely, sustained outflows can cause sharp corrections. FIIs often focus on large-cap stocks and sectors like banking, IT, and energy, which heavily influence benchmark indices.
B. Currency Exchange Rate
Inflows strengthen the local currency as foreign investors convert foreign exchange into domestic currency. Outflows do the opposite — large-scale selling can weaken the currency, making imports costlier and impacting inflation.
C. Bond Yields
In the debt market, FII participation affects yields and borrowing costs. Heavy inflows reduce yields, signaling strong demand, while outflows push yields higher due to reduced liquidity.
D. Market Liquidity
FII inflows improve liquidity and enhance market efficiency, allowing smoother trade execution and tighter spreads. Outflows, however, can reduce liquidity and increase volatility.
7. Case Studies: FII Flows and Market Behavior
A. The 2008 Global Financial Crisis
During the 2008 crisis, FIIs pulled out billions from emerging markets amid a flight to safety. India witnessed a sharp fall in equity indices as foreign investors exited in panic, illustrating how global shocks translate into domestic volatility.
B. The Post-Pandemic Rally (2020–2021)
After the initial selloff in early 2020, FIIs returned aggressively as liquidity surged globally due to low interest rates and stimulus packages. India saw record FII inflows, propelling markets to all-time highs by 2021.
C. The 2022 Tightening Cycle
When central banks, led by the US Federal Reserve, began hiking rates in 2022, FIIs started withdrawing capital from riskier markets. This led to corrections in emerging market equities and depreciation of currencies like the Indian rupee.
8. The Role of Domestic Investors (DIIs) as a Counterbalance
Domestic Institutional Investors (DIIs) — such as mutual funds, insurance companies, and pension funds — often act as a stabilizing force. When FIIs exit, DIIs tend to buy the dips, cushioning the market from excessive volatility.
For example, in 2022, even though FIIs sold heavily, Indian markets remained relatively resilient due to strong DII inflows supported by growing domestic retail participation through SIPs (Systematic Investment Plans).
This increasing domestic base reduces overdependence on FIIs, making markets more internally stable over time.
9. Interpreting FII Data to Gauge Market Sentiment
Market participants regularly track FII activity to understand near-term and long-term sentiment.
Key indicators include:
Daily/Weekly FII Net Investment Data: Published by exchanges like NSE and BSE.
Sectoral FII Holdings: Shows which sectors are favored or avoided.
Derivative Positions: Reveal whether FIIs are bullish or bearish through futures and options data.
Typical Interpretations:
Continuous Inflows: Indicate optimism and risk appetite.
Moderate Outflows: May suggest short-term profit booking.
Heavy Outflows: Reflect fear or macroeconomic stress.
Mixed Trends: Suggest uncertainty or global event-driven reactions.
10. Policy Measures to Attract and Retain FII Investment
Governments and regulators often adopt strategies to maintain investor confidence and encourage foreign participation:
Stable Tax Regime: Simplified and predictable tax structures attract long-term investors.
Ease of Capital Entry and Exit: Liberalized investment norms ensure flexibility for FIIs.
Robust Regulatory Framework: Transparency in corporate governance and accounting standards boosts trust.
Infrastructure and Reform Push: Continuous improvement in logistics, digitalization, and reforms strengthens the investment ecosystem.
11. Risks of Overdependence on FII Flows
While FII inflows are beneficial, overreliance can be risky. Markets heavily influenced by foreign flows become vulnerable to global shocks. A sudden reversal in sentiment can trigger:
Sharp market corrections.
Currency depreciation.
Capital flight and liquidity stress.
Negative wealth effect on domestic investors.
Hence, building strong domestic participation and promoting long-term investments are key to achieving market resilience.
12. Future Outlook: FII Behavior in a Changing Global Landscape
As global markets evolve, FII strategies are becoming more data-driven, ESG-oriented, and diversified.
Trends to watch include:
Shift Toward Sustainable Investments: Environmental, Social, and Governance (ESG) factors are influencing allocation decisions.
AI and Quantitative Investing: FIIs increasingly use algorithms to detect opportunities in real-time.
Focus on Emerging Economies: Despite risks, long-term growth prospects in India, Indonesia, and Brazil continue to attract interest.
Rising Domestic Institutional Strength: With DIIs gaining momentum, the market is gradually balancing foreign and local influences.
Conclusion
The battle between FII inflows and outflows serves as a pulse check on global and domestic market sentiment. Inflows bring optimism, liquidity, and growth; outflows bring caution, correction, and discipline. Together, they reflect how global investors perceive a nation’s economic health and future trajectory.
For traders and policymakers alike, understanding the patterns and triggers of FII movements offers valuable insights into market cycles, risk trends, and sentiment shifts. While FIIs will continue to influence markets, a robust domestic investor base ensures that the market’s foundation remains resilient — balancing the scales of global capital dynamics.
Collaboration Between Emerging and Developed MarketsIntroduction
In the globalized world of the 21st century, the economic relationship between emerging and developed markets stands as one of the most defining forces shaping international trade, finance, and growth. The line separating developed economies—like the United States, Germany, Japan, and the United Kingdom—from emerging ones—such as India, China, Brazil, and South Africa—has become increasingly blurred due to globalization, technological advancement, and cross-border collaboration.
This collaboration is no longer a one-sided affair where developed nations provide capital and technology while emerging markets serve as manufacturing bases or resource suppliers. Instead, it has evolved into a multidimensional partnership based on shared innovation, trade integration, capital mobility, and policy cooperation. Emerging markets are now not just passive recipients of aid or investment; they are active contributors to global economic development, driving growth, consumption, and investment opportunities.
1. Understanding Emerging and Developed Markets
Developed Markets
Developed markets are characterized by advanced industrialization, high per capita income, robust infrastructure, and well-established financial systems. Economies like the U.S., Canada, Japan, and Western Europe typically have stable political systems, transparent governance, and diversified industries that contribute to long-term economic stability.
Emerging Markets
Emerging markets, on the other hand, are countries transitioning from developing to developed status. They are marked by rapid industrial growth, rising consumer demand, and increasing participation in global trade. Nations such as India, China, Indonesia, and Mexico fall into this category. These markets often present high growth potential but also come with greater volatility and risk.
The dynamic interaction between these two categories has been vital to global prosperity. Developed nations bring technological expertise, capital, and institutional experience, while emerging markets offer growth opportunities, natural resources, and large consumer bases.
2. Evolution of Global Economic Collaboration
Historically, collaboration between developed and emerging markets began in the post-World War II era when developed nations invested heavily in rebuilding and industrializing regions such as Asia and Latin America. However, the relationship was largely hierarchical—developed nations dictated trade terms, and developing countries supplied low-cost labor or raw materials.
The late 20th and early 21st centuries witnessed a paradigm shift. With the rise of globalization, trade liberalization, and digital transformation, emerging economies started playing a proactive role. China’s manufacturing revolution, India’s IT and services boom, and Brazil’s agribusiness growth transformed the global economic balance. Developed markets began to recognize these nations as partners rather than dependents.
Global institutions like the World Bank, International Monetary Fund (IMF), and World Trade Organization (WTO) have played crucial roles in fostering cooperation through funding, policy coordination, and fair trade frameworks.
3. Key Areas of Collaboration
a. Trade and Investment
Trade has been the cornerstone of collaboration. Developed nations import raw materials and goods from emerging markets, while exporting machinery, advanced technology, and consumer products. Free trade agreements and regional blocs—such as ASEAN, BRICS, and the EU-India partnership—have enhanced economic linkages.
Foreign direct investment (FDI) also forms a vital bridge. Developed markets invest in emerging economies to tap into lower production costs and expanding consumer bases, while emerging markets increasingly invest in developed nations to acquire brands, technology, and global reach.
For example, India’s Tata Group acquiring the UK’s Jaguar Land Rover, or China’s Huawei expanding into European telecommunications, exemplifies this two-way capital flow.
b. Technology Transfer and Innovation
Technology transfer is one of the most transformative aspects of collaboration. Developed economies, with their advanced R&D capabilities, provide emerging markets access to innovation in sectors like renewable energy, healthcare, and manufacturing automation.
Simultaneously, emerging economies contribute through frugal innovation—developing cost-effective, efficient solutions tailored to local needs but often adaptable globally. For instance, India’s low-cost healthcare solutions and fintech platforms are being studied and adopted by Western firms for efficiency and scalability.
Joint research collaborations, startup incubators, and cross-border tech investments are creating hybrid innovation ecosystems, benefiting both groups.
c. Infrastructure and Industrial Development
Developed nations and institutions like the World Bank and the Asian Development Bank (ADB) have long financed infrastructure projects in emerging markets—covering transportation, energy, water, and digital connectivity. Such investments not only improve local economies but also open markets for developed nations’ construction and engineering firms.
Conversely, countries like China have taken a leading role in global infrastructure financing through initiatives such as the Belt and Road Initiative (BRI), which connects Asia, Africa, and Europe through ports, railways, and highways. This marks a new era where emerging markets themselves are facilitating infrastructure collaboration.
d. Financial Markets and Capital Mobility
Financial collaboration has expanded significantly, with cross-listings of companies, sovereign bond issuances, and global portfolio diversification. Developed markets provide capital, while emerging markets offer high returns due to faster growth rates.
International institutions help ensure financial stability and promote inclusion, as seen in the G20 framework, where emerging economies like India and Brazil now have a seat at the table alongside developed powers. The collaboration in finance has deepened global integration and reduced the traditional dominance of Western financial centers.
e. Climate Change and Sustainability
A defining area of modern collaboration is climate and environmental sustainability. Developed nations, historically the major polluters, now collaborate with emerging markets to achieve global climate goals. This includes investments in renewable energy, carbon credits, and sustainable agricultural practices.
For instance, under the Paris Agreement, developed nations pledged financial support and technology transfer to help emerging economies transition to cleaner energy systems. India’s solar energy mission, supported by international funding and partnerships, demonstrates this collective action toward a greener future.
4. Benefits of Collaboration
a. Accelerated Global Growth
The synergy between emerging and developed markets stimulates global economic growth. Developed economies benefit from new markets and production efficiencies, while emerging economies gain from capital inflows, technology, and skills transfer.
b. Job Creation and Poverty Reduction
Investments in emerging markets create millions of jobs, improving living standards and reducing poverty. As disposable income grows, demand for products and services from developed nations also increases—creating a virtuous cycle of mutual benefit.
c. Diversification of Risk
By investing in diverse markets, both developed and emerging economies can mitigate risks related to regional instability, currency fluctuations, or sectoral downturns. This diversification strengthens the resilience of the global economy.
d. Innovation and Knowledge Sharing
Cross-border collaboration accelerates innovation through shared knowledge, talent exchange, and exposure to diverse business environments. The integration of Western technology with emerging-market adaptability creates groundbreaking business models.
5. Challenges in Collaboration
Despite clear advantages, the relationship between emerging and developed markets is not without challenges.
a. Economic Inequality
The benefits of globalization have not been evenly distributed. While some emerging nations have experienced rapid growth, others remain trapped in cycles of debt or underdevelopment. Developed countries often face criticism for exploiting cheap labor and natural resources without ensuring fair returns.
b. Trade Imbalances and Protectionism
Trade tensions, such as those between the U.S. and China, reveal underlying structural imbalances. Protectionist policies, tariffs, and currency manipulation can strain collaborative efforts and disrupt supply chains.
c. Political and Regulatory Risks
Emerging markets often suffer from political instability, corruption, and inconsistent regulatory environments. These factors increase investment risks and sometimes deter long-term commitments from developed partners.
d. Technological Divide
While technology transfer is vital, unequal access to advanced technologies or restrictive intellectual property rights can hinder progress. Many emerging markets struggle to fully absorb and utilize imported technologies.
e. Environmental and Ethical Concerns
Rapid industrialization in emerging economies often leads to environmental degradation. Developed nations face the ethical challenge of ensuring their investments promote sustainable practices rather than merely outsourcing pollution.
6. Case Studies of Collaboration
India–United States Partnership
The U.S.–India economic partnership illustrates how collaboration fosters mutual growth. The U.S. invests heavily in India’s technology, energy, and defense sectors, while India provides skilled labor, IT expertise, and a growing consumer market. Initiatives like the U.S.-India Clean Energy Agenda 2030 Partnership showcase successful cooperation in sustainability and innovation.
China–Africa Relations
China’s engagement with African nations through the Belt and Road Initiative represents large-scale collaboration focused on infrastructure development. While it has accelerated Africa’s connectivity and industrialization, critics warn of potential debt dependency, emphasizing the need for transparency and balanced partnerships.
European Union and Emerging Asia
The EU’s trade relations with ASEAN nations highlight mutual benefits: Europe gains access to manufacturing and digital markets, while ASEAN economies benefit from technology transfer and investment in green industries.
7. The Role of International Institutions
Organizations such as the World Bank, IMF, World Economic Forum, and G20 act as catalysts for collaboration. They provide platforms for policy dialogue, financial assistance, and technical support.
Initiatives like the World Bank’s International Finance Corporation (IFC) focus on private-sector development in emerging economies, while the IMF ensures macroeconomic stability through funding and policy advice.
These institutions promote fair trade practices, sustainable finance, and digital inclusion—aligning both emerging and developed economies toward shared global objectives.
8. Future Outlook: Toward a Multipolar Global Economy
The future of collaboration points toward a multipolar global economy, where influence and innovation are distributed more evenly. Emerging economies are expected to contribute over 60% of global GDP growth in the coming decades.
Partnerships will likely focus on:
Digital Transformation: Joint ventures in AI, fintech, and green tech.
Sustainable Development: Investments in renewable energy and circular economies.
Health and Biotechnology: Global collaboration in healthcare innovation post-COVID-19.
Geopolitical Stability: Strengthening institutions that promote peace, trade, and resilience.
In this new world order, cooperation—rather than competition—will define success. Both groups must embrace inclusivity, ethical standards, and sustainability to ensure equitable global prosperity.
Conclusion
Collaboration between emerging and developed markets represents one of the most powerful engines of modern globalization. It has redefined trade, technology, finance, and innovation, transforming the way nations interact and grow together.
While challenges such as inequality, protectionism, and environmental concerns remain, the potential for mutual benefit is immense. By fostering trust, transparency, and shared responsibility, both emerging and developed economies can create a global ecosystem that is resilient, sustainable, and inclusive.
Ultimately, the future of global progress lies not in the dominance of one group over another, but in the partnership between innovation and opportunity—where developed markets provide the tools, and emerging markets provide the energy—to shape a more balanced and prosperous world.

Emotional Discipline and Risk Control in Trading🧠 1. Why Emotional Discipline Matters
Emotional discipline means sticking to your plan regardless of fear or greed.
Markets are designed to test your patience, confidence, and decision-making. Every losing trade tempts you to change your system — but consistency wins.
✅ Key habits of emotionally disciplined traders:
They accept losses without revenge trading.
They follow rules, not impulses.
They manage expectations — no trade will make them rich overnight.
💰 2. Risk Control — Protect Before You Profit
Your risk management defines your survival. Successful traders think in probabilities, not certainties. They never risk too much on one idea.
📏 Golden Rules of Risk Control:
Risk 1–2% of your capital per trade.
Always use a stop-loss, never a “mental” one.
Define your R:R ratio (minimum 1:2 or better).
Never add to a losing position — only to confirmed winners.
Risk control is not about avoiding losses — it’s about limiting damage and staying consistent over time.
🧩 3. How to Strengthen Emotional Discipline
Like a muscle, discipline grows with routine. Try this daily:
Pre-trade routine – review your plan before every session.
Post-trade journal – log your emotions, not just results.
Take breaks – emotional fatigue leads to poor judgment.
Detach from outcomes – focus on process, not profit.
💡 Tip: When you reduce emotional pressure, your clarity and accuracy both improve.
⚙️ 4. Professional Mindset Shift
Amateurs chase profit; professionals protect capital.
Each trade is just one data point — not a reflection of your worth. Once you start thinking like a risk manager first, your results change naturally.
🗣️ “Discipline is choosing what you want most over what you want now.”
📊 Conclusion
To grow as a trader, focus on controlling yourself before controlling the market.
Emotional stability + strict risk control = long-term success.
Be the trader who executes with logic, not emotion. 🧘♂️

Why Traders Get Wiped Out in the First 30 MinutesIf you’ve been trading Forex for a while, you’ve probably heard this saying:
___“Don’t jump into a trade right when the London session opens.”
And that advice is absolutely true.
The first 30 minutes of the London session are where most retail traders get burned out.
Not because they’re unlucky - but because that’s how the market works.
1. London Open: Liquidity Surges – Chaos Begins
When London opens , the Asian session is winding down.
This overlap creates a burst of liquidity , leading to sharp volatility.
Banks, hedge funds, and institutions begin positioning their orders.
Dozens of pending orders are triggered at once.
The result?
Price moves like a wild beast - violent spikes, fake breakouts, and sudden reversals.
Retail traders see the strong moves, get excited, jump in…
and get wiped out before the real trend even starts.
2. The Trap Called “Early Breakout”
One of the classic London session traps is the false breakout.
You see price breaking a key level, think: “That’s it! A clear signal!”, and you enter.
But minutes later, the market reverses — and your trade vanishes with it.
This isn’t random.
Smart money players intentionally create these fake breakouts to trigger the crowd’s orders — buys above resistance, sells below support — then reverse to accumulate positions at better prices.
An old trick, but still brutally effective — and every morning, retail traders keep falling for it.
3. FOMO – The Silent Account Killer
Nothing messes with a trader’s mind like seeing a massive candle explode right after the open.
You feel like you’re missing the move of the day.
That’s when FOMO (Fear of Missing Out) takes control — and discipline disappears.
But here’s the truth:
The first 30 minutes aren’t for making money — they’re for reading the market.
Professional traders don’t chase candles; they wait and watch to see which side truly dominates.
Retail traders, on the other hand, trade on emotion — and the market always punishes emotion.
4. So, What Should You Do?
Simple: Do nothing.
Let the chaos settle.
Watch who takes control — the buyers or the sellers.
Wait for the post-fakeout structure to form — that’s where the real opportunities appear.
Many professional traders use what’s called the “London Fakeout Strategy.”
They don’t fight the fakeout — they wait for the reaction after the fakeout to trade with the real direction of the market.
Because the real edge isn’t in prediction — it’s in patience.
💡 Coming Soon:
Would you like me to write Part 2: “The London Strategy Playbook” — a detailed guide on how to trade after the first 30 minutes of the London session,
with real examples and clear strategies?

Understanding the Concept of Exotic OptionsIntroduction: Beyond the Vanilla Options
In the world of derivatives trading, options are among the most powerful instruments available to investors. Traditional or “vanilla” options—such as calls and puts—are already versatile tools for hedging and speculation. However, as financial markets evolved, traders and institutions began to seek more sophisticated instruments that could offer customized payoffs, align with complex risk management needs, or exploit specific market views. This need gave birth to a more advanced class of derivatives known as exotic options.
Exotic options go beyond the standard payoff structure of vanilla options. They can depend on multiple underlying assets, trigger conditions, time periods, or paths that prices follow. These options have become integral in structured products, risk management, and tailored investment strategies, particularly in global forex, commodity, and equity-linked markets.
This essay explores the concept, types, valuation, applications, advantages, and risks of exotic options—providing a comprehensive understanding of how these instruments work in modern finance.
1. What Are Exotic Options?
Exotic options are non-standard derivative contracts that have complex features differentiating them from traditional options. While vanilla options grant the right to buy (call) or sell (put) an asset at a predetermined strike price before or at expiration, exotic options can alter how and when payoffs are determined.
They may:
Depend on the path of the underlying asset’s price, not just its final value.
Have multiple exercise or settlement dates.
Involve different underlying assets or currencies.
Include barriers, averages, or digital features that modify payouts.
For instance, a barrier option may only become active (“knock-in”) or inactive (“knock-out”) if the underlying price crosses a specified level. Similarly, an Asian option’s payoff depends on the average price of the underlying over time, reducing volatility effects.
Exotic options are thus tailored to specific investor needs—allowing hedgers or speculators to fine-tune their exposure to price movements, volatility, and time decay.
2. Evolution and Market Use
The development of exotic options traces back to the late 1970s and 1980s, when financial innovation surged alongside advances in computing and quantitative finance. Early forms appeared in the foreign exchange and commodity markets, where traders needed customized hedging tools to manage complex exposures.
By the 1990s, exotic options became a cornerstone of structured finance, used by investment banks to create tailor-made products for corporate clients and high-net-worth investors.
Today, exotic options are found across:
Currency markets (FX options): Commonly used for hedging exchange rate risks.
Commodity markets: To manage exposure to volatile prices.
Equity-linked notes and structured products: For customized return profiles tied to indices or stock baskets.
Interest rate and credit derivatives: To hedge rate movements or credit events.
Exotic options have thus evolved from niche instruments into mainstream financial engineering tools—allowing traders to achieve precise risk-return outcomes that vanilla options cannot offer.
3. Key Characteristics of Exotic Options
Exotic options differ from vanilla options through unique features such as:
a. Path Dependency
In vanilla options, only the final price of the underlying asset matters. In exotic options, however, the entire price path may influence the payoff.
Example: In an Asian option, the payoff depends on the average price over time, not the terminal price at expiration.
b. Conditional Payoffs
Many exotic options include “if-and-only-if” conditions. For instance:
Barrier options activate or deactivate based on price thresholds.
Lookback options depend on the maximum or minimum price achieved during the option’s life.
c. Multi-Asset Dependence
Some exotic options depend on more than one underlying, such as currency pairs, indices, or stock baskets.
Example: A basket option may be based on the average performance of multiple assets.
d. Complex Exercise Rules
Unlike American or European options, some exotics allow customized exercise schedules or partial exercises tied to specific market events.
e. Tailored Payout Structures
Payoffs can be linear, binary, capped, or floored—allowing unique risk-reward combinations suited to specific strategies.
4. Major Types of Exotic Options
There are numerous exotic options, but the following categories are among the most common and important:
a. Barrier Options
Barrier options are activated or extinguished when the underlying asset hits a certain level.
Types include:
Knock-in options: Become active only if the price crosses the barrier.
Knock-out options: Become void if the barrier is breached.
Double-barrier options: Have both upper and lower thresholds.
These are popular in currency and commodity markets due to their cost-effectiveness and targeted exposure.
b. Asian Options
Also known as average options, these derive their value from the average price of the underlying over a period.
They are used to smooth out volatility and reduce the impact of short-term price swings—ideal for commodities or volatile assets.
c. Lookback Options
Lookback options allow the holder to “look back” over the life of the option to determine the optimal strike or payoff.
For instance, the holder of a lookback call can buy at the lowest price observed during the option period.
These are valuable for volatility trading and performance-linked bonuses, but are more expensive due to the flexibility they provide.
d. Binary (Digital) Options
Binary options provide all-or-nothing payouts. If a condition is met (for example, the asset price exceeds the strike), a fixed amount is paid; otherwise, nothing is received.
They are used in speculative trading and hedging against specific events (like rate announcements or price thresholds).
e. Compound Options
A compound option is an option on another option. There can be four variants—call on call, call on put, put on call, and put on put.
These are primarily used by institutional investors managing portfolios of options or structured exposures.
f. Chooser Options
These allow the holder to decide, at a future date, whether the option will be a call or put.
They are ideal for hedging uncertainty, especially in situations where the future direction of prices is unclear.
g. Rainbow or Basket Options
These depend on multiple underlying assets. The payoff may be linked to the best or worst performer, or an average of all.
Used widely in equity-linked structured products to diversify exposure.
h. Barrier-Rebate and Range Options
In these, the payoff depends on whether the price stays within a certain range or hits a barrier, sometimes offering a rebate if deactivated.
5. Pricing and Valuation Challenges
Pricing exotic options is more complex than pricing vanilla ones because of path dependency and non-linear payoffs. Traditional Black-Scholes models are insufficient for many exotics. Instead, advanced methods such as:
Monte Carlo simulation (for path-dependent options),
Binomial or trinomial tree models (for barrier options),
Finite difference methods (for solving partial differential equations),
are used for accurate valuation.
Moreover, the valuation must incorporate:
Volatility skew and smile effects,
Interest rate differentials (especially in FX exotics),
Time decay and path volatility, and
Counterparty credit risks.
Due to these complexities, exotic option trading is typically limited to institutional investors and quantitative traders with access to robust pricing models and computing power.
6. Strategic Applications in Markets
Exotic options play several strategic roles in modern finance:
a. Risk Management
Corporations use them to hedge specific exposures that vanilla options cannot cover efficiently. For example:
A company importing oil may use an Asian call to hedge against the average price rather than the spot price.
Exporters use barrier options to hedge currency risks only if extreme price movements occur.
b. Yield Enhancement
Investors seeking higher returns may purchase structured products embedding exotic options (like range accrual notes) that provide enhanced coupons tied to certain price conditions.
c. Speculation and Arbitrage
Traders exploit exotic options to speculate on volatility, correlations, or price ranges rather than pure direction.
For instance, digital options allow bets on whether a price will surpass a level by expiration.
d. Structured Product Design
Exotic options form the building blocks of many structured investment products—such as equity-linked notes, autocallables, and principal-protected instruments—allowing issuers to customize payoffs.
7. Advantages of Exotic Options
Customization: Can be precisely structured to match unique market views or hedge specific risks.
Cost Efficiency: Often cheaper than vanilla options offering similar exposures due to conditional triggers.
Strategic Flexibility: Allow exposure to volatility, time, or correlation rather than simple price direction.
Diversification: Multi-asset or path-based structures provide diversification benefits.
Creative Payoffs: Enable innovative investment products appealing to both retail and institutional investors.
8. Risks and Limitations
While attractive, exotic options carry significant risks:
a. Complexity Risk
The intricate payoff structures make them hard to value or understand, leading to potential mispricing.
b. Liquidity Risk
Most exotic options are over-the-counter (OTC) products, not exchange-traded, hence low liquidity and wider bid-ask spreads.
c. Counterparty Risk
Since many trades are bilateral, there is always the possibility of default by the counterparty.
d. Model Risk
Valuation depends on complex models and assumptions about volatility, correlation, and interest rates. Incorrect assumptions can lead to misestimation of fair value.
e. Regulatory and Transparency Issues
Post-2008, regulators have tightened rules around complex derivatives, requiring greater disclosure and collateralization. Yet, transparency remains limited compared to exchange-traded instruments.
9. Real-World Examples
Currency Knock-Out Options: Commonly used by multinational corporations to hedge FX exposure cost-effectively.
Asian Options in Oil Markets: Used by airlines to manage jet fuel price volatility.
Autocallable Notes: Retail structured products embedding digital and barrier options that offer enhanced coupons but risk early termination.
These examples show how exotic options have integrated into mainstream hedging and investment frameworks, providing flexibility and innovation.
10. The Future of Exotic Options
With the rise of AI, quantitative finance, and data-driven analytics, the design and pricing of exotic options are becoming increasingly sophisticated. Innovations in machine learning, stochastic volatility models, and blockchain-based smart derivatives promise to make exotic options more transparent and accessible.
However, the challenge remains balancing complexity with clarity. Regulators and financial educators are emphasizing the need for greater transparency and investor awareness to prevent misuse or misunderstanding of such instruments.
Conclusion
Exotic options represent the pinnacle of financial innovation—a class of derivatives that blend mathematics, creativity, and risk management into one. They extend beyond the simplicity of vanilla options, allowing investors to capture nuanced market scenarios, hedge complex exposures, or design innovative return profiles.
However, their sophistication also brings inherent risks—especially in valuation, liquidity, and counterparty exposure. As global markets evolve, the role of exotic options continues to expand, bridging the gap between customized investment strategies and advanced financial engineering.
In essence, understanding exotic options is not merely about mastering a financial product—it’s about appreciating how modern finance tailors risk, reward, and imagination into instruments that shape the dynamics of the global derivatives market.
The Future of Exchange Rate Dynamics in a Globalized EconomyIntroduction: Understanding Exchange Rate Dynamics
In an increasingly globalized economy, exchange rate dynamics play a pivotal role in shaping international trade, investment flows, and overall financial stability. Exchange rates—essentially the value of one currency relative to another—act as the backbone of the global economic system. They determine the competitiveness of nations, influence inflation and interest rates, and affect everything from tourism to multinational corporate profits.
As the world becomes more interconnected through trade, technology, and capital mobility, exchange rate fluctuations have grown more complex. Traditional economic fundamentals like inflation differentials and interest rates still matter, but modern factors—such as geopolitical tensions, algorithmic trading, and digital currencies—are increasingly dictating the rhythm of exchange rate movements. The future of exchange rate dynamics will therefore depend on how these evolving forces interact within an ever-shifting global landscape.
1. Historical Context: From Fixed to Floating Systems
The evolution of exchange rate systems provides critical insights into their future trajectory.
Bretton Woods Era (1944–1971): After World War II, global currencies were pegged to the US dollar, which itself was backed by gold. This system provided stability but limited flexibility for countries facing economic imbalances.
Post-1971 Floating Regime: When the US abandoned the gold standard, currencies began to “float,” meaning their values were determined by market forces. While this allowed for greater flexibility, it also introduced volatility and speculation into currency markets.
Modern Hybrid Systems: Many economies now operate under managed floats, where central banks occasionally intervene to stabilize excessive fluctuations.
The future of exchange rate dynamics is likely to involve an even more flexible yet managed structure, influenced by digital technologies, algorithmic trading, and the policies of major economic blocs.
2. The Forces Shaping Modern Exchange Rate Movements
Exchange rate movements are no longer driven solely by trade balances or interest rate differentials. Instead, they are shaped by a combination of economic, political, and technological forces.
Monetary Policies: Central banks, through their interest rate and quantitative easing decisions, continue to be major influencers of currency strength. Diverging policies between major economies—such as the US Federal Reserve, the European Central Bank, and the Bank of Japan—regularly trigger global capital shifts.
Capital Flows and Investment Sentiment: In an era of globalized finance, trillions of dollars move daily across borders seeking higher returns. These flows can rapidly appreciate or depreciate a currency, sometimes detached from underlying fundamentals.
Geopolitical Tensions: Trade wars, sanctions, and political instability can cause rapid depreciation or appreciation. The ongoing rivalry between the US and China, for example, often manifests in currency movements, with the yuan sometimes used strategically as an economic tool.
Technological and Algorithmic Trading: Artificial intelligence and high-frequency trading algorithms now dominate forex markets, executing transactions within milliseconds. These technologies can amplify volatility but also enhance market efficiency.
Commodity Price Fluctuations: For resource-dependent nations, changes in oil, gas, or metal prices can heavily influence exchange rates. For example, rising oil prices typically strengthen currencies like the Canadian dollar or the Norwegian krone.
3. Globalization and Exchange Rate Interdependence
Globalization has interwoven national economies into an intricate web of financial interdependence. Exchange rate changes in one major economy can ripple across the globe within hours.
Trade Interdependence: When a major exporter like China adjusts its exchange rate, it impacts the competitiveness of other export-driven economies.
Financial Integration: Capital markets are now more connected than ever. A policy move by the US Federal Reserve can lead to capital inflows or outflows in emerging markets within seconds.
Global Supply Chains: Exchange rate changes influence production costs, profit margins, and even the geographical decisions of manufacturing hubs.
In this interconnected world, the future of exchange rates will depend on how nations manage these linkages without sacrificing domestic economic priorities.
4. The Rise of Emerging Market Currencies
Historically, global exchange rate movements were dominated by a few key currencies: the US dollar, euro, yen, and pound sterling. However, emerging market currencies are becoming increasingly influential.
Countries such as India, Brazil, Indonesia, and Mexico are gaining global trade and investment relevance. Their currencies are also becoming more actively traded. This trend signifies a gradual multipolar shift in global currency dynamics.
The Indian Rupee: With India’s rapid economic growth and rising foreign investment, the rupee’s stability and convertibility are under continuous evolution.
The Chinese Yuan (Renminbi): Already included in the IMF’s Special Drawing Rights (SDR) basket, the yuan’s influence will likely expand as China continues internationalizing its currency through trade settlements and financial partnerships.
The future will likely see a diversified forex market where multiple regional currencies share global influence, reducing overreliance on the US dollar.
5. The Digital Transformation of Currency Markets
Digitalization is revolutionizing how exchange rates are determined and traded.
Central Bank Digital Currencies (CBDCs): More than 130 countries are exploring or developing digital versions of their currencies. CBDCs could reshape how international transactions are settled, reducing friction, improving transparency, and potentially altering exchange rate mechanisms.
Cryptocurrencies and Stablecoins: While still volatile and speculative, cryptocurrencies like Bitcoin and stablecoins pegged to fiat currencies are emerging as parallel mediums of exchange and stores of value. They could challenge traditional currency dominance in specific cross-border applications.
Blockchain and Instant Settlements: Blockchain technology enables real-time currency settlement without intermediaries, potentially making currency markets more efficient and less prone to manipulation.
In the future, digital currencies may lead to a more decentralized and transparent forex ecosystem, though regulation and cybersecurity will remain key challenges.
6. The Role of Artificial Intelligence and Big Data
Artificial intelligence (AI) and big data analytics are transforming the predictive and operational aspects of exchange rate management.
Predictive Modeling: AI systems can analyze vast datasets—ranging from macroeconomic indicators to social media sentiment—to forecast short-term currency movements with remarkable accuracy.
Risk Management: Corporations and financial institutions now use AI-based models to hedge currency exposure dynamically, adjusting positions in real time.
Central Bank Policy Design: Some central banks are adopting machine learning models to better anticipate inflation and currency pressures, enhancing their decision-making processes.
As AI-driven systems become more sophisticated, they will likely increase the precision and speed of exchange rate adjustments, though they might also amplify short-term volatility during times of stress.
7. Challenges in Managing Exchange Rate Volatility
Despite technological and institutional advancements, exchange rate volatility remains a major concern for policymakers, investors, and businesses.
Key challenges include:
Speculative Attacks: With instant global communication and high leverage, currencies can face rapid speculative pressures, especially in emerging markets.
Policy Conflicts: Countries face a “trilemma”—they cannot simultaneously maintain fixed exchange rates, free capital movement, and independent monetary policy.
Global Shocks: Events like pandemics, wars, or financial crises can cause widespread exchange rate instability, as seen during the 2008 crisis and the COVID-19 pandemic.
Inflation and Trade Imbalances: Persistent inflation differentials or large current account deficits can weaken currencies, creating long-term instability.
Future exchange rate management will thus require a balance between flexibility and stability, with central banks using both traditional and technological tools to mitigate extreme swings.
8. The Future of the U.S. Dollar’s Dominance
The US dollar currently serves as the world’s primary reserve currency, underpinning most global trade and finance. However, several trends could reshape this dominance:
Diversification by Central Banks: Many central banks are gradually reducing their dollar holdings in favor of gold, the euro, or the yuan.
Geopolitical Fragmentation: The rise of regional trade blocs and alternative payment systems (like China’s CIPS) could reduce dependence on dollar-based systems such as SWIFT.
Digital Currency Alternatives: The introduction of digital euros or yuan-based CBDCs could offer faster, cheaper settlement options for international trade.
While the dollar is likely to remain dominant in the near term due to trust, liquidity, and network effects, the long-term future points toward a multipolar currency world.
9. Sustainable Global Finance and Exchange Rates
Sustainability concerns are now influencing global economic and financial systems, including currency markets.
Green Investments: As nations pursue climate goals, capital is increasingly flowing into green assets, affecting exchange rates through capital reallocation.
Carbon Pricing and Trade: Carbon taxes and environmental regulations can alter production costs and trade competitiveness, indirectly influencing currency values.
ESG-Linked Monetary Policies: Some central banks are integrating environmental criteria into their operations, which could gradually reshape how exchange rates respond to economic policies.
The future of exchange rates may thus reflect not just financial fundamentals, but also environmental and social priorities.
10. The Road Ahead: What the Future Holds
Looking forward, the future of exchange rate dynamics in a globalized economy will be defined by adaptation and innovation.
Greater Currency Diversification: The world is moving toward a more balanced system with multiple influential currencies.
Technological Integration: AI, blockchain, and digital currencies will redefine transaction speed, transparency, and predictability.
Adaptive Policy Frameworks: Central banks will need to be more agile, using data-driven insights and flexible tools to manage volatility.
Geopolitical Realignment: Currency power will increasingly mirror global political and trade realignments, with Asia playing a central role.
Sustainability Linkages: Environmental and social factors will become embedded in long-term exchange rate assessments.
The result will be a dynamic, data-driven, and digitally interconnected currency ecosystem—one that is more complex, but also potentially more efficient and inclusive.
Conclusion
The future of exchange rate dynamics in a globalized economy is a story of transformation. Economic fundamentals will remain important, but they will be reshaped by technology, geopolitics, and sustainability imperatives. As digital currencies, AI, and cross-border innovations continue to evolve, the very nature of money and exchange will change.
In this new era, stability will depend not merely on traditional economic management but on global cooperation, technological resilience, and adaptive policymaking. The next decade will thus redefine how nations and markets perceive value, manage volatility, and maintain balance in a truly interconnected financial world.
Risks and Limitations of ETF and Index Trading1. Market Risk: The Core Challenge
ETFs and index funds are designed to track the performance of a specific index, such as the Nifty 50, S&P 500, or NASDAQ-100. This means that if the underlying market declines, the ETF or index fund will also lose value.
Example:
During the 2020 pandemic crash, the Nifty 50 ETF lost over 35% of its value in a matter of weeks. Investors holding the ETF had no protection against this decline because ETFs are market-linked instruments.
Key takeaway:
ETFs are not immune to market downturns. While diversification helps reduce company-specific risks, systemic or market-wide risks cannot be avoided.
2. Tracking Error Risk
One of the most important limitations of ETFs and index funds is tracking error—the difference between the ETF’s performance and its benchmark index.
Causes of tracking error include:
Management fees: Even a 0.2% expense ratio can add up over time.
Dividends and cash holdings: If the ETF manager holds cash instead of being fully invested, returns will lag.
Rebalancing frequency: Delays or inefficiencies in adjusting to index changes can cause mismatches.
Transaction costs: Buying and selling underlying assets incur brokerage and spread costs.
Impact:
For instance, if the Nifty 50 gives a 10% return in a year but the ETF delivers only 9.6%, the 0.4% difference represents a tracking error.
Investor note:
While small tracking errors are normal, persistent or large deviations indicate poor fund management or structural inefficiencies.
3. Liquidity Risk
Liquidity plays a vital role in ETF and index trading. It refers to how easily you can buy or sell an ETF without significantly affecting its price.
Types of liquidity:
Primary liquidity: Based on the liquidity of the underlying securities.
Secondary liquidity: Based on the trading volume of the ETF itself.
The risk:
Some ETFs, especially thematic or sectoral ones, have low trading volumes. This means:
Wider bid-ask spreads.
Price gaps between the ETF and its net asset value (NAV).
Difficulty exiting positions during market stress.
Example:
During volatile market conditions, ETFs linked to small-cap indices or niche sectors may see spreads widen sharply, leading to losses even when the underlying index hasn’t fallen as much.
4. Counterparty Risk in Synthetic ETFs
Certain ETFs—known as synthetic ETFs—do not hold the actual securities of the index. Instead, they use derivatives (like swaps) to replicate performance. This introduces counterparty risk, meaning if the derivative provider defaults, investors may face losses.
Example:
If a European bank issues a swap-based ETF on the NASDAQ-100 and later faces financial distress, the ETF might fail to deliver accurate returns, even if the U.S. index performs well.
Lesson:
Always check whether an ETF is physical (holds real securities) or synthetic (uses swaps). Physical ETFs are generally safer for long-term investors.
5. Over-Concentration in Certain Sectors or Stocks
While ETFs offer diversification, index concentration remains a key limitation. Many indices are market-cap weighted, meaning larger companies dominate performance.
Example:
In the Nifty 50, the top five companies—Reliance Industries, HDFC Bank, ICICI Bank, Infosys, and TCS—often account for over 50% of the index weight.
So, if these few companies underperform, the entire index (and related ETFs) suffers, regardless of how other constituents perform.
Implication:
Investors mistakenly believe ETFs provide balanced diversification, but in practice, they may be overexposed to a handful of large-cap stocks or sectors, such as technology or banking.
6. Limited Upside Potential
ETFs and index funds are passive investment vehicles. They mirror the index and do not attempt to outperform it. Therefore, investors miss out on potential alpha generation that skilled active fund managers might deliver.
Scenario:
If a fund manager identifies high-growth small-cap stocks before they are included in an index, active portfolios may outperform. Meanwhile, index ETFs will only benefit once the stock becomes large enough to enter the index—by which time much of the growth may already be priced in.
Key understanding:
ETFs are ideal for steady, market-level returns, not for those seeking high, alpha-driven profits.
7. Volatility and Short-Term Fluctuations
ETFs are traded intraday, just like stocks. While this provides flexibility, it also introduces short-term volatility risk.
Risks include:
Sudden price swings during high volatility periods.
Emotional trading decisions due to frequent price visibility.
Potential divergence between ETF price and actual NAV.
Example:
During sharp market corrections, ETFs can trade temporarily below their NAV as panic selling sets in—known as price dislocation. Investors who sell at such times may lock in unnecessary losses.
8. Management and Operational Risk
Despite being “passive,” ETFs are not fully automated. They require management oversight, creation and redemption processes, and operational execution.
Any failure in these processes can harm investors.
Risks include:
Error in replication: Wrong index tracking or delayed rebalancing.
System failures: Trading halts or delayed settlements.
Custodian issues: Safekeeping errors in underlying assets.
Example:
If a fund fails to rebalance after an index change (say, replacing a stock in the Nifty 50), the ETF may not accurately reflect index performance, leading to return mismatches.
9. Currency Risk in International ETFs
When investors buy international or global ETFs (such as U.S. ETFs listed in India), currency fluctuations can significantly affect returns.
Example:
If an Indian investor buys an S&P 500 ETF and the U.S. dollar weakens against the Indian rupee, the investor’s return in INR terms will decline—even if the S&P 500 index itself rises.
Key takeaway:
Investors must consider currency hedging strategies or accept that forex volatility can amplify or reduce total returns.
10. Taxation Complexity
ETF taxation depends on the asset class—equity or debt—and the jurisdiction of the fund.
Investors often underestimate how tax treatment can affect net returns.
Example (India):
Equity ETFs: Short-term capital gains (STCG) taxed at 15%, long-term at 10% (beyond ₹1 lakh).
Debt ETFs: Taxed at slab rates, with no indexation benefit after 2023 tax law changes.
This can make debt-based ETFs less tax-efficient, particularly for short-term investors.
Lesson:
Taxation is not always straightforward, especially with international ETFs that may also face withholding taxes on dividends.
11. The Illusion of Safety and Simplicity
Many investors treat ETFs as inherently “safe” because they represent diversified indices. However, ETFs can carry hidden risks, such as:
Exposure to overheated sectors.
Dependence on market sentiment.
Herd behavior leading to bubbles.
Example:
During 2021–2022, heavy inflows into technology ETFs led to inflated valuations in the NASDAQ. When tech stocks corrected, investors faced double-digit losses despite believing ETFs were low-risk instruments.
12. Structural Risks in Leveraged and Inverse ETFs
Some ETFs use leverage (2x, 3x) or inverse strategies (profit from declines). These products are meant for short-term trading, not long-term investment.
Risks include:
Compounding effect: Over time, leveraged ETFs can diverge significantly from expected returns.
Decay in value: Rebalancing daily magnifies losses in volatile markets.
Example:
A 2x leveraged ETF on the NASDAQ might gain 20% if the index rises 10% in a day. But if the index falls 10% the next day, the ETF’s loss will exceed 20%, leading to long-term erosion even if the index later recovers.
13. Systemic and Contagion Risks
ETFs have grown to represent a large portion of total market capitalization globally. Some analysts worry that ETFs could amplify systemic risks during market stress.
How it happens:
Heavy ETF redemptions can trigger mass selling of underlying assets.
Algorithmic rebalancing can worsen volatility.
Liquidity mismatches between ETFs and underlying securities can lead to market distortions.
Example:
During the March 2020 market panic, corporate bond ETFs traded at steep discounts to their NAVs, highlighting liquidity mismatches and systemic vulnerabilities.
14. Behavioral Risks: Investor Misuse
One of the less-discussed limitations of ETFs is not structural—but behavioral. Many retail investors use ETFs incorrectly:
Overtrading due to intraday availability.
Chasing momentum during bull runs.
Ignoring long-term compounding benefits by switching ETFs frequently.
Example:
An investor repeatedly switching between sectoral ETFs (banking, IT, pharma) based on short-term news may end up losing more to timing errors than they gain from diversification.
15. Regulatory and Structural Limitations
ETFs operate under specific market regulations. Sudden rule changes or restrictions can impact trading or returns.
Examples include:
Restrictions on foreign ETFs or limits on overseas investment by Indian investors.
Changes in capital gain taxation.
Trading halts due to market circuit breakers.
Such regulatory interventions, while rare, can disrupt ETF trading or temporarily distort pricing.
16. Over-Diversification and Diluted Returns
While diversification reduces risk, too much diversification can dilute returns. Index ETFs often hold hundreds of stocks, many of which contribute little to performance.
Example:
In a broad global ETF tracking 1,000+ companies, top performers’ impact gets diluted by hundreds of underperforming or stagnant ones—resulting in “average” returns.
Conclusion:
Diversification helps stability, but excessive breadth can limit meaningful gains.
Conclusion: Balancing Opportunity with Awareness
ETFs and index trading have democratized investing, providing easy access to global markets, diversified exposure, and transparent pricing. Yet, investors must remember that “simple does not mean risk-free.”
From market and tracking errors to liquidity, counterparty, and behavioral risks, each factor can impact returns differently depending on market conditions and investor behavior.
The key to success in ETF and index investing lies in understanding these risks and managing them wisely:
Choose ETFs with high liquidity and low tracking error.
Diversify across asset classes and regions—not just within one index.
Avoid leveraged or complex ETFs unless you understand their mechanics.
Stay disciplined—ETFs reward long-term consistency, not short-term speculation.
In short, ETFs and index trading are powerful tools—but like any tool, they require knowledge, caution, and strategy to use effectively.
Investors who respect these limitations and plan accordingly can enjoy stable, sustainable returns while minimizing unnecessary risks.
AI and Big Data Driving Market PredictionsIntroduction: The Rise of Data-Driven Markets
In today’s digital economy, markets are no longer just driven by human instincts, experience, or traditional financial models. Instead, they’re increasingly influenced by artificial intelligence (AI) and Big Data analytics — two powerful technologies that are reshaping how investors, institutions, and even governments understand, predict, and act in financial markets.
Every second, terabytes of data flow through global markets — from social media posts and trading volumes to corporate earnings, satellite imagery, and even weather patterns. This explosion of information is too vast for human analysts to process. That’s where AI and Big Data step in — together, they transform raw, unstructured data into actionable intelligence, allowing for faster, smarter, and more accurate market predictions.
The Data Revolution in Financial Markets
To understand the power of AI in market prediction, we must first understand the foundation it stands on — Big Data.
Financial markets generate massive volumes of data every millisecond — including:
Market data: Price movements, trading volumes, bids and asks.
Economic data: GDP growth, inflation rates, employment reports.
Alternative data: Social media sentiment, news headlines, online reviews, weather updates, and even satellite images of shipping ports.
Traditionally, analysts would rely on limited financial metrics like P/E ratios, earnings reports, or macroeconomic indicators. But Big Data allows analysts to incorporate millions of non-traditional data points, creating a far more detailed and dynamic picture of the market.
For example, an AI model can analyze millions of tweets about a company to gauge public sentiment before its earnings release. It can track credit card spending patterns to anticipate retail sales or use satellite images to estimate oil stockpiles — all in real time.
This shift has given rise to a new era of quantitative and algorithmic trading, where AI-powered systems can detect micro trends, predict price movements, and execute trades faster than any human could.
How AI Transforms Market Prediction
AI (Artificial Intelligence) acts as the “brain” that interprets and learns from Big Data. In financial markets, AI algorithms process data to identify patterns, correlations, and anomalies — and then make predictive models based on these insights. Here’s how it works:
1. Machine Learning (ML)
Machine learning enables systems to learn from past data and improve predictions over time.
For example:
Supervised learning models use historical market data (inputs) and price outcomes (outputs) to predict future price changes.
Unsupervised learning models cluster similar assets or traders based on hidden relationships in the data.
Reinforcement learning helps algorithms “learn by doing” — just like human traders testing strategies.
Through millions of iterations, these models refine themselves and make predictions with growing accuracy — predicting stock prices, volatility, or macroeconomic shifts.
2. Natural Language Processing (NLP)
Financial markets are highly sensitive to language — especially in news headlines, analyst reports, and central bank statements.
NLP allows AI to read, interpret, and quantify human language to assess market sentiment.
For example:
Detecting positive or negative tones in company news.
Monitoring Twitter or Reddit for crowd sentiment (as seen in meme stock movements like GameStop).
Parsing Federal Reserve speeches to predict interest rate decisions.
This gives traders a real-time sentiment score that influences trading decisions and market predictions.
3. Neural Networks and Deep Learning
Neural networks mimic the human brain by processing data through layers of interconnected nodes.
Deep learning models can detect highly complex, non-linear patterns that traditional models miss.
For instance, they can analyze minute-by-minute changes in trading volumes, market depth, and volatility to predict short-term price fluctuations — something essential for high-frequency trading firms.
Applications of AI and Big Data in Market Predictions
The integration of AI and Big Data isn’t theoretical — it’s already transforming multiple areas of the financial ecosystem.
1. Stock Price Forecasting
AI models analyze historical stock data alongside alternative data — like social sentiment, macroeconomic news, and global supply chain metrics — to forecast price movements.
For example, hedge funds like Renaissance Technologies or Two Sigma use AI-driven predictive models to manage billions of dollars, often outperforming traditional funds.
2. Risk Management
Predicting market trends also involves anticipating risks.
AI can detect early signs of market stress, liquidity crises, or systemic shocks by continuously monitoring thousands of variables.
It can forecast volatility spikes, credit defaults, or currency fluctuations — giving traders and institutions the foresight to manage risks proactively.
3. Algorithmic and High-Frequency Trading
AI has revolutionized algorithmic trading. Modern algorithms can execute thousands of trades per second, adjusting instantly to new information.
They analyze real-time data, predict micro-trends, and make split-second decisions that exploit even tiny inefficiencies in the market.
In fact, AI now accounts for nearly 70–80% of trading volume in developed markets like the U.S.
4. Portfolio Optimization
AI tools also help investors construct better portfolios.
They consider not only traditional financial metrics but also alternative data, market sentiment, and macroeconomic conditions to balance risk and return dynamically.
AI-driven robo-advisors like Wealthfront or Betterment use these techniques to provide personalized, automated investment strategies for retail investors.
5. Predicting Macroeconomic Trends
AI systems can forecast larger market cycles by analyzing data on global trade flows, inflation trends, commodity prices, and geopolitical news.
By recognizing long-term correlations between macro indicators and market behavior, AI can predict recessions, bull runs, or sector rotations well in advance.
6. Sentiment and Behavioral Analysis
Markets are driven by human psychology as much as numbers.
AI-powered sentiment analysis tracks the emotional tone of market participants — from optimism to panic — across millions of online conversations.
This behavioral data helps institutions anticipate potential rallies, sell-offs, or bubbles before they become visible on charts.
Big Data: The Fuel Behind AI Predictions
While AI provides the intelligence, Big Data provides the fuel.
Here’s how Big Data enhances market prediction accuracy:
1. Volume
Financial markets produce petabytes of data daily. The more data AI has, the better it can identify rare but powerful patterns that drive market movements.
2. Variety
Data isn’t limited to price charts anymore. It includes text, audio, video, geolocation, and even biometric signals.
For example, hedge funds use satellite images to count cars in retail store parking lots — predicting sales before official earnings reports.
3. Velocity
Markets move in milliseconds, so real-time data streams are crucial.
AI systems continuously ingest and analyze live feeds from exchanges, news outlets, and APIs to deliver up-to-the-second predictions.
4. Veracity
High-quality, verified data improves model reliability. Big Data systems use advanced filtering and validation to eliminate noise, fake news, or biased data sources — ensuring predictions remain credible.
Case Studies: AI and Big Data in Action
1. BlackRock’s Aladdin Platform
BlackRock’s Aladdin is a sophisticated AI and Big Data platform that monitors market conditions, analyzes risk exposures, and simulates economic scenarios.
It manages trillions in assets by identifying trends and warning fund managers about potential shocks — all through predictive analytics.
2. JPMorgan’s LOXM
JPMorgan developed LOXM, an AI-based execution algorithm that uses historical and real-time trading data to determine the best execution strategies.
It minimizes market impact and optimizes trade timing — outperforming human traders in efficiency.
3. Google and Predictive Search for Economics
Google has used search data to predict economic trends, like unemployment rates or housing demand.
By analyzing search patterns, economists and traders gain early insight into shifts in consumer behavior — long before official data releases.
Benefits of AI and Big Data in Market Predictions
Speed and Efficiency: AI can analyze millions of data points in seconds, offering instant insights.
Accuracy and Adaptability: Machine learning models continuously refine themselves with new data, improving predictive accuracy.
Reduced Human Bias: Algorithms operate purely on data, reducing emotional trading errors.
Comprehensive Insights: Integration of traditional and alternative data gives a 360° market view.
Early Warning Systems: AI can flag risks before they escalate, protecting portfolios from shocks.
Challenges and Limitations
While powerful, AI and Big Data are not without challenges.
Data Overload: Not all data is useful — filtering noise remains difficult.
Model Overfitting: AI models may perform well on historical data but fail in real-world scenarios.
Black Box Problem: Many AI systems are opaque — even developers can’t always explain why they make certain predictions.
Ethical and Regulatory Issues: The use of alternative data (like social media or geolocation) raises privacy concerns.
Market Feedback Loops: When too many traders use similar AI strategies, markets can become synchronized — leading to flash crashes.
The Future of AI-Driven Market Predictions
The future lies in combining AI, quantum computing, and decentralized data networks.
Quantum AI could process complex financial models at lightning speed, solving predictive problems beyond current capability.
Explainable AI (XAI) will make algorithms more transparent and accountable.
Federated data systems will enable firms to share insights without compromising privacy.
Moreover, as AI models become more integrated with blockchain data, they’ll bring transparency to global financial flows and improve risk forecasting in digital asset markets.
In the next decade, financial institutions won’t just use AI as a tool — they’ll become AI-driven organizations, where every investment decision, risk assessment, and strategic move is guided by intelligent algorithms trained on global data streams.
Conclusion: Data is the New Alpha
The age of intuition-based investing is rapidly giving way to an era of data-driven intelligence.
AI and Big Data have democratized predictive power — enabling not just hedge funds, but even retail traders, to forecast markets with unprecedented precision.
Yet, as powerful as these tools are, human judgment remains essential. The best results come from combining human insight with machine intelligence — intuition guided by data.
In financial markets, information has always been power.
But in today’s landscape, data — interpreted by AI — has become the ultimate competitive edge, driving the next frontier of market prediction, efficiency, and innovation.