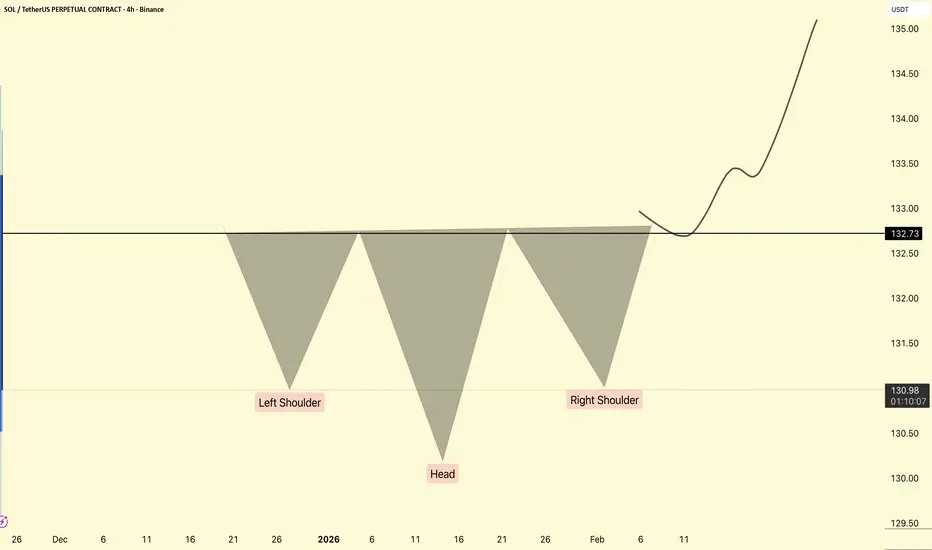
Inverse Head and Shoulders PatternThe inverse head and shoulders pattern is a technical analysis tool used to signal a potential trend reversal from a downtrend to an uptrend.
The inverse head and shoulders pattern is characterized by three consecutive troughs, with the middle trough (head) being the lowest and the two outer troughs (shoulders) being higher and nearly equal. This formation indicates that the downtrend is nearing its end, and a reversal to an uptrend may occur soon. Identifying this pattern can provide traders with a valuable signal to enter a new long position or exit a bearish trade, making it an essential part of technical analysis.
The inverse head and shoulders pattern is the opposite of the head and shoulders pattern. Technical traders widely follow both formations due to their distinct shapes and clear signals as trend reversal patterns.
Chart Patterns
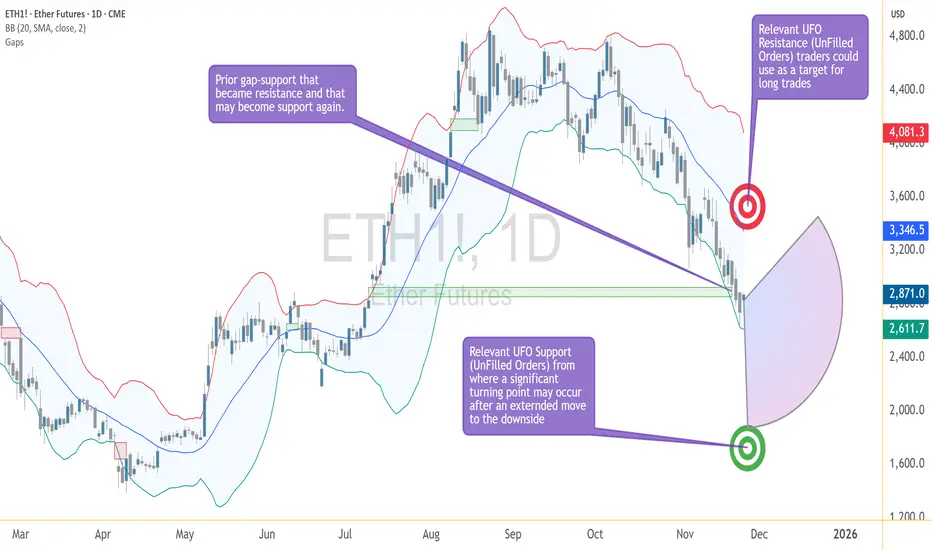
Crypto Walking the Edge: Will the Band Snap or Stretch Lower?Ether Futures (ETH) continue to tell a story of controlled pressure — one that traders have seen before across many markets, but rarely with this level of composure. The selling has been persistent, yet measured, and despite the depth of the decline, Ether has remained remarkably disciplined within its volatility structure. In short, price is walking the lower Bollinger Band — and doing it with intent.
The Market’s Controlled Descent
When an asset walks the lower Bollinger Band, it signals a market under steady directional momentum. The band represents volatility boundaries built around a moving average; hugging its lower edge reflects consistent downside force without capitulation. In Ether’s case, the message is clear — bears are in charge, but not panicking.
This pattern of orderly decline can be deceptive. It often convinces traders that “it can’t go lower” simply because volatility seems contained. Yet, in technical behavior, containment isn’t comfort — it’s momentum management. Until the market detaches from the band and closes above the midline, downside potential remains valid.
The Downside Magnet — UFO Support at 1883.0
Beneath the current price structure lies a level of particular interest: 1883.0. This is not just another number on the chart; it marks a UFO (UnFilled Orders) zone — an area where unexecuted buy orders from prior trading sessions may still be sitting.
Such levels often act as demand magnets. Price gravitates toward them as liquidity seeks to rebalance. If ETH continues its gradual descent, 1883.0 could act as a “final test” of demand strength. Traders currently short may view this area as a logical place to take profits or reduce exposure, while contrarian participants might monitor it for early signs of stabilization.
Walking the Edge — Bollinger Band Dynamics
The Bollinger Band is more than a volatility envelope; it’s a behavioral tool. Price hugging the lower band isn’t a reversal signal on its own. It shows persistent imbalance — sellers are comfortable pressing until they meet true counterflow demand.
The key observation isn’t where Ether trades, but how it interacts with the band:
If the band widens while Ether stays glued to its edge, volatility expansion favors continuation.
If the band narrows and Ether starts oscillating away from it, compression signals the potential for reversal.
At present, Ether remains on the outer lane — still walking the edge, with no confirmed volatility squeeze yet in play.
The Reversal Trigger — The Gap Between 2853.5–2769.0
Ether’s chart carries memory — and that memory is marked by the closure of a previously open gap between 2853.5 and 2769.0. Gaps represent unbalanced zones where the market skipped transactions, often leaving behind psychological resistance.
As long as ETH remains below 2769.0, bearish pressure dominates. A decisive close through the 2853.5 boundary would, however, suggest sellers have lost control. That event could flip the zone from resistance to support — the technical definition of a reversal confirmation.
Until that happens, Ether continues to operate in a bearish environment within its Bollinger framework, respecting lower boundaries and testing demand without capitulation.
The Upside Magnet — UFO Resistance at 3376.5
If the market does achieve a confirmed reversal through the gap zone, the next structural target stands near 3376.5. This region contains a UFO resistance cluster, where unfilled sell orders may wait to re-engage.
This becomes the “upside magnet” in the event of a bullish shift. Not as a forecast, but as a conditional marker — if price proves it can break through 2853.5, the 3376.5 zone becomes the next logical test for momentum sustainability.
Case Study: Risk Structure and Trade Framing
The beauty of futures markets lies in flexibility. Traders can define clear structural zones, build conditional scenarios, and design reward-to-risk ratios before any entry occurs. Ether’s chart currently offers two educational case studies:
Scenario 1 — Continuation Setup
If ETH continues trading below 2769.0, the bearish structure remains intact. Traders could study how price behaves as it approaches 1883.0 to understand profit-taking dynamics or potential trend exhaustion.
Scenario 2 — Reversal Setup
If ETH breaks and closes above 2853.5, the tone changes. It implies the market has absorbed overhead supply, opening the path toward 3376.5. In this case, risk would typically be defined below the reclaimed gap zone, maintaining a controlled risk ratio.
Whichever scenario unfolds, the discipline lies not in prediction but in preparation — in defining “if this, then that” logic.
Contract Specifications
To understand how traders express these views, it helps to revisit how Ether Futures work on CME.
Ether Futures (ETH)
Contract size: 50 Ether with a minimum tick: 0.25 per Ether = $25 per contract
Trading hours: Nearly 24 hours a day, Sunday to Friday, on CME Globex
Margin requirement: approximately $44,000 per contract (subject to changes)
For traders seeking smaller capital exposure, CME also lists Micro Ether Futures (MET) — 1/500th the size of the standard contract. This smaller format offers precision for testing setups, scaling positions, or managing margin during high volatility periods. Importantly, both ETH and MET track the same underlying price behavior, allowing consistent technical interpretation across sizes.
Managing Risk — Beyond Price Targets
Regardless of contract size, effective futures trading is a balance between conviction and constraint. Every trade requires three coordinates before execution:
Entry — based on objective price structure or confirmation.
Exit — determined by invalidation, not emotion.
Size — calibrated to volatility and margin.
A well-structured plan incorporates all three. For instance, a trader eyeing ETH’s move toward 1883.0 should define exit conditions before entry — not after volatility spikes. The same logic applies if Ether were to reclaim 2853.5 and aim higher; stop placement must be systematic, not spontaneous.
Ether Futures in Market Context
Ether’s futures market has become one of the clearest barometers of institutional sentiment in crypto. It reflects not retail enthusiasm but structured positioning, hedging, and liquidity management. The current price behavior — a slow, calculated descent — signals strategic repositioning rather than panic liquidation.
This distinction matters. Markets driven by liquidation collapse violently and rebound sharply. Markets driven by reallocation, like the current Ether environment, tend to evolve gradually — a series of tests, pauses, and measured reactions. Recognizing this tempo helps traders align their strategies with the rhythm of institutional order flow.
Summary — The Market Still Walking the Edge
Ether’s structure can be summarized in three key technical zones:
1883.0: Demand magnet and potential exhaustion level.
2853.5–2769.0: The gap resistance band — critical reversal gate.
3376.5: Major resistance cluster and next test if reversal unfolds.
As long as Ether remains below the gap zone, momentum remains under bearish control. If it trades through and holds above, a structural shift may begin. Until then, the market keeps “walking the edge” — respecting volatility, testing support, and waiting for conviction.
When charting futures, the data provided could be delayed. Traders working with the ticker symbols discussed in this idea may prefer to use CME Group real-time data plan on TradingView: www.tradingview.com - This consideration is particularly important for shorter-term traders, whereas it may be less critical for those focused on longer-term trading strategies.
General Disclaimer:
The trade ideas presented herein are solely for illustrative purposes forming a part of a case study intended to demonstrate key principles in risk management within the context of the specific market scenarios discussed. These ideas are not to be interpreted as investment recommendations or financial advice. They do not endorse or promote any specific trading strategies, financial products, or services. The information provided is based on data believed to be reliable; however, its accuracy or completeness cannot be guaranteed. Trading in financial markets involves risks, including the potential loss of principal. Each individual should conduct their own research and consult with professional financial advisors before making any investment decisions. The author or publisher of this content bears no responsibility for any actions taken based on the information provided or for any resultant financial or other losses.
Fluctuation Effects on the Global Economy1. Understanding Economic Fluctuations
Economic fluctuations refer to irregular movements in economic indicators such as GDP, inflation, employment, interest rates, exchange rates, and asset prices. These fluctuations arise due to a mix of market forces and external shocks, including technological changes, policy decisions, global conflicts, pandemics, and shifts in consumer behavior.
In an interconnected globalized environment, even small disturbances in one region can create ripple effects worldwide. For example, a slowdown in China impacts commodity-exporting nations; a surge in U.S. interest rates affects emerging markets; fluctuations in crude oil prices influence inflation globally.
2. Currency Fluctuations and Their Global Impact
Currency fluctuations are among the most significant drivers of global economic stability or instability. When a currency strengthens or weakens sharply, it affects trade, investment flows, and economic confidence.
Effects of currency fluctuations:
a. Impact on trade competitiveness
A strong currency makes exports expensive and less competitive, while imports become cheaper. For example, if the U.S. dollar appreciates, American goods become costlier abroad, reducing demand. On the other hand, countries like India and China may benefit from increased export attractiveness when their currencies weaken.
b. Impact on inflation
When currencies depreciate, import costs rise—particularly for essential items like crude oil, machinery, and electronics. This triggers inflationary pressure. Countries dependent on imports face higher consumer prices due to currency volatility.
c. Impact on investment flows
Foreign investors seek stable and strong currencies. When a country experiences volatility, capital swiftly flows out (capital flight), causing market instability. This is often seen in emerging markets during global tightening cycles.
3. Interest Rate Fluctuations
Interest rate changes by central banks influence borrowing costs, saving behavior, consumption levels, and global capital flows.
a. Global spillover of U.S. Federal Reserve policies
Since the U.S. dollar is the world’s reserve currency, any interest rate hike by the U.S. Federal Reserve increases global borrowing costs. Emerging markets face pressure as investors withdraw funds to seek safer returns in the U.S.
b. Domestic impact
Higher interest rates slow economic activity by making loans expensive. Lower rates fuel borrowing and spending but may also create asset bubbles.
c. Impact on global debt
High global interest rates increase repayment burdens for countries with large external debt, especially developing nations. This may lead to financial instability or even sovereign debt crises.
4. Commodity Price Fluctuations
Commodity prices—especially oil, gas, metals, and agricultural products—play a vital role in shaping the global economic landscape.
a. Oil price fluctuations
Oil price volatility affects inflation, transportation costs, energy bills, and manufacturing. Oil-importing countries (like India, Japan, and many European nations) face rising fiscal pressure when oil prices surge. Conversely, oil-exporting economies (Saudi Arabia, Russia, Nigeria) benefit during periods of high prices but face deficits during downturns.
b. Impact on commodity-dependent economies
Countries like Brazil, Chile, and Australia depend heavily on iron ore, copper, and agricultural exports. Price fluctuations in these commodities directly affect GDP growth, employment, and government revenues.
c. Supply chain disruptions
Fluctuations in raw material prices disrupt global supply chains, increasing production costs for industries like automobiles, electronics, and construction.
5. Stock Market Fluctuations
Global stock markets reflect investor sentiment and economic expectations. Fluctuations in major indices such as the S&P 500, FTSE, Nikkei, and Sensex create global impact.
a. Wealth effect
When stock markets rise, household wealth increases, encouraging more spending. A crash leads to reduced consumption and lower economic activity.
b. Corporate investment
Volatile markets discourage companies from raising capital or expanding operations. This slows innovation and productivity growth.
c. Contagion effect
Due to global integration, a crash in one major market triggers panic worldwide. The 2008 financial crisis is a classic example where U.S. mortgage market instability led to a global recession.
6. Inflation and Deflation Fluctuations
Price fluctuations are crucial indicators of economic stability.
a. High inflation
High inflation erodes purchasing power and reduces real income levels. Businesses face higher production costs, reducing profitability. Central banks respond by raising interest rates, affecting global growth.
b. Deflation
Deflation causes weak demand, lower profits, and layoffs. Japan’s deflationary period demonstrated how prolonged price declines can stall economic growth for decades.
c. Global inflation shocks
Supply chain disruptions, geopolitical tensions, and crude oil price spikes can cause inflation globally, as seen during the post-pandemic period.
7. Geopolitical and Policy Fluctuations
Political instability, trade wars, sanctions, and regulatory changes directly affect global markets.
a. Trade war fluctuations
Tariff battles between major economies like the U.S. and China disrupt global supply chains and increase the cost of goods worldwide.
b. Sanctions and conflict
Geopolitical tensions—such as the Russia–Ukraine conflict—create energy shortages, disrupt trade routes, and trigger commodity price surges.
c. Policy unpredictability
Frequent changes in trade rules, taxation, or environmental regulations create uncertainty for businesses, discouraging investment.
8. Technology-Induced Fluctuations
Technological disruptions also create global economic fluctuations.
Automation impacts job markets and manufacturing costs.
Digital currencies and blockchain challenge traditional financial systems.
Rapid adoption of AI reshapes business models and productivity trends.
While technology boosts efficiency, sudden transitions can destabilize industries and labor markets.
9. Impact on Global Trade and Supply Chains
Global supply chains are particularly sensitive to fluctuations.
a. Disruptions reduce production
Events like pandemics, port closures, war, or climate disasters delay shipping times and reduce inventory availability.
b. Rising logistics costs
Fluctuations in freight rates, fuel prices, and shipping routes increase production costs globally.
c. Shift toward localization
Companies are increasingly diversifying supply chains (China+1 strategy) to manage risk.
10. Social and Employment Effects
Economic fluctuations influence employment patterns and income levels.
During downturns, layoffs increase, reducing household consumption.
Wage stagnation becomes common during deflationary phases.
Social inequality widens as lower-income groups suffer more during volatility.
Governments must balance growth with welfare support to maintain social stability.
Conclusion
Fluctuations are inherent to the global economic system. As markets, nations, and industries become more interconnected, even minor shocks can create significant global ripple effects. Currency volatility, interest rate changes, commodity price swings, and geopolitical developments all shape the world economy’s performance.
Managing these fluctuations requires stronger global cooperation, sound monetary policies, diversified supply chains, and robust risk-management strategies. While fluctuations can create uncertainty and risk, they also present opportunities for adaptation, innovation, and long-term economic resilience.

Global Currency Adventure in the Trade Market1. The Foundation of the Global Currency System
At the heart of global trade lies the exchange of currencies. When a country imports goods, it must purchase the exporter’s currency. Similarly, when firms invest across borders, they need to convert money into the host country’s currency. This constant exchanging gives value to each currency based on supply and demand.
Today’s global currency system operates under floating exchange rates, meaning currencies move freely based on market forces. Unlike the earlier gold-standard era or the post–World War II Bretton Woods system, most currencies now fluctuate day-to-day. This flexibility has increased financial freedom but also created higher volatility—making currency markets more adventurous and risky.
2. Major Players in the Currency Adventure
The global currency journey is shaped by several participants:
Central Banks
Institutions like the Federal Reserve (USA), European Central Bank, Reserve Bank of India, and Bank of Japan influence currency values through interest rate policies, inflation control, and monetary interventions. Their announcements often create dramatic market moves.
Commercial Banks
These banks facilitate currency conversion for businesses, governments, and individuals. Their massive transactions give them significant power in the forex market.
Multinational Corporations
Global companies like Apple, Toyota, and Samsung hedge currency risks because their revenues come from multiple countries. Their transactions often shift supply and demand for specific currencies.
Investors and Traders
Speculators search for profit by predicting currency movements. Their rapid trades increase market liquidity and volatility.
Governments
Policies like trade tariffs, sanctions, or foreign investment regulations can strengthen or weaken a currency.
Together, these players create a vibrant, never-ending cycle of currency flows that keeps the global trade market alive.
3. Currency Value: What Makes It Rise or Fall?
Currency movements are driven by a combination of economic, political, and psychological factors:
a. Interest Rates
Higher interest rates attract foreign investors seeking better returns. This increases currency demand and strengthens it. Lower rates often weaken currencies.
b. Inflation
Low inflation makes a currency more valuable because purchasing power is preserved. High inflation erodes value.
c. Economic Data
GDP growth, unemployment rates, retail sales, manufacturing output, and trade balance reports influence how strong a country’s economy appears—impacting its currency.
d. Political Stability
Countries with stable governments attract investment and boost currency strength. Political uncertainty weakens confidence and triggers currency sell-offs.
e. Global Market Sentiment
Fear or optimism fuels speculative behavior. During global crises, safe-haven currencies like the U.S. dollar, Swiss franc, and Japanese yen strengthen.
Understanding these factors is crucial for navigating the adventure of currency markets.
4. Currency Wars: When Nations Compete to Devalue
A notable chapter in the global currency adventure involves currency wars—situations where nations try to intentionally weaken their own currencies to make exports cheaper. A weaker currency helps domestic industries by increasing their global competitiveness.
However, currency wars can lead to:
Trade tensions
Retaliatory responses
Inflation challenges
Global market instability
Examples include Japan’s attempt to weaken the yen in the 2010s, China’s devaluation strategies, and emerging market interventions to protect exports.
5. Currency and Global Trade: A Symbiotic Relationship
The strength of a currency directly affects trade.
Strong Currency Effects
Imported goods become cheaper
Exports become expensive
Trade deficits may widen
For example, a strong U.S. dollar makes imported electronics cheaper for Americans but makes American agricultural exports costly for foreign buyers.
Weak Currency Effects
Exports become cheaper
Imports become costlier
Domestic industries benefit
Trade surplus may improve
Countries like China have historically benefited from controlled currency management to boost exports.
The balance between export competitiveness and import affordability is a delicate dance that shapes trade policies worldwide.
6. The Technological Revolution in Currency Trading
Advancements in technology have transformed the forex market:
Algorithmic Trading
Computer-driven strategies execute millions of trades within milliseconds. Algorithms detect patterns, news events, and price anomalies faster than humans.
Blockchain and Digital Currencies
Cryptocurrencies like Bitcoin have introduced decentralized finance into global markets. Central banks are also developing CBDCs (Central Bank Digital Currencies) to modernize monetary systems.
AI & Machine Learning
AI predicts price movements, analyzes sentiment, and automates risk management.
These innovations add new layers to the currency adventure, making markets more accessible yet more complex.
7. Currency Hedging: Managing Risks in International Trade
Since currency values fluctuate continuously, businesses face the risk of losing money if rates move unfavorably. To protect themselves, they use:
Forward Contracts – agreements to exchange currencies at a future date at a fixed rate.
Futures Contracts – exchange-traded versions of forward contracts.
Options – the right (but not obligation) to buy or sell at a predetermined rate.
Swaps – exchanging currencies and interest payments over time.
Hedging ensures stable profits and predictable costs, especially for exporters and importers.
8. Currency Crises: When the Adventure Turns Dangerous
History shows that currencies can collapse dramatically:
Asian Financial Crisis (1997)
Argentine Peso Crash (2001)
Russian Ruble Crisis (2014)
Turkish Lira Hyper-Inflation (2018-2022)
These crises often involve:
Excessive foreign debt
Weak economic fundamentals
Political instability
Market panic
When a currency collapses, inflation skyrockets, imports become unaffordable, and economies suffer deep recessions.
9. The Future of Global Currency Adventure
The currency landscape is evolving rapidly. Trends shaping the future include:
Digitalization of Money
CBDCs will modernize cross-border transactions, reduce settlement time, and bring transparency.
De-Dollarization Efforts
Many nations are reducing dependency on the U.S. dollar to avoid geopolitical risks.
Rise of Regional Currency Alliances
Groups like BRICS are exploring unified digital payment systems and currency baskets.
Greater Speculation and Liquidity
With technology connecting global traders 24/7, volatility and opportunities will continue to grow.
Conclusion
The global currency adventure in the trade market is a complex, thrilling journey filled with risk, opportunity, and constant change. Currencies are the heartbeat of global trade; they influence prices, profits, investments, and economic power. As nations develop, technologies advance, and geopolitical dynamics evolve, currency markets will remain one of the most fascinating and essential components of global finance.

Investors, Traders, and Policymakers in the Global Market1. Investors in the Global Market
Investors are individuals or institutions that allocate capital with the expectation of earning returns over time. They play a crucial role in providing long-term funds for companies, governments, and global economic growth.
Types of Investors
Retail Investors – Individuals investing in stocks, bonds, mutual funds, ETFs, or real estate. Their participation has increased globally due to online trading platforms and financial awareness.
Institutional Investors – Large entities such as:
Pension funds
Sovereign wealth funds
Insurance companies
Mutual funds
Hedge funds
Endowments
These investors manage trillions of dollars and have significant influence on asset prices.
Foreign Institutional Investors (FIIs) – Non-local institutions investing in global markets. FIIs affect exchange rates, liquidity, and capital flows.
Angel Investors & Venture Capital Firms – Provide capital to startups, influencing innovation and technological development.
Role of Investors
Capital Formation: Investors provide long-term capital that fuels business expansions, infrastructure projects, and technological advancement.
Market Depth and Liquidity: Institutional investors add liquidity, allowing efficient price discovery.
Risk Distribution: Through diversified portfolios, investors help redistribute economic and financial risks across the market.
Corporate Governance: Large shareholders influence company management and strategic decisions.
Economic Growth: Investments create jobs, improve productivity, and stimulate economies.
Investor Behaviour
Investor decisions are influenced by:
Expected returns
Interest rates
Geopolitical conditions
Macroeconomic indicators (GDP, inflation, fiscal policies)
Corporate earnings
Risk appetite
Long-term investors focus on stability and compounding, while others maximize returns through active asset allocation.
2. Traders in the Global Market
Traders are market participants who seek short-term profits from price movements of financial assets. Unlike investors who focus on long-term value, traders capitalize on volatility and momentum.
Types of Traders
Day Traders – Open and close trades within the same day.
Swing Traders – Hold positions for days to weeks based on trend patterns.
Scalpers – Execute dozens or hundreds of trades daily for small price differences.
Algorithmic & High-Frequency Traders – Use automated systems to trade large volumes within milliseconds.
Prop Traders – Trade using a firm’s capital to generate profits.
Arbitrage Traders – Exploit price differences between markets or assets.
Role of Traders
Providing Liquidity: Traders keep markets fluid, enabling buyers and sellers to transact easily.
Efficient Pricing: They quickly incorporate new information into asset prices.
Market Discipline: Through speculation and short selling, traders expose weak companies and overpriced assets.
Market Support During Volatility: During high volatility, traders provide counter-orders that reduce extreme price swings.
Tools Traders Use
Technical analysis (charts, indicators, patterns)
Fundamental analysis (earnings, news, macro data)
Algo-trading systems
Options, futures, commodities, currencies, crypto
Global market correlations (oil, gold, dollar index, bond yields)
Behavioural Aspects of Traders
High risk tolerance
Dependence on market psychology
Quick decision-making
Emphasis on timing rather than long-term value
Traders thrive on volatility; hence global uncertainties often create profitable opportunities.
3. Policymakers in the Global Market
Policymakers include governments, central banks, regulatory bodies, and international economic institutions. Their decisions shape the macroeconomic environment and influence market behaviour worldwide.
Key Policymakers
Central Banks – Such as the Federal Reserve (US), ECB (Eurozone), RBI (India), Bank of Japan, etc.
Government Fiscal Authorities – Ministries of finance, treasury departments.
Market Regulators – SEBI (India), SEC (USA), FCA (UK).
International Institutions – IMF, World Bank, BIS, WTO, OECD.
Trade and Commerce Departments – Regulate tariffs, quotas, and trade agreements.
Major Roles of Policymakers
Monetary Policy: Managing interest rates, money supply, and inflation.
Fiscal Policy: Government spending, taxation, incentives, or austerity measures.
Financial Regulation: Ensuring market transparency, stability, and investor protection.
Currency Management: Adjusting exchange rate policies to support trade competitiveness.
Crisis Management: Responding to recessions, banking failures, or market crashes.
Trade Policies: Deciding tariffs, sanctions, treaties, and economic partnerships.
Impact of Policymakers on Global Markets
Interest Rate Decisions: Affect borrowing costs, investment activity, and global capital flows.
Inflation Control: Rising inflation leads to tight monetary policy and volatility.
Geopolitical Policies: Sanctions, wars, and trade agreements influence commodities, currencies, and stock markets.
Regulatory Changes: New rules can attract or restrict investment.
Stimulus Packages: Boost consumption and liquidity during downturns.
Policymakers set the environment within which investors and traders operate.
4. Interactions Between Investors, Traders, and Policymakers
The global market functions through dynamic interactions among these three groups.
How Policymakers Influence Investors
Lower interest rates make equities and riskier assets attractive.
Fiscal stimulus boosts corporate earnings prospects.
Regulatory stability attracts long-term capital.
How Policymakers Influence Traders
Economic data releases (CPI, GDP, employment numbers) trigger high volatility.
Monetary policy decisions create price movements that traders profit from.
Unexpected announcements (rate hikes, sanctions) cause sharp market reactions.
How Investors Influence Policymakers
Large institutional investors can lobby governments for favorable tax laws or policies.
How Traders Influence Markets
Heavy trading can increase liquidity and drive short-term price trends, which investors may consider in their decisions.
Conclusion
Investors, traders, and policymakers form the backbone of the global financial system. Investors provide essential long-term capital and stability, traders add liquidity and efficiency through rapid transactions, and policymakers create the economic framework and maintain stability. Their combined actions shape global economic growth, determine market cycles, and influence asset prices worldwide. Understanding their roles helps anyone—from beginners to professionals—grasp how the global market operates and how financial decisions ripple across countries and economies.
Consumer Price Index (CPI) Data in the Global Market1. Meaning of CPI and Why It Matters
CPI measures the average change in prices paid by consumers for a set of goods and services over time. This “basket” typically includes:
Food and beverages
Housing
Transportation
Apparel
Medical care
Education
Recreation
Communication and utilities
Because CPI directly represents consumer purchasing power, it helps economists determine whether the cost of living is rising or falling. In the global context, CPI is a major tool for comparing economic conditions across countries. Large economies like the US, EU, China, India, and Japan publish CPI monthly, influencing global financial markets.
2. CPI and Inflation: The Core Relationship
Inflation is the rate at which prices rise, reducing the value of money. CPI serves as the most widely accepted measure of consumer inflation. When CPI rises sharply:
Consumers pay more for the same goods
Savings lose value
Borrowing may become costlier if interest rates rise
Businesses face higher input costs
When CPI rises moderately, it often signals healthy economic growth. Very low or negative CPI (deflation) suggests weak demand and economic slowdown.
3. Types of CPI: Headline and Core Inflation
Headline CPI
Includes all items in the basket, including volatile components like food and energy.
Strongly influenced by fuel prices, supply chain issues, weather shocks.
Core CPI
Excludes food and energy to reflect long-term inflation patterns.
Used by central banks to design monetary policies.
In the global market, core CPI is often viewed as the more stable and reliable indicator because it filters out short-term price volatility.
4. How Countries Use CPI in the Global Market
1. Monetary Policy Decisions
Central banks such as the Federal Reserve (US), ECB (Eurozone), Bank of England, RBI (India), and Bank of Japan rely heavily on CPI numbers.
If CPI rises above the target, central banks typically raise interest rates to control inflation.
If CPI falls below the target, they cut interest rates to stimulate demand.
Interest rate changes influence capital flows across borders, making CPI a global market mover.
2. Currency Market Impact
Currency traders react strongly to CPI releases because inflation affects interest rate expectations.
Higher CPI → Higher inflation → Higher probability of interest rate hikes → Currency strengthens
Lower CPI → Lower inflation → Rate cuts possible → Currency weakens
For example, a positive US CPI surprise often leads to a stronger US dollar, impacting emerging market currencies.
3. Trade Competitiveness
CPI also reflects the relative price competitiveness of a country. High inflation may make a country’s goods more expensive globally, reducing export competitiveness.
5. CPI Effects on Global Financial Markets
1. Stock Markets
CPI data significantly affects stock indices like the S&P 500, Dow Jones, Nikkei, Nifty, and FTSE.
High CPI is often negative for equities
Signals inflation pressure
Higher interest rates reduce corporate profits
Consumer spending may slow
Moderate CPI growth is positive
Signals healthy demand
Supports corporate earnings
Indicates stable economic expansion
Growth sectors like technology react strongly to CPI because they rely on cheaper capital.
2. Bond Markets
Bond prices and yields react instantly to CPI.
If CPI rises, bond yields rise because investors demand higher returns to compensate for inflation.
If CPI falls, yields may decrease as inflation expectations ease.
Government bonds (US 10-year Treasury, German Bunds, UK Gilts) are highly sensitive to CPI surprises.
3. Commodity Markets
Inflation affects commodity prices directly:
Oil and energy: Higher CPI reflects demand pressure.
Gold: A hedge against inflation; tends to rise when CPI is high.
Agricultural commodities: CPI reflects food inflation trends.
Global commodity traders watch CPI to anticipate supply-demand dynamics.
6. CPI and Global Economic Stability
1. Inflation Targeting
Most central banks aim for inflation around 2%, as this level supports stable growth.
Too much or too little inflation affects global trade and investment decisions.
2. Emerging Markets Impact
Emerging markets like India, Brazil, and South Africa are highly sensitive to global CPI trends:
Rising US CPI may cause capital outflows from emerging markets.
Higher domestic inflation may pressure their currencies and foreign reserves.
Thus, CPI is crucial for maintaining macroeconomic stability.
7. Factors Influencing CPI in the Global Market
Several global forces drive CPI fluctuations:
1. Supply Chain Disruptions
Events like pandemics, wars, logistics delays, and shipping container shortages cause shortages and price spikes.
2. Commodity Prices
Oil prices directly impact transportation, manufacturing, and food costs.
3. Currency Movements
A weaker currency makes imports costlier, raising national CPI.
4. Geopolitical Tensions
Wars or sanctions can disrupt energy and food supply, increasing inflation.
5. Global Demand Cycles
Strong global demand (e.g., during recovery phases) tends to increase CPI.
8. CPI and the Future of Global Markets
The role of CPI is expanding as economies become more interconnected. Some future trends include:
1. AI and Big Data in CPI Measurement
Governments increasingly use digital tools to track price changes across online marketplaces.
2. Climate Change and CPI
Extreme weather events may raise food and energy prices globally, influencing CPI patterns.
3. Deglobalization and Supply Chain Reshoring
Countries shifting production back home may face temporary inflation spikes.
4. Rising Importance of Core CPI
As economies evolve, stable long-term indicators are becoming more important for policymakers.
Conclusion
CPI data plays a central role in shaping global market trends. It influences interest rates, currency values, bond yields, stock prices, and trade competitiveness. For investors, traders, businesses, and policymakers, CPI is not merely a number—it is a key indicator of economic health, inflationary pressures, and future financial conditions. Understanding CPI helps decode the direction of global markets and anticipate policy shifts that shape the global economic landscape.
Global Commodity Market1. Meaning of Global Commodity Market
A commodity market is a marketplace where traders, producers, governments, investors, and consumers engage in the buying and selling of natural resources. These commodities are standardized, meaning one unit of the commodity is identical to another unit. For example, one barrel of Brent crude oil is considered identical to another barrel of the same grade.
The global commodity market operates through:
Spot markets – immediate delivery
Futures markets – delivery at a future date
Derivative markets – options, forwards, swaps
It allows price discovery, hedging, risk management, and global distribution of critical resources.
2. Types of Commodities
The global commodity market is broadly divided into two major categories:
A. Hard Commodities
These are natural resources that are mined or extracted.
Energy Commodities
Crude oil (Brent, WTI)
Natural gas
Coal
Gasoline
Energy is the largest and most traded commodity segment globally.
Metals
Precious metals: gold, silver, platinum
Base metals: copper, aluminum, zinc, nickel
Metals are crucial for construction, manufacturing, electronics, and industrial production.
B. Soft Commodities
These are agricultural or livestock products.
Agricultural Commodities
Wheat, rice, corn
Sugar, coffee, cocoa
Cotton, soybeans, palm oil
Livestock
Cattle
Pork bellies
Dairy products
Soft commodities are essential for food production, clothing, and consumer goods industries.
3. Major Commodity Exchanges
Global commodity trading takes place on several major exchanges:
Chicago Mercantile Exchange (CME), USA
Chicago Board of Trade (CBOT), USA
New York Mercantile Exchange (NYMEX)
London Metal Exchange (LME), UK
Intercontinental Exchange (ICE)
Multi Commodity Exchange (MCX), India
These exchanges provide platforms for futures trading, price benchmarking, delivery, and settlement.
4. How Commodity Trading Works
Spot Trading
The commodity is delivered immediately and payment is done on the spot. For example, a refinery buying crude oil for immediate refining.
Futures Trading
A futures contract is an agreement to buy or sell a commodity at a fixed price at a future date. Futures trading helps in:
Hedging price risk
Speculation
Arbitrage
Portfolio diversification
Options Trading
Options give the right but not the obligation to buy (call) or sell (put) a commodity at a predetermined price.
Derivative Instruments
Forwards
Swaps
Index-based contracts
These instruments help manage price volatility.
5. Price Determination in Commodity Markets
Commodity prices fluctuate constantly due to global supply and demand dynamics. Key factors affecting pricing include:
A. Supply Factors
Production levels
Mining output
Agricultural yield
Weather conditions
Natural disasters
Political instability in producing countries
For example, geopolitical tensions in the Middle East immediately impact crude oil supply and prices.
B. Demand Factors
Industrial growth
Manufacturing output
Energy consumption patterns
Global economic cycles
Consumer behavior
Countries like China, India, and the US heavily influence global demand for metals and energy.
C. Geopolitical Events
Wars, sanctions, export bans, and diplomatic conflicts significantly affect prices.
D. Speculation and Investor Sentiment
Large hedge funds and financial institutions influence market prices through large trading volumes.
E. Currency Movements
Most commodities are priced in US dollars, so when the dollar strengthens, commodity prices generally fall, and vice versa.
6. Role of Commodities in Global Economy
The global commodity market influences:
A. Inflation
When commodity prices rise, production costs increase, leading to higher consumer prices.
B. Trade Balance
Commodity-exporting countries (e.g., Saudi Arabia, Russia) benefit from high prices, while importing nations face trade deficits.
C. Government Revenues
Many countries depend on commodity exports for fiscal income. For example:
Oil revenues in Gulf countries
Copper revenues in Chile
Agricultural exports in Brazil
D. Industrial Growth
Commodities are essential raw materials. Energy, metals, and agricultural goods directly affect the manufacturing and services sectors.
7. Participants in the Global Commodity Market
A. Producers
Oil companies, miners, farmers, and government bodies that supply commodities.
B. Consumers
Refineries, factories, food companies, textile mills, and energy generators.
C. Traders
Individuals and institutions who buy and sell for profit.
D. Hedgers
Businesses use commodity futures to protect against price volatility.
E. Speculators
Take positions in commodities to profit from price fluctuations.
F. Governments
Play a key role through regulations, import/export policies, and strategic reserves.
8. Challenges in Global Commodity Markets
A. Price Volatility
Commodity prices are extremely sensitive to global events and may change rapidly.
B. Geopolitical Risks
Wars, sanctions, and political disputes disrupt supply chains and increase uncertainty.
C. Climate Change
Extreme weather events affect agricultural output, water availability, and mining conditions.
D. Market Manipulation
Large players may attempt to influence prices through hoarding or cartel-like behavior.
E. Supply Chain Bottlenecks
Shipping disruptions, port closures, or labor shortages can halt the movement of commodities.
9. Future Trends in the Global Commodity Market
A. Renewable Energy Boom
Demand for metals like lithium, cobalt, nickel, and copper is rising due to electric vehicles and green energy.
B. Digitalization and AI
Algorithmic trading and real-time analytics are transforming commodity trading efficiency.
C. Sustainable Agriculture
Countries are investing in climate-friendly farming and supply chains.
D. Commodity Tokenization
Blockchain may enable digital trading of commodity-backed tokens.
E. Shift in Global Demand
Asia, particularly India and China, will continue to drive commodity consumption.
Conclusion
The global commodity market is a dynamic and essential component of the world economy. It connects producers, consumers, governments, and financial institutions in a vast network of trade and investment. As commodities form the backbone of industrial production, energy supply, and food systems, their prices and availability influence economic growth, inflation, and geopolitical strategies. Although the market is complex and often volatile, it provides opportunities for risk management, investment, and global economic development. Understanding how the commodity market works is crucial for businesses, policymakers, and investors navigating today’s interconnected world.
Factors That Can Affect the Global Market1. Economic Indicators and Growth Rates
Economic performance is one of the biggest factors influencing the global market. Key indicators such as GDP growth, inflation, employment rates, and industrial output shape expectations about a country’s economic stability.
Strong economic growth increases foreign investment, boosts trade volumes, and encourages risk-taking in global markets.
Weak or negative growth leads to reduced consumer spending, falling demand for imports, and declining stock markets.
Inflation also plays a crucial role. High inflation reduces purchasing power and forces central banks to raise interest rates, slowing down economic activity. Conversely, low and stable inflation creates a favorable business environment.
2. Monetary Policy and Interest Rates
Central banks—such as the US Federal Reserve, European Central Bank, Reserve Bank of India, and Bank of Japan—heavily impact the global market through monetary policy decisions.
Interest rate hikes make borrowing expensive and strengthen the country’s currency. This can reduce stock prices, lower commodity demand, and slow global economic activity.
Interest rate cuts stimulate spending and investment, often pushing global markets upward.
When the US Federal Reserve changes interest rates, the effects ripple across the entire world because the US dollar is the dominant currency in global trade and investment.
3. Geopolitical Tensions and International Conflicts
Geopolitics is a major source of uncertainty in global markets. Conflicts such as US-China tensions, Middle East instability, or Russia-Ukraine conflict affect oil prices, supply chains, trade agreements, and investor confidence.
Wars and conflicts disrupt production and trade routes.
Sanctions limit access to markets and resources.
Political instability causes capital flight and currency devaluation.
Geopolitical risk is especially influential in the energy market, since oil and gas supplies are concentrated in politically sensitive regions.
4. Global Trade Policies and Agreements
Changes in trade relationships between nations strongly affect the global market. Trade agreements promote economic cooperation, while trade wars disrupt supply chains and increase costs.
Tariffs raise the price of goods, reducing demand and affecting corporate profits.
Free trade agreements (FTAs) encourage cross-border business and lead to market expansion.
Import/export restrictions can disrupt sectors that rely on global sourcing.
For example, restrictions in semiconductor exports can impact global electronics, automotive, and technology markets.
5. Technological Advancements and Innovation
Technology drives global market growth by improving efficiency, reducing production costs, and creating new industries. Major technological breakthroughs—such as AI, automation, blockchain, electric vehicles, and biotechnology—reshape sector dynamics worldwide.
Companies adopting new technologies gain competitive advantages.
Older industries may decline due to technological disruption.
Tech-heavy stock markets, like NASDAQ, influence global investor sentiment.
Digitalization has also globalized financial markets through faster trading platforms, online banking, and the growth of cryptocurrencies.
6. Currency Fluctuations and Exchange Rates
Foreign exchange (forex) markets play a pivotal role in global trade. Currency appreciation or depreciation affects international competitiveness.
A strong currency makes exports expensive and imports cheaper.
A weak currency boosts exports but increases the cost of imported goods.
For multinational companies, exchange rate volatility can significantly impact revenue and profitability. Investors also shift capital towards countries with stable or strengthening currencies.
7. Commodity Prices (Oil, Gold, Metals, Agriculture)
Commodity markets deeply influence global economic conditions. Key commodities include crude oil, natural gas, gold, silver, iron ore, wheat, and soybeans.
Oil prices affect transportation, manufacturing, and energy sectors worldwide. Rising oil prices increase inflation and production costs.
Gold prices act as a safe-haven indicator; during global uncertainty, investors buy gold, raising its price.
Agricultural commodities influence food prices and inflation.
Commodity exporters benefit from high prices, while import-dependent nations face economic pressure.
8. Supply Chain Disruptions
Global supply chains are highly interconnected. Events like pandemics, natural disasters, port congestion, and logistical shortages disrupt the flow of goods.
Disruptions lead to:
Higher transportation costs
Delays in production
Shortages of essential components
Increased inflation globally
The COVID-19 pandemic was a major example of how supply chain disruption can destabilize markets for years.
9. Corporate Performance and Market Sentiment
Global markets are influenced by the performance of major corporations. Earnings reports, product launches, mergers, and acquisitions impact investor sentiment and stock indices.
Positive earnings push markets upward.
Weak performance causes sell-offs.
Large multinational companies—like Apple, Amazon, Google, and Tesla—have global customer bases, so their performance influences markets worldwide.
10. Environmental Changes and Climate Risks
Climate change is increasingly shaping global markets. Extreme weather events—such as floods, droughts, and hurricanes—affect agriculture, energy supply, insurance costs, and infrastructure.
Renewable energy investments are rising.
High carbon-emission sectors face regulatory pressure.
Climate events disrupt commodity supply and productivity.
Global markets now price in climate risks as part of long-term investment decisions.
11. Global Health Crises and Pandemics
Health emergencies like pandemics create widespread market disruptions:
Industries like travel, tourism, aviation, and hospitality decline sharply.
Healthcare, pharmaceuticals, e-commerce, and technology see rapid growth.
Consumer behavior shifts dramatically.
The global impact of COVID-19 highlighted how health crises can slow economic growth and trigger global recessions.
12. Investor Psychology and Market Trends
Human behavior and sentiment also affect the global market. Fear, greed, and expectations drive short-term price movements.
Key psychological phenomena include:
Panic selling during crises
Speculative bubbles
Trends created by social media or news
Market sentiment often amplifies economic or geopolitical events.
Conclusion
The global market is influenced by a complex network of factors—economic performance, political stability, technological innovation, currency movements, natural disasters, and investor sentiment. Each factor interacts with others, creating a constantly shifting environment. Understanding these drivers helps traders, businesses, and policymakers anticipate global trends, manage risks, and make informed decisions. Whether it is a change in interest rates, a geopolitical conflict, or a supply chain disruption, every event sends waves across the global economy, shaping the future of world markets.

Banks and Global Markets: Their Crucial Role in World Trade1. Banks as the Financial Backbone of Global Trade
Banks have always played a central role in international commerce. From early merchant banking in medieval Europe to today’s digital global banking networks, banks provide the essential functions that allow trade to happen smoothly and safely.
1.1 Facilitating International Payments
The most basic function of banks in world trade is cross-border payments.
Exporters often demand payment certainty, and importers want delivery assurance. Banks bridge this trust gap using instruments such as:
SWIFT-based international transfers
Letters of Credit (LCs)
Bills of exchange
Bank guarantees
Documentary collections
A Letter of Credit, for example, ensures the exporter receives payment once shipment documents are provided and verified. This reduces default risk significantly and increases trade participation, especially in emerging markets where trust and creditworthiness are uncertain.
1.2 Financing Trade Operations
Trade finance is one of the oldest and largest banking activities. Banks provide capital for:
Pre-shipment finance (raw materials, manufacturing)
Post-shipment finance (waiting for payment)
Export credit from export-import banks
Foreign currency loans to purchase goods
Supply chain financing
Global trade is a long cycle—goods take time to produce, ship, and sell. Banks keep the cycle running by injecting liquidity, enabling even small companies to engage in large transactions.
1.3 Currency Exchange and Forex Operations
Every international transaction involves at least two currencies. Banks:
convert currencies for exporters and importers
provide hedging instruments (forwards, futures, swaps)
stabilize businesses against currency volatility
Since foreign exchange markets trade over $7 trillion per day, banks play a large role in making global trade more predictable by protecting businesses from sudden currency swings.
1.4 Risk Management and Trade Insurance
Trade naturally involves:
political risk
credit risk
transport risk
currency risk
legal and regulatory risk
Banks partner with insurers, export credit agencies, and global institutions to reduce these risks. For example, an exporter doing business in a politically unstable country may rely on export credit insurance provided through banks. Without such risk-mitigation tools, global trade flows would shrink dramatically.
2. The Role of Global Markets in World Trade
Beyond banks, global markets — stock markets, bond markets, commodity markets, and currency markets — form the infrastructure that supports the expansion of world trade.
2.1 Financial Markets Provide Capital for Expansion
Stock exchanges and global bond markets give companies the ability to raise funds for:
international expansion
building factories and export infrastructure
acquiring foreign companies
research and development
modernizing supply chains
Multinational corporations like Toyota, Apple, or Tata operate globally because they access international investors who fund their growth.
2.2 Commodity Markets Set Global Prices
International trade depends heavily on commodities—oil, metals, food grains, energy, chemicals, and more. Commodity exchanges like:
NYMEX (oil and gas)
LME (metals)
CME (agriculture, energy)
help determine global benchmark prices.
These markets:
ensure price transparency
reduce volatility through futures contracts
allow producers and buyers to hedge price risks
influence shipping routes and logistics costs
For example, when crude oil prices rise, global transportation and manufacturing costs increase, directly affecting trade flows.
2.3 Foreign Exchange Markets Enable Global Pricing
The global forex market ensures that:
companies can price goods in stable currencies
exchange rates remain liquid
central banks can stabilize currency movements
investors can allocate capital globally
Because of forex markets, a business in India can export to Japan, price goods in USD, hedge currency risk, and receive converted INR payments seamlessly.
2.4 Global Bond Markets Support Government Trade Infrastructure
Governments borrow from global investors to build:
ports
highways
airports
logistics parks
customs facilities
These projects reduce trade barriers and enhance a country’s export competitiveness. Countries with better credit ratings borrow at cheaper rates, giving them an advantage in global trade.
3. Banks and Markets Work Together to Power World Trade
Banks and financial markets are deeply interconnected. Their cooperation harmonizes global trade flows.
3.1 Banks Operate Inside Global Markets
Banks participate in:
currency markets
commodity trading
government and corporate bond markets
derivatives markets
This allows them to provide hedging and financing services to customers engaged in international trade.
3.2 Capital Markets Reduce Dependence on Bank Loans
When companies raise equity or issue bonds, they reduce stress on banks, freeing up bank capital for trade finance. This creates a balanced financial ecosystem.
3.3 Digital Platforms and Fintech Strengthen the Relationship
New technologies are transforming global trade:
Blockchain-based trade finance reduces fraud
Digital LCs speed up transactions
Fintech exporters’ platforms simplify international payments
Cross-border instant payment networks lower costs
Banks and fintech firms are creating a more transparent, faster, and more inclusive global trade system.
4. The Global Role of Banks and Markets in Shaping World Trade Patterns
Financial systems do more than facilitate trade—they influence who trades, what is traded, and how trade grows.
4.1 Emerging Markets Gain Access to Global Buyers
Banks in developing countries partner with global institutions to integrate local businesses into world supply chains.
4.2 Financial Markets Boost Competition
Open global capital markets allow companies from any country to compete on equal terms. For example:
Indian IT firms
Chinese manufacturing companies
Southeast Asian textile exporters
grew faster due to access to foreign investment.
4.3 Crisis Management and Global Stability
During crises (like 2008 or 2020), central banks and global markets stabilize economies by:
injecting liquidity
reducing interest rates
supporting currency stability
protecting banks and trade credit
This support keeps world trade from collapsing.
Conclusion: Banks and Markets Are the Lifeblood of Global Trade
World trade depends fundamentally on the smooth functioning of banks and global markets. Banks provide the trust, credit, payment systems, and risk management essential to international transactions. Global markets supply capital, set global prices, enable hedging, and ensure liquidity across borders.
Together, they form the invisible infrastructure powering globalization. Without banks and markets, trade would be slow, risky, and extremely limited. With them, businesses of all sizes—from small exporters to multinational giants—can participate confidently in the world economy.

RSI DivergenceHello fellas,
This is a very classic textbook RSI divergence scenario where we see that rising price tops with lower RSI tops.
It means that even though price increased, the momentum has decreased.
When you see rising price + decreasing momentum = it usually means buyers are exhausted.
Buyers exhausted = weak buying = strong selling = price down.
Thank you,
-not a buy or sell recommendation. just sharing my idea regarding a very classic RSI divergence pattern and how did it look like.
Don't over complicate, don't think of ideas out of place. If there is confusion, it means you don't know what's happening. If it is clear as day light, it means it is clear as day light.
The market is the market, you can't control it. However, you can control your actions and learn from yourself. Though preferably not the hard way.
Easy to learn new things, but 10x harder to unlearn wrong things.

My Ideal Elliott Wave Entry ModelThe IMSETT 3/C Entry Model.
Every trader wants to catch the big moves the ones that pay quickly and decisively. In Elliott Wave, those moves often come during Wave 3. It's the strongest part of the trend, and when you're positioned early, the risk-to-reward is unmatched.
But not every opportunity hands you a clean Wave 3 on a silver platter. Sometimes you’re looking at a Wave C instead. That’s where the 3/C Entry Model comes in. It’s designed to get you aligned with high-conviction moves—whether the market is in a trend or a zig zag.
Here’s the edge: both Wave 3 and Wave C often start the same way—a strong, motive push off an AOI (area of interest), followed by a retracement. That shared structure gives us an anchor. Whether we’re labeling it a 3 or a C doesn’t change the fact that the initial impulse gives us clarity, direction, and a place to manage risk.
That’s what the IMSETT Model is built around:
Identify
Motive
Scout
Entry Plan
Track
Trade
Each step is focused, actionable, and repeatable. You're not trying to outguess the market—you’re reacting to structure, preparing for common behavior, and executing with intent.
I do have a video with a walk through.
This just the way I look for clarity in setups. As with everything in trading, nothing will work every time so do your own research this is not financial advice.
Cheers!
Trade Safe, Trade Clarity.

Supply & Demand vs Support & Resistance — Beyond the Lines“Two traders can look at the same level.
One sees a line.
The other sees the reason behind it.”
Most beginners start with Support & Resistance.
Advanced traders shift into Supply & Demand.
Both seem similar… and in some cases, they are the same.
But the difference lies in why price reacts — not just where.
Let’s break this down clearly.
1. Support & Resistance: The Surface Layer
Support and resistance are simple horizontal reaction levels.
Support
A price level where the market tends to bounce upward.
Resistance
A price level where the market tends to reject downward.
These levels represent crowd behavior.
Retail traders love them — which is why they often turn into liquidity pools.
Strength: easy to spot, widely used
Weakness: easily manipulated because stops cluster there
2. Supply & Demand: The Deeper Institutional Layer
Supply & Demand zones are created by imbalances — strong, one-sided moves driven by institutional orders.
To make the concept crystal clear:
Demand Zone
The last bearish candle (or group of candles) before a strong impulsive move upward, caused by institutional buying and imbalance.
Supply Zone
The last bullish candle (or group of candles) before a strong impulsive move downward, caused by institutional selling and imbalance.
These zones show where institutional buying or selling actually started.
Strength: precise entries, strong reaction zones
Weakness: requires deeper understanding and confirmation
3. How They Connect
This is where most traders get confused.
Support/Resistance = the reaction.
Supply/Demand = the reason for the reaction.
Many times:
A support level is formed because a demand zone sits right below it.
A resistance level is formed because a supply zone sits above it.
So yes — in many cases:
Demand = Support
Supply = Resistance
But only when the reaction was created by institutional imbalance.
4. When They Are NOT the Same
This is the part traders often miss.
❌ Support is NOT demand when:
• Price bounced many times (retail clustering)
• No strong bullish impulse originated there
• Candle structure shows hesitation, not institutional entry
This is just retail support, not a demand zone.
❌ Resistance is NOT supply when:
• Price tapped repeatedly (equal highs)
• No sharp drop came from that level
• The zone lacks displacement or imbalance
This is simply retail resistance, not a supply zone.
5. How to Use Both for Maximum Clarity
Here’s the practical way to combine them:
Use Support/Resistance to understand where retail will react.
Use Supply/Demand to understand where institutions will react.
Best workflow:
• Mark higher timeframe Supply/Demand
• Mark intraday Support/Resistance
• Wait for price to move between these layers
• Look for confirmation (ChoCH/BOS) at the real institutional zone
• Avoid taking trades directly at retail S/R without deeper context
This gives you direction, patience, and precision.
Example (XAUUSD)
Refer to M15 chart above:
Price respected an intraday support level,
but the real reversal happened only after tapping the demand zone below it,
where imbalance and institutional orders existed.
Support showed the bounce.
Demand explained the bounce.
One shows the line.
The other shows the truth behind the line.
📘 Shared by @ChartIsMirror
Do you trade with support and resistance, supply and demand, or a mix of both?
Share what you see — your approach reveals how you read the market’s story.

Climate Change Impact on the Global Market1. Economic Disruptions and Global GDP Impact
Climate change directly affects global economic output through productivity losses, infrastructure damage, agricultural decline, and health impacts. Increasing temperatures reduce labor productivity, especially in agriculture, construction, and manufacturing. Coastal economies face rising costs due to sea-level rise, threatening ports, factories, and tourism hubs.
Studies consistently estimate that unmitigated climate change could reduce global GDP by 10–20% by 2100, with disproportionate impacts on developing regions such as South Asia, Africa, and Southeast Asia. These regions face intensified heatwaves, droughts, and floods that strain food systems and public resources. Conversely, countries with cooler climates may experience temporary benefits, such as longer growing seasons, yet these are overshadowed by global supply-chain disruptions and market volatility.
2. Supply Chain Disruptions and Global Trade
Climate change poses a serious threat to global supply chains that depend on stable transportation networks, predictable weather, and consistent resource availability. Extreme weather events—such as floods in China, heatwaves in Europe, and hurricanes in the US—regularly disrupt manufacturing hubs, ports, and logistics networks.
For example:
Flooding disrupts industrial zones in China, Thailand, and India, impacting electronics, automobiles, and textile production.
Droughts reduce water availability for hydropower and manufacturing, affecting production costs and reliability.
Hurricanes halt shipping lanes and damage ports, slowing global trade flows.
Industry giants are now diversifying suppliers, relocating production, and investing in climate-resilient infrastructure. Companies increasingly factor climate risk into procurement and logistics decisions, making climate resilience a competitive advantage.
3. Agriculture, Food Prices, and Commodity Markets
Agriculture is among the most vulnerable sectors. Shifting rainfall patterns, extreme heat, soil degradation, and water scarcity reduce crop yields for staples like wheat, rice, maize, and soy. These disruptions trigger volatility in global food markets.
Key impacts include:
Reduced yield stability, making long-term pricing unpredictable.
Increased input costs due to water scarcity and changing pest patterns.
Price spikes in commodities such as grains, edible oils, and sugar.
Higher insurance and credit costs for farmers exposed to climate risks.
Livestock and fisheries also suffer, with warming oceans affecting fish stocks and coral reefs. As food prices rise and become more volatile, inflationary pressures build across developing economies, impacting household budgets and political stability.
4. Energy Markets and the Shift to Renewables
Climate change drives a massive transition in global energy systems. Governments and corporations worldwide are shifting from fossil fuels to renewable energy sources like solar, wind, hydropower, hydrogen, and bioenergy. This shift impacts global markets in several ways:
A. Decline of Fossil Fuels
Oil, gas, and coal sectors face decreasing long-term demand due to carbon regulations, electric vehicle growth, and renewable adoption. Major oil companies are diversifying portfolios into green energy and carbon capture technologies.
B. Rise of Renewables
Solar and wind energy markets are rapidly expanding, creating new jobs, lower power costs, and large-scale investment opportunities. Battery storage and grid modernization are also experiencing accelerated growth.
C. Energy Price Volatility
Climate-related events, such as hurricanes shutting down offshore rigs or droughts reducing hydropower output, contribute to unpredictable energy supply and price instability.
The energy transition is reshaping geopolitics: countries with strong renewable potential—such as India, China, and Brazil—gain competitive advantages in green manufacturing and energy security.
5. Financial Markets: Risks, Returns, and Regulations
Climate change increasingly influences financial markets through three major channels:
1. Physical Risks
Damage from natural disasters affects stock valuations, bond risks, and insurance claims. Companies with assets in high-risk regions face declining valuations and higher operating costs.
2. Transition Risks
Sectors slow to shift to low-carbon models face regulatory penalties, higher carbon taxes, and stranded assets (e.g., coal plants, oil fields). Investors increasingly examine decarbonization strategies before allocating capital.
3. ESG and Sustainable Investing
Environmental, Social, and Governance (ESG) investing has grown into a multi-trillion-dollar market. Climate-focused funds, green bonds, carbon-neutral portfolios, and impact investing influence stock market performance. Companies with strong climate policies attract more investment and better credit ratings.
Central banks worldwide now require financial institutions to assess climate risks through stress tests, making climate resilience a core component of global financial stability.
6. Insurance and Risk Management
Climate disasters—wildfires, floods, hurricanes—are more frequent and severe, overwhelming insurance systems. Claims have skyrocketed in recent years, forcing insurers to:
Increase premiums
Limit coverage in high-risk areas
Adjust business models toward risk prevention
Invest in climate analytics and catastrophe modeling
Some regions could become "uninsurable," which directly affects real estate prices, investment decisions, and economic development.
7. Corporate Strategy, Innovation, and Green Technology
Corporations are transforming their business models to cope with climate change. Many industries are embracing innovation to reduce carbon footprints and capture new market opportunities.
Key innovation areas include:
Renewable energy technologies
Electric vehicles (EVs) and charging networks
Smart grids and energy-efficient buildings
Carbon capture, utilization, and storage (CCUS)
Sustainable agriculture and vertical farming
Climate analytics and AI-driven risk modelling
Water-saving technologies and desalination
Companies that adapt quickly gain competitive advantages in regulatory compliance, consumer trust, and long-term profitability.
8. Consumer Behavior and Market Demand
Climate change has shifted consumer preferences toward sustainable products and green lifestyles. Demand is increasing for:
Electric vehicles
Plant-based foods
Eco-friendly packaging
Energy-efficient appliances
Ethical brands with sustainability commitments
Younger consumers, in particular, prefer brands that align with climate responsibility. Businesses that fail to adapt face declining market share.
Conclusion
Climate change is no longer a distant threat—it is a present and powerful force reshaping the global market. It affects everything from GDP growth and supply chains to financial markets, energy systems, and consumer behavior. While the risks are enormous, including economic losses, resource scarcity, and market instability, the transition to a low-carbon economy presents unprecedented opportunities. Companies, investors, and nations that innovate and adapt quickly will lead the next era of sustainable global growth.
Selecting the Best Broker Platform1. Understanding the Purpose of a Broker Platform
A broker platform is a gateway that connects you to financial markets—stocks, derivatives, currencies, commodities, bonds, and more. Your broker allows you to buy and sell, provides market data, offers tools for analysis, and sometimes even educational material. A good platform should:
Be easy to use
Execute orders fast
Provide accurate data
Keep costs transparent
Offer strong security
Your decision depends largely on what type of trader or investor you are, which leads us to the next step.
2. Identify Your Trading or Investment Style
Not all brokers suit all styles. Before choosing, identify what you need:
a. Long-Term Investor
You prioritize low charges, SIP options, corporate action updates, and portfolio analytics.
b. Swing / Positional Trader
You require charting tools, indicators, margin facilities, and reliable order execution.
c. Intraday Trader
Speed of execution, low latency, minimal brokerage, and advanced charts matter the most.
d. F&O / Options Trader
You need margin calculators, real-time option chain, Greeks, strategy builder, and fast execution.
e. Commodity or Currency Trader
Your priority is extended market hours, reliable futures pricing, and risk tools.
Once you clarify your category, the evaluation becomes easier.
3. Key Factors to Evaluate Before Selecting a Broker
**1. Brokerage Charges & Hidden Fees
Cost is a crucial factor. Brokers may charge:
Intraday brokerage (flat per order or percentage)
Delivery charges (some offer zero)
Futures & options charges
Call & trade fees
Platform subscription charges
Demat maintenance charges
Look for transparency. Compare effective yearly cost, not just listed price.
**2. Trading Platform Quality (App + Desktop + Web)
A good trading platform must be:
Fast
Stable during market volatility
Easy to navigate
Capable of advanced charting
Able to execute orders in milliseconds
Check the following:
a. User Interface & Experience
Intuitive layout, simple order placement, personalization options.
b. Charting Features
Indicators
Drawing tools
Timeframes
Multi-chart view
Backtesting features
c. Compatibility
Available on Android, iOS, Windows/Mac, and browser.
d. Order Types
The broker should support:
Market/Limit/SL/SL-M
Bracket Orders (BO)
Cover Orders (CO)
GTT or GTD (good-till-triggered)
AMO (after-market orders)
**3. Regulation & Safety
In India or any global market, regulation is crucial. Ensure your broker is registered with a recognized authority such as:
SEBI (India)
FINRA (US)
FCA (UK)
ASIC (Australia)
Check their complaints history, audit reports, and trust score.
**4. Fund Transfer Convenience
A good broker should allow:
Instant deposits
Instant withdrawals
Multiple payment options
Bank linking without hassle
Delay in withdrawals is a red flag.
**5. Customer Support Quality
Trading is time-sensitive. Good brokers offer:
Fast chat support
Phone support during trading hours
Email resolution within 24 hours
Issue tracking system
You can test support by asking a few queries before opening an account.
**6. Research & Education Tools
For beginners, integrated learning resources help a lot. Look for:
Daily market updates
Earnings reports
Tutorials & courses
Stock analysis tools
Screeners (fundamental + technical)
**7. Margin & Leverage Policies
Check how much margin they offer for:
Intraday
Futures
Options selling
Currency
Commodities
Ensure margin rules align with your trading strategies.
**8. Additional Features
Depending on your needs, extra features may matter:
Algo trading support
API connectivity
Strategy builder
Backtesting platform
Portfolio tracking
Tax reports
SIP in stocks or ETFs
4. Compare Brokers Based on User Type
A. Best for Beginners
A beginner-friendly broker should offer:
Simple app interface
Low account opening charges
Educational videos
Zero or low delivery brokerage
Safe long-term investment options
B. Best for Intraday Traders
Look for:
Ultra-low brokerage
Fast execution
High uptime
Professional charts
Quick support
Execution speed matters more than cosmetics.
C. Best for F&O / Options Traders
Important features:
Option chain
Greeks
Strategy builder
Margin calculator
Low-cost per order
D. Best for Investors (Long-Term)
Look for:
Zero delivery charges
Good research reports
Portfolio insights
Corporate action updates
IPO access
5. Checklist Before Finalizing a Broker
Here is a simple checklist you can use:
Is the broker regulated and reputed?
Are charges transparent?
Is the platform easy to use?
Does it offer your required market segments (equity/F&O/MCX/forex)?
Does it have strong charting tools?
Are there hidden charges?
Is customer support efficient?
Are deposits and withdrawals fast?
Are reviews and user feedback positive?
Are features aligned with your trading style?
Ticking all the above ensures the broker is reliable.
6. Common Mistakes to Avoid When Choosing a Broker
1. Choosing only based on low brokerage
Cheap doesn’t always mean good. Stability and reliability matter more.
2. Ignoring platform speed
A slow platform can cause slippage and unexpected losses.
3. Overlooking customer support
In fast-moving markets, delayed help can cost you money.
4. Not checking hidden charges
DP charges, demat AMC, platform subscription fees matter in the long run.
5. Not testing the platform before funding
Open the account, explore the app, check charting, and only then deposit money.
7. How to Test a Broker Before Final Decision
Sign up for a free account (most brokers allow this).
Explore the app/web platform.
Use virtual money or paper trading if available.
Test charting tools and order placement speed.
Ask customer support queries.
Check delay in withdrawals with a small amount.
After this test run, you’ll know whether the broker suits you or not.
8. Final Thoughts – Choose What Matches You
There is no universally “best” broker. The best broker is the one that fits your trading style, financial goals, and experience level. If you are a beginner, prioritize ease and learning. If you are an active trader, focus on execution speed and low costs. If you are an options trader, tools like strategy builders and Greek calculators are essential.
Take your time to research, compare, and test before finalizing. A good broker can support your trading journey, while a wrong one can create obstacles. The right platform will help you trade confidently, grow consistently, and manage risk effectively.

Central Bank Impact on the Global Market1. Monetary Policy and Global Liquidity
The most direct way central banks impact the global economy is through monetary policy, which includes interest rate changes and balance sheet operations.
a. Interest Rate Decisions
When a major central bank changes its policy interest rate, it alters the global cost of capital. For example:
If the Federal Reserve raises interest rates, borrowing becomes expensive not only in the United States but across global markets that depend on dollar funding.
Higher rates cause international investors to pull money from emerging markets and invest in U.S. assets for better yields, leading to:
Capital outflows from emerging markets,
Currency depreciation in developing countries,
Rising borrowing costs globally.
Conversely, when central banks cut rates, global liquidity expands, and risk assets such as stocks and commodities usually rally.
b. Quantitative Easing (QE) and Balance Sheet Expansion
During crises, major central banks purchase government bonds, corporate bonds, or other assets to inject liquidity. This boosts global risk appetite because:
Investors search for higher returns,
Global asset prices rise,
Borrowing becomes cheaper worldwide.
For instance, QE by the Fed after the 2008 financial crisis and during the COVID-19 pandemic lowered global interest rates and caused a surge in liquidity across world markets.
2. Exchange Rate Movements and Currency Policy
Central banks significantly influence exchange rates, which directly affect global trade and capital flows.
a. Currency Appreciation/Depreciation
When a central bank tightens policy (raising rates), its currency usually strengthens. A strong currency has global implications:
It makes imports cheaper but exports more expensive,
It can create competitive pressures for trading partners,
It may cause global commodity prices (priced in that currency) to fluctuate.
For example, a strong U.S. dollar typically:
Pushes global commodity prices downward,
Makes emerging market debt harder to repay,
Reduces global trade volumes due to expensive financing.
On the other hand, loose monetary policy causes currency depreciation, supporting export competitiveness and global trade flows.
b. Currency Interventions
Some central banks actively intervene in currency markets. For example:
The Bank of Japan intervenes to curb excessive appreciation of the yen.
The People’s Bank of China regulates the yuan to maintain stability for its export-driven economy.
Such interventions influence global currency markets, cross-border investments, and international trade competitiveness.
3. Impact on Global Financial Markets
Central bank decisions directly affect global stock markets, bond markets, commodities, and derivatives.
a. Stock Markets
Lower interest rates generally boost global stock indexes by:
Reducing discount rates used in valuation,
Increasing corporate borrowing capacity,
Encouraging investment in risk assets.
Conversely, rate hikes lead to global stock market corrections, especially in sectors sensitive to financing such as technology, real estate, and banking.
b. Bond Markets
Central banks influence:
Government bond yields,
Corporate bond spreads,
Global fixed-income returns.
When central banks signal future rate hikes, global bond yields rise, causing bond prices to fall.
c. Commodity Markets
Since many commodities are priced in dollars, the Federal Reserve’s monetary policy strongly affects global commodity cycles. A stronger dollar generally leads to weaker demand for commodities like oil, gold, and metals.
4. Inflation Control and Global Price Stability
Inflation dynamics in one major economy can spill over into global markets due to interconnected supply chains and energy markets.
a. Inflation Targeting
Most central banks aim to keep inflation around a target (usually 2%). When inflation rises, central banks:
Tighten monetary policy,
Reduce liquidity,
Increase borrowing costs globally.
This can slow global trade and investment.
b. Import and Export Inflation
A country’s inflation can be influenced by foreign price levels. For example:
Rising global oil prices cause inflation in energy-importing countries.
High U.S. inflation increases import costs for other countries.
Central bank responses to inflation therefore have global implications.
5. Financial Stability and Crisis Management
Central banks act as lenders of last resort during financial crises, helping prevent global contagion.
a. Liquidity Backstops
During crises, central banks inject emergency liquidity to stabilize markets. For example:
The Fed provides dollar swap lines to global central banks to prevent shortages of dollar liquidity.
The ECB creates special financing programs during European debt crises.
This helps avoid widespread defaults and maintains confidence in global finance.
b. Regulation and Macroprudential Policy
Central banks oversee:
Bank capital requirements,
Stress testing,
Systemic risk monitoring.
Stronger regulations in major economies (like Basel III norms) influence global banking practices.
6. Influence Through Forward Guidance
Modern central banks use communication as a policy tool.
a. Market Expectations
Central bank speeches, press releases, and meeting minutes shape expectations around future policy. Global financial markets react instantly to:
Hawkish statements (more tightening),
Dovish statements (more easing).
For example, a single speech by the Federal Reserve Chair can move stock markets, bond yields, and currencies worldwide.
b. Transparency and Credibility
Consistent communication enhances global confidence and reduces volatility. Uncertain or contradictory statements can cause major market swings.
7. Coordination Between Central Banks
Sometimes central banks coordinate policy actions to stabilize the global market.
a. Joint Rate Cuts
During the 2008 crisis, multiple central banks cut rates simultaneously to restore confidence.
b. Swap Lines
Currency swap lines ensure smooth functioning of global payment systems.
c. Global Regulatory Standards
Central banks collaborate through bodies like the Bank for International Settlements (BIS) to maintain financial stability.
8. Impact on Emerging Markets
Emerging markets are often the most affected by major central bank decisions.
a. Capital Flows
Tighter policy in the U.S. causes:
Outflows from emerging markets,
Weakening currencies,
Rising inflation and borrowing costs.
b. External Debt Burden
Many emerging markets have dollar-denominated debt. A stronger dollar increases repayment burdens.
c. Trade Impact
Fluctuations in exchange rates influence export competitiveness and trade balances.
Conclusion
Central banks play a decisive role in shaping the global economic and financial environment. Through interest rate decisions, liquidity management, currency policy, and crisis interventions, they influence everything from global stock markets and capital flows to trade balances and inflation levels. In an interconnected world, the decisions of major central banks have far-reaching implications not just domestically but across the entire global market. As the global economy becomes more integrated, the influence of central banks will continue to grow, making their policies a key factor for investors, businesses, and governments worldwide.
CBDCs in the World Trading System1. What Are CBDCs?
A CBDC is a digital form of legal tender issued by a country’s central bank. It is:
Sovereign-backed
Regulated and stable
A digital liability of the central bank
Designed for domestic and international use
CBDCs generally come in two forms:
Retail CBDCs – used by the general public for everyday transactions.
Wholesale CBDCs – used by financial institutions for large-value payments and settlements.
In the context of world trade, wholesale CBDCs hold greater significance due to their ability to streamline international payments and reduce reliance on intermediary banking systems.
2. Current Problems in the World Trading and Payment System
Before understanding the value of CBDCs, it's important to consider the limitations of the existing trading and settlement framework:
a. High Cost of Cross-Border Payments
International transactions often involve multiple banks, SWIFT messaging, and correspondent banking networks. This leads to:
Expensive transfer fees
Slow processing times
Reliance on intermediaries
b. Dollar-Dominated Global Trade
Over 80% of global trade is invoiced in USD. This creates:
Dependency on US monetary policy
Currency risk for emerging markets
High demand for dollar liquidity
c. Slow Settlement Processes
Cross-border trade can take days to settle due to:
Time zone differences
Compliance checks
Lack of common settlement rails
d. Fragmented Financial Infrastructure
Different countries use incompatible regulations, payment systems, and messaging formats, making interoperability difficult.
CBDCs are considered a strategic solution to all these challenges.
3. How CBDCs Can Transform the World Trading System
CBDCs have the potential to reshape global trade in multiple ways.
a. Instant and Low-Cost Cross-Border Settlements
CBDCs can enable near-instant settlements by connecting central bank systems directly through digital ledger technology (DLT).
Benefits:
Reduced transaction fees
Faster trade finance processes
Lower counterparty and settlement risk
b. Reduced Dependence on Intermediaries
Traditional cross-border payments rely on correspondent banks. CBDCs, however, enable:
Direct central bank-to-central bank transactions
Fewer intermediaries
Reduced complexity in the payments chain
This leads to greater efficiency and transparency.
c. Enhanced Transparency and Anti-Fraud Controls
CBDCs allow full traceability. This is advantageous for global trade because:
Money laundering can be detected easily
Fraud and trade-based financial crimes reduce
Compliance becomes more automated
With programmable features, central banks can embed smart compliance rules into the currency itself.
d. Strengthening of Local Currencies in Trade
If CBDCs become interoperable, nations may settle trades in their own currency instead of relying on USD.
This will help countries:
Reduce dollar exposure
Stabilize local exchange rates
Enhance monetary sovereignty
China’s Digital Yuan (e-CNY) is already being tested for cross-border trade to promote Yuan internationalization.
e. Programmability in Trade Finance
CBDCs can support programmable smart contracts, enabling automated trade functions such as:
Conditional payments
Automated customs clearance
Real-time shipment tracking linked to payment triggers
Smart invoices and escrow systems
This reduces human error, delays, and contract disputes.
4. CBDCs and Global Trade Networks
a. Interoperability Projects
Many global initiatives aim to connect CBDCs across borders:
mBridge (Hong Kong, China, UAE, Thailand, BIS)
Project Dunbar (Australia, Malaysia, Singapore, South Africa)
Project Icebreaker (BIS, Sweden, Norway, Israel)
These projects test how CBDCs can settle international trade without SWIFT.
b. Digital Trade Corridors
CBDC-enabled digital trade corridors can make it easier for regions to conduct business without dependency on legacy systems. They also facilitate:
Bilateral and multilateral trade agreements
Currency swap arrangements
Real-time settlement layers
c. Impact on SWIFT and Correspondent Banking
CBDCs could reduce global reliance on SWIFT. Although SWIFT is adapting through digital integration, CBDCs bypass many of SWIFT’s limitations.
5. Challenges and Risks of CBDCs in World Trade
Despite their potential, CBDCs face significant challenges.
a. Lack of Global Standards
Without common frameworks for:
Cybersecurity
Privacy
Settlement rules
Regulatory alignment
interoperability will be limited.
b. Cybersecurity Concerns
CBDCs increase vulnerability to:
Cross-border cyber-attacks
Systemic risk if central bank networks fail
State-sponsored digital warfare
c. Geopolitical Competition
Countries may use CBDCs to:
Avoid sanctions
Reduce dependence on dominant currencies
Create regional trade blocs
This could reshape global power balances.
d. Privacy Concerns
Governments may monitor transactions too closely, raising:
Data security issues
User privacy concerns
Risks of misuse of financial information
e. Impact on Commercial Banks
If businesses prefer using CBDCs for trade:
Commercial banks may lose transaction revenue
Deposits could shift away from banks
Banks may face funding pressure
Central banks must balance innovation without destabilizing financial institutions.
6. Future of CBDCs in the World Trading System
CBDCs are still in their experimental stage, but global momentum is strong:
Over 130 countries are exploring CBDCs
Over 20 countries are in pilot or launch phases
Major economies like China, India, UAE, and the EU are leading adoption
CBDCs will likely become a core settlement infrastructure in global trade within the next decade.
Future expectations:
CBDC-based trade hubs in Asia and the Middle East
Digital currencies replacing letters of credit (LCs)
Automation of global supply chain finance
Programmable trade contracts integrated into logistics systems
Rise of multi-CBDC platforms creating a unified digital trade layer
Conclusion
CBDCs represent a revolutionary step in the evolution of the world trading system. By providing a faster, cheaper, and more transparent method of cross-border settlement, CBDCs have the power to significantly reduce inefficiencies in global trade. They also promote monetary sovereignty, reduce dependence on the US dollar, and enable programmable trade finance. Although challenges such as cybersecurity, privacy, and geopolitical tensions persist, the direction of global finance clearly indicates that CBDCs will play a major role in shaping the future of international commerce.
Global Economy Shifts1. Multipolarity and the Rebalancing of Global Power
For decades, the global economy operated under a largely unipolar structure led by the United States and its Western allies. Today, this dominance is fading as new economic blocs rise. Emerging markets—most notably China, India, Southeast Asia, the Middle East, and Africa—are becoming engines of global growth.
Rise of Asia
Asia now contributes more than half of global economic growth. China remains the world’s second-largest economy despite slowing growth, while India is emerging as the fastest-growing major economy, driven by demographics, domestic consumption, and digital infrastructure.
Shift Toward Regional Blocs
Increasing geopolitical tensions between the U.S. and China have accelerated the formation of economic blocs:
BRICS+ expansion has brought new resource-rich members.
Regional trade agreements such as RCEP and CPTPP are reshaping Asia-Pacific integration.
The European Union, despite internal challenges, is investing in strategic autonomy, green energy, and advanced manufacturing.
This move toward multipolarity is redefining investment flows, supply chains, and diplomatic alignments.
2. Technological Transformation and the Digital Economy
Technology is the most powerful force reshaping global economic structures. The accelerating adoption of AI, automation, robotics, and digital platforms is altering productivity, labor markets, and competitive advantages.
Artificial Intelligence as a Growth Catalyst
AI is transforming sectors such as finance, healthcare, logistics, and manufacturing. Countries that invest heavily in AI—like the U.S., China, and South Korea—are gaining competitive edges.
Digital Infrastructure Expansion
Digital connectivity has become the backbone of national competitiveness. Innovations such as:
5G and upcoming 6G networks
Cloud computing
Quantum technologies
Blockchain and digital payments
are enabling new business models. Digital public infrastructure (DPI), led by India’s UPI, Aadhaar, and ONDC, is becoming a blueprint for emerging markets.
Techno-Economic Fragmentation
However, technology is also driving global fragmentation:
Competing semiconductor supply chains
Restrictions on data flows
Tech-related sanctions
Global technology standards may split into competing spheres, creating challenges for multinational corporations.
3. Geopolitical Conflicts and De-Risking of Supply Chains
Conflicts such as the Russia–Ukraine war, Middle East instability, and U.S.–China tensions have triggered a significant rethinking of global supply chains.
From Globalization to “De-Risking”
Countries are not fully de-globalizing, but they are diversifying away from single-source dependencies. This has led to:
Nearshoring (e.g., U.S. companies shifting production to Mexico)
Friendshoring (production moving among geopolitical allies)
China+1 strategy (India, Vietnam, Indonesia as beneficiaries)
Resilience Over Efficiency
Companies are prioritizing:
Multi-location manufacturing
Strategic stockpiling
Strengthening logistics networks
Supply chains are becoming more regional and networked, reducing vulnerability to shocks.
4. Green Transition and the Economics of Climate Change
Climate change is reshaping policymaking and investment decisions. Governments and corporations are transitioning toward low-carbon economies, driving structural changes across energy, transportation, manufacturing, and agriculture.
Shift Toward Clean Energy
Renewables—solar, wind, hydro, hydrogen—are experiencing massive investment. Nations like China lead in solar manufacturing, Europe in wind technology, and the Middle East in green hydrogen.
Electric Vehicle (EV) Transformation
EV adoption is accelerating globally, forcing:
Auto companies to redesign supply chains
Battery manufacturers to secure critical mineral sources
Governments to provide subsidies and carbon regulations
Climate-Resilient Infrastructure
Rising temperatures and extreme weather events require substantial investment in resilient infrastructure, influencing fiscal priorities worldwide.
5. Demographic Changes and Labor Market Evolution
Demographics play a critical role in shaping economic potential.
Aging Economies
Developed nations—Japan, South Korea, much of Europe, and even China—face aging populations, shrinking workforces, and rising healthcare burdens. This leads to:
Lower long-term growth
Higher fiscal pressure
Increased need for automation and immigration
Youthful Economies
In contrast, India, Africa, and parts of Southeast Asia have young populations and rapidly urbanizing societies. These countries will be key drivers of global labor supply and consumer demand in coming decades.
Future of Work
Automation and AI will redefine jobs across sectors. While high-skilled workers benefit from rising productivity, low-skilled jobs face displacement. Upskilling, remote work, and gig economy platforms are altering labor structures.
6. Shifts in Global Trade, Currency, and Finance
Global trade patterns are being reshaped by:
Tariffs and trade barriers
Sanctions
New trade agreements
Carbon border taxes
Changing Currency Dynamics
While the U.S. dollar remains dominant, alternative currency arrangements are gaining traction:
BRICS countries exploring settlement in local currencies
Digital currencies and central bank digital currencies (CBDCs)
Bilateral trade agreements bypassing the dollar
Although the dollar’s dominance will not end soon, its relative share is gradually declining.
Capital Flow Reconfiguration
Investments are moving into:
Resilient supply chains
Green energy
Technology hubs
Emerging markets
Sovereign wealth funds, especially from the Middle East, are playing a major role in global capital allocation.
7. Consumer Behavior and Market Transformations
Consumers are shifting their preferences due to technological access, environmental awareness, and rising incomes.
Key trends include:
Increased digital consumption
Demand for sustainable products
Rapid growth of e-commerce and online services
Preference for personalized and subscription-based models
Emerging market middle classes—especially in India, Indonesia, and Africa—are becoming major contributors to global consumption growth.
Conclusion: A Transformative Decade Ahead
The global economy is transitioning through a period of deep structural change. Multipolarity, technological acceleration, shifting demographics, climate imperatives, and geopolitical tensions are transforming how nations trade, innovate, and grow.
The next decade will be defined by adaptability. Countries and companies that invest in technology, diversify supply chains, embrace sustainability, and harness human capital will emerge as winners. As economic power diffuses and the global order evolves, agility and resilience will shape the new world economy.

Emerging Market Impact in the Global Trade Market1. Transformation of Global Demand and Consumption
One of the most significant impacts of emerging markets on global trade comes from their expanding consumer bases. Rising incomes, rapid urbanization, and demographic advantages—particularly in economies like India, Indonesia, and Nigeria—have created massive new markets for global goods and services.
Growing Middle Class
The global middle class has more than doubled since 2000, primarily driven by Asia.
Emerging economies now account for over two-thirds of global consumption growth.
This increasing consumption translates into greater demand for automobiles, electronics, pharmaceuticals, luxury goods, food products, and technology services. For multinational corporations, emerging markets are no longer optional but essential destinations for expansion and long-term growth.
2. Shift in Global Production Centers
The global manufacturing landscape has undergone dramatic shifts, with emerging markets becoming the backbone of global production networks. China led the manufacturing revolution, but other economies—including Vietnam, Bangladesh, India, and Mexico—have followed suit.
Low-Cost Labor Advantage
Emerging markets often provide affordable labor and supportive tax policies, attracting foreign direct investment (FDI) from international firms seeking cost-efficient production hubs.
Rise of New Manufacturing Titans
Vietnam has become a global hub for electronics and textiles.
India is emerging strongly in electronics, pharmaceuticals, and automotive parts.
Mexico benefits significantly from nearshoring trends driven by U.S.-based companies.
This shift has diversified the global supply chain, reducing dependency on single sources and making international trade more resilient and adaptive.
3. Backbone of Global Commodity Trade
Emerging markets play a vital role in both the supply and demand sides of global commodities.
Demand-Side Influence
As developing economies industrialize, their need for:
crude oil
natural gas
steel
copper
agricultural commodities
increases dramatically. China alone has been a major driver of global commodity demand for the last two decades.
Supply-Side Contribution
Many emerging countries are rich in natural resources.
Examples include:
Brazil and Argentina in agriculture
South Africa and Chile in metals and minerals
Indonesia and Malaysia in palm oil
Gulf and African countries in energy resources
The pricing of many global commodities is now significantly influenced by the economic growth patterns of emerging markets.
4. Increasing Role in Global Trade Policies
Emerging markets are becoming more influential in international economic institutions such as the World Trade Organization (WTO), IMF, G20, and regional trade blocs.
Strategic Alliances and Trade Blocs
BRICS (Brazil, Russia, India, China, South Africa)
ASEAN (Association of Southeast Asian Nations)
MERCOSUR in South America
These groups advocate for more balanced trade policies and improved access to developed markets. Their collective bargaining power is reshaping global tariffs, trade agreements, and development frameworks.
5. Digital Transformation and Technology Services
Emerging markets are not just manufacturing hubs; many have become leaders in digital trade and technology services.
India’s IT Dominance
India has become the world’s IT outsourcing leader, supplying software services, cloud solutions, and consulting to major global corporations.
China’s Tech Ecosystem
China’s evolution into a global powerhouse in:
smartphones
e-commerce
artificial intelligence
robotics
has changed the competitive landscape.
Start-Up Ecosystems Rising
Several emerging economies now boast robust start-up ecosystems, including:
Indonesia
Brazil
Nigeria
Vietnam
Their growing digital markets contribute significantly to global e-commerce and fintech trade.
6. Changing Global Supply Chain Dynamics
The pandemic accelerated a realignment of supply chain strategies. Companies began diversifying production away from single-country dependence—a phenomenon known as China+1 strategy.
Winners of Supply Chain Diversification
Vietnam
India
Mexico
Thailand
Malaysia
As multinational firms diversify, emerging markets gain new investments, technology transfers, and increased participation in global trade networks. This shift enhances their economic resilience and strengthens their influence in global trade decisions.
7. Growing Investment Destinations
Emerging markets attract significant foreign direct investment (FDI) due to:
large workforces
improving ease of doing business
competitive production costs
rapid digitalization
Investments in sectors like manufacturing, infrastructure, renewable energy, and technology have fueled growth. In return, these economies are increasingly investing abroad, particularly through:
sovereign wealth funds
multinational corporations
development banks (e.g., China’s Belt & Road Initiative)
This two-way investment flow deepens global trade linkages and accelerates economic integration.
8. Challenges and Vulnerabilities
Despite their growth and influence, emerging markets face structural challenges that affect global trade.
Economic Volatility
These economies are more vulnerable to:
currency fluctuations
inflation cycles
commodity price swings
debt stress
Global economic slowdowns disproportionately impact emerging markets.
Infrastructure Gaps
Inadequate infrastructure in ports, logistics, power supply, and digital connectivity can limit trade efficiency.
Political and Policy Risks
Trade policies, regulatory changes, and geopolitical tensions can create uncertainty for investors and trading partners.
Yet despite these challenges, their overall trajectory continues upward.
9. Geopolitical Influence and Realignment
Emerging markets now play major roles in global geopolitics, influencing trade corridors, energy routes, and investment flows. China’s Belt and Road Initiative (BRI), India’s Act East Policy, and regional trade blocs show a growing desire for strategic autonomy.
These geopolitical realignments have reshaped:
maritime trade routes
infrastructure development
cross-border connectivity
As emerging markets grow stronger, their geopolitical strategies directly impact global trade patterns.
10. Future Outlook: The Next Phase of Global Trade
In the coming decade, emerging markets are expected to contribute nearly 60–65% of global GDP growth. Their rise will further influence:
Key Trends
Expansion of digital trade and fintech
Green energy transitions leading new commodity markets
Growing influence in global governance institutions
Greater regional trade integration
Increased innovation and technological adoption
Emerging markets are not just participants—they are becoming architects of the future global trade system.
Conclusion
Emerging markets have fundamentally reshaped the global trade landscape. From driving consumption growth and diversifying production hubs to influencing commodity markets and trade policies, these economies are now critical pillars of global economic architecture. While challenges remain, their increasing economic integration, expanding middle class, rapid digitalization, and strategic geopolitical influence position them as the key engines of global trade in the decades ahead.
BRICS Thriving in the Global Market1. Economic Powerhouse: The Growing Weight of BRICS
BRICS nations collectively account for:
~45% of the world’s population
~36% of global GDP (PPP terms)
Over 30% of global energy supply
More than 25% of global exports
This economic heft gives the bloc a powerful edge in global markets. China and India alone are among the world’s top three economies (PPP), contributing significantly to global consumption and manufacturing.
Diverse Economic Strengths
Each BRICS nation contributes uniquely:
China remains the world’s manufacturing hub.
India is a technology and services powerhouse.
Brazil dominates agricultural exports—soybeans, beef, sugar.
Russia is a global leader in oil, gas, and defence.
South Africa is rich in minerals and precious metals.
Saudi Arabia & UAE bring capital and strategic energy influence.
Iran adds geopolitical depth and massive energy reserves.
Egypt & Ethiopia boost African connectivity and demographic momentum.
This diversity allows BRICS to remain resilient amid global disruptions, creating a balanced ecosystem that strengthens intra-bloc cooperation.
2. Trade Expansion: Intra-BRICS and Global Influence
BRICS countries are rapidly expanding trade ties among themselves to reduce dependence on Western markets. China’s trade with BRICS partners has surged, while India has significantly increased exports to Brazil, Russia, and Middle Eastern BRICS members.
Key Factors Driving BRICS Trade Growth
a) Complementary Economies
China and India require energy → Russia, Saudi Arabia, Iran supply it.
Brazil’s agricultural exports feed Asia.
Africa’s mineral wealth fuels global industrial supply chains.
This interdependence strengthens BRICS’ internal trade network.
b) Reduced Trade Barriers
Countries are increasingly settling trade in local currencies rather than the U.S. dollar, reducing currency volatility and sanctions exposure.
c) Shift in Global Supply Chains
The “China+1” and “China+2” strategies have allowed India, Brazil, and others to attract manufacturing investments as global firms diversify.
3. Financial Resilience: BRICS Challenging the Western Banking System
One of the strongest signs of BRICS thriving in the global market is the growing independence from Western-dominated financial structures.
The New Development Bank (NDB)
Founded in 2014, the NDB finances infrastructure and sustainable projects across member countries. It has approved billions in funding and aims to rival institutions like the World Bank.
Local Currency Settlements
Countries like India, Russia, and China are increasingly settling trade in:
Indian Rupee (INR)
Chinese Yuan (CNY)
Russian Ruble (RUB)
This reduces dollar dependency and creates a more stable financial ecosystem.
Rise of Yuan in Global Trade
With China’s vast trade network, the Yuan has become a preferred settlement currency in Asia, Middle East, and parts of Africa—indicating the financial reach of BRICS nations.
4. Energy Dominance: A Core Strength of BRICS
Energy-rich BRICS members—Russia, Saudi Arabia, Iran, Brazil—have reshaped global oil and gas markets.
Why Energy Gives BRICS Global Power
They control over 40% of the world’s oil production.
They significantly influence OPEC+ decisions.
Asian demand for energy gives the bloc leverage.
Energy trade in local currencies challenges petrodollar dominance.
This energy ecosystem further strengthens BRICS economic integration.
5. Technological and Digital Growth: The New Engine of BRICS
Technology and digital infrastructure are crucial for modern economic dominance. BRICS nations, especially China and India, are leading in several key areas:
a) Digital Payments
India’s UPI has become a global model.
Brazil’s PIX and China’s WeChat Pay dominate domestic markets.
b) Artificial Intelligence & Semiconductors
China is a global AI leader; India is emerging as a major chip-design hub.
c) Space Technology
India, China, and Brazil have advanced space programs that boost telecom, navigation, and climate research.
d) 5G and Future Tech
China’s Huawei leads global telecom infrastructure development, especially in Africa and Asia.
BRICS nations are not just consumers of technology—they are innovators and exporters, enhancing their global market competitiveness.
6. Geopolitical Influence: BRICS as a Multipolar Power Center
The growth of BRICS is inherently tied to the global shift away from unipolarity. With the West and emerging economies diverging in priorities, BRICS offers an alternative global governance model.
Geopolitical Strengths of BRICS
Represents major regional powers across Asia, Africa, Middle East, South America.
Coordinates policies on global issues like climate, development, and trade.
Provides a counterweight to NATO, G7, and Western-led financial institutions.
The expansion of BRICS signals its rising diplomatic and strategic relevance.
7. Global South Leadership: BRICS as a Voice for Developing Nations
A major reason BRICS is thriving is its role as the champion of the Global South.
Key roles include:
Promoting fairer global trade rules.
Improving access to development finance.
Supporting infrastructure development across Africa & Asia.
Challenging Western dominance in global decision-making.
As inequality between developed and developing countries rises, BRICS becomes a preferred platform for emerging economies.
8. Future Outlook: Can BRICS Redefine Global Markets?
The momentum behind BRICS is strong, but the future will depend on:
Deepening financial integration.
Improving trade logistics.
Balancing China–India competition.
Leveraging energy dominance responsibly.
Expanding technological cooperation.
If successful, BRICS could become the largest economic bloc in the world by 2035, shaping global trade, currencies, and geopolitics.
Conclusion
BRICS is thriving in the global market due to its massive population, resource wealth, rapid digital growth, rising financial independence, and strategic geopolitical influence. As the world transitions toward a multipolar era, BRICS nations are not only shaping global trade but also redefining the economic and political architecture of the 21st century. With expanding membership, growing economic interdependence, and increasing relevance in global governance, BRICS is poised to become one of the most powerful alliances in the decades ahead.

Understanding Forex Money Flow: Risk-on & Risk-offWhen it comes to Forex, most traders focus on technicals, chart patterns, or indicators. But “money flow” — the force that truly moves price — is often overlooked. If you want to read the market like a pro, you must understand Risk-on and Risk-off: the two sentiment states that drive global capital.
Today, let’s break them down clearly, practically, and in a way you can apply immediately.
🔥 What Is Risk-on?
“Risk-on” appears when the market is optimistic, investors seek risk, and money flows strongly into high-return assets.
Signals of a Risk-on Environment:
Strong stock market rallies
Capital shifts into riskier assets
Bond yields rise
Positive economic news or geopolitical easing
Assets That Benefit in Forex:
AUD, NZD, CAD (commodity currencies)
GBP, EUR (when the economy is stable)
Bitcoin, oil, and equities also tend to rise
Risk-on = “The market is excited → money flows into high-yield assets”.
💥 What Is Risk-off?
“Risk-off” occurs when the market fears uncertainty, causing money to move toward safe-haven assets.
Signals of a Risk-off Environment:
Stock markets fall sharply
Money exits risky assets
Gold spikes
USD and JPY strengthen
Negative economic news, war, inflation, or political instability
Assets That Benefit in Forex:
USD, JPY, CHF
Gold (XAUUSD)
U.S. government bonds
Risk-off = “The market is scared → money runs to safety”.
❓ Why Forex Traders MUST Understand Risk-on / Risk-off
No matter what indicator you use, the market ultimately reacts to major capital flow.
Understanding these two states helps you:
Trade with market sentiment → dramatically increases win rate
Avoid entering trades against the money flow → fewer “pointless stop-loss hits”
Identify strong/weak currencies → choose high-probability setups
Many perfect technical setups fail simply because they go against global money flow.
📌 How to Apply This Immediately in Your Forex Trading
1. Check the News → Identify Sentiment
Good news? Strong GDP? Stable markets? → Risk-on
Bad news? War? Inflation? Hawkish Fed? → Risk-off
2. Compare Currency Strength
Simple formula:
Risk-on → prioritize BUY AUD, NZD, CAD
Risk-off → prioritize BUY USD, JPY, CHF
3. Follow the Trend — Avoid Fighting Money Flow
The strongest trends often come from shifts between Risk-on and Risk-off.
Examples:
Bad news → JPY strengthens → XXXJPY pairs fall hard
Risk-on returns → USD weakens → gold rises quickly
Follow the money flow, and you’re already ahead of 80% of traders.
🧠 Conclusion – If You Want to Trade Smart, Trade With the Money Flow
Risk-on and Risk-off aren’t just theory — they’re the compass that reveals market psychology, which is the foundation of every trend.
Want to trade like Smart Money?
→ Watch where the money is moving, not just where the candles are going.

Smart Money Liquidity Trap Explained⭐ Smart Money Liquidity Trap Explained
✨ A deep dive into how institutions manipulate price before major moves ✨
In every financial market — Forex, Crypto, Stocks, Indices — price doesn’t simply move at random. Behind the scenes, Smart Money (institutions, banks, hedge funds) engineer setups that allow them to enter positions at the best possible price. One of their most effective tools is the Liquidity Trap.
Let’s break it down beautifully and clearly. 👇
🔥 What Is a Liquidity Trap?
A Liquidity Trap occurs when Smart Money deliberately pushes price into areas loaded with:
❌ Stop-loss orders
📉 Sell-side liquidity
📈 Buy-side liquidity
😰 Emotional retail entries
🔥 Breakout traders placing pending orders
These areas become liquidity pools — perfect fuel for institutions to fill their massive positions.
Retail traders think it’s a breakout…
But Smart Money thinks:
➡️ "Thank you for the liquidity."
🧩 How Smart Money Creates the Trap
1️⃣ Phase 1: Build the Setup
Smart Money guides price slowly toward an obvious level:
A clean high
A clean low
A trendline
A double top/bottom
Retail traders get excited:
📢 “Breakout coming!”
But institutions are simply gathering attention.
2️⃣ Phase 2: The Liquidity Grab ⚡
Price spikes violently above/below the obvious level.
This move triggers:
🟥 Stop-loss hunts
📉 Forced liquidations
💥 Breakouts that fail instantly
This sudden spike gives institutions the liquidity needed to place large buy or sell orders without causing massive slippage.
This is why the spike is often fast and dramatic.
3️⃣ Phase 3: The Real Move Begins 🚀
After the liquidity is collected, price reverses sharply.
This is the moment Smart Money actually commits to the real direction.
Retail traders feel:
🤯 “Why did it reverse?!”
😭 “I got stopped out for nothing!”
😵 “The breakout was fake!”
But Smart Money simply executed their strategy perfectly.
🎯 How to Use Liquidity Traps in Your Trading
Study where retail traders commonly place:
⛔ Stops
📌 Breakout orders
❗ Predictable entries
Then wait for the fast liquidity grab followed by:
A displacement 🎇
A sharp wick rejection
A structure shift (CHoCH / BOS)
These signals often reveal the true direction of the upcoming move.
💡 Key Features of a Smart Money Liquidity Trap
✨ Sudden spike into obvious areas
✨ Fast liquidation and stop-hunting behavior
✨ Sharp wick rejections
✨ Structure shift after the spike
✨ Smooth continuation in the real direction
🚀 Why This Concept Is So Powerful
Recognizing liquidity traps allows you to:
❌ Avoid fake breakouts
🛡️ Protect yourself from stop-hunts
🎯 Enter the market at premium/discount levels
🤝 Align with Smart Money
💼 Improve long-term consistency
This is how professional traders stay on the right side of volatility — by understanding why the market moves, not just where it moves.
Why Markets Struggle After a Big Drop (NASDAQ Case Study)Understanding liquidity, distribution phases and market-maker behavior
After the NASDAQ fell sharply from 25 000 to 24 000, many traders were surprised why the market suddenly stopped moving and started to “chop” around the same area.
But this behavior is not random — it’s a structural problem inside the order-flow.
1️⃣ Markets can fall fast — but they cannot continue without liquidity
Every trade in the market has a counter-party.
If traders want to buy the dip, someone must sell to them.
After a large drop, fewer participants are willing to sell at the new low prices.
Institutions are often already hedged or already sold during the fall.
Market makers cannot force liquidity out of thin air — they must create it.
This leads to a distribution phase, where price stops trending and starts rotating around a key area.
2️⃣ Why distribution forms around the Point of Control (POC)
When aggressive hedging is finished and volatility slows down, the market enters a phase where:
Price rotates around the Point of Control (POC)
Volume increases
Market makers attempt to rebuild liquidity on both sides of the range
This is not accumulation or re-accumulation — it is a liquidity-engineering phase.
Market makers need enough:
Buy-side liquidity above POC (stop losses of shorts, breakout traders, trapped buyers)
Sell-side liquidity below POC (stop losses of longs, late dip-buyers, liquidation clusters)
Without these pools, the market cannot initiate the next impulsive move.
3️⃣ The problem with sell-side liquidity after a big fall
When NAS dropped from 25k → 24k:
Most weak longs were already liquidated
Many sellers closed positions or took profit
Fresh shorts hesitate to enter at the lows
Institutions are waiting for better prices
This creates a liquidity vacuum.
To solve this vacuum, the market “mirrors” trades inside the range:
Price moves up → build stops above
Price moves down → build stops below
Repeated sweeps → fill both sides of liquidity
Only after enough stop-loss clusters form, the market is capable of moving again with real momentum.
4️⃣ What this means for traders
This is not a buy or sell signal.
It’s an explanation of why the market becomes extremely slow, sideways or manipulative after a big impulsive move.
In this phase:
Breakouts usually fail
Trend trading performs poorly
Range traps occur frequently
Market reacts strongly to liquidity pockets, not fundamentals
The key is to understand what the market is missing:
➡️ Not direction.
➡️ Not fundamentals.
➡️ But liquidity.
Until the liquidity pools are recreated, the next real directional move cannot start.
5️⃣ Final takeaway
A strong decline does not end because “buyers step in.”
It ends because no more sellers exist at those levels, forcing market makers to rotate price and rebuild the order-book.
Learning to identify these liquidity-reset periods helps traders avoid:
Chasing breakouts
Entering too early
Getting trapped during fake momentum
Misreading sideways distribution as a reversal
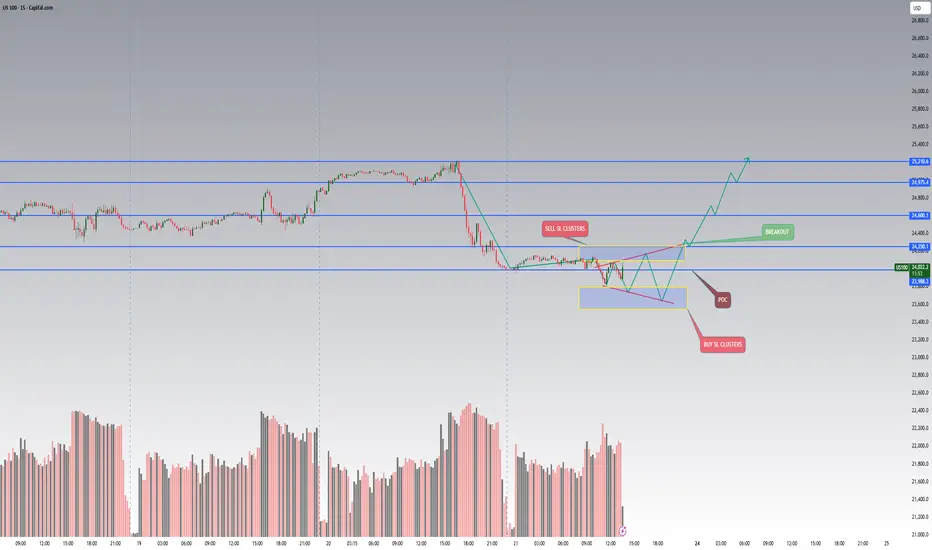
Inverse Head & Shoulders on USDJPY (Quarterly Chart)Japanese yen is pretty technical on the charts
Its very good for education
This time I spotted for you a textbook
Giant Inverse Head & Shoulders reversal bullish pattern
It was built at the bottom of the move with three consecutive troughs
with the deepest in the middle called the Head and the side parts called the Shoulders
The dotted trendline connecting the peaks of the inverted Head is the Neckline
The latter is a key barrier for the bullish trigger
Price broke above it in 2022 and quickly pushed beyond the 151 level
Then a classic textbook pullback unfolded to accurately retest the broken Neckline
After that price resumed its uptrend to test the crucial resistance at 160.40
built from the peak of distant 1990!
It was a die hard barrier as price was rejected and fell back into the 140 area
And now again we are heading to retest that solid barrier
Back to the pattern
The target for the Inverse Head & Shoulders is set at the depth of the Head
Neckline minus Heads bottom added to the Neckline
It is located at 174 a potential gain of a whopping 11 percent
Price should stay above the Neckline beyond 127 before reaching the target
otherwise the pattern becomes invalidated
And if we zoom in you can see a wide empty space without strong barriers
until price hits the next major resistance at 277.79 the peak of the 80s
That means JPY could lose almost 73 percent of its value to USD
