How Currency Valuations Impact Exporters and ImportersIntroduction
Currency valuation is one of the most powerful forces shaping global trade dynamics. Every day, trillions of dollars’ worth of goods, services, and investments cross borders, and the exchange rates between currencies determine how much value each participant gains or loses. A small shift in the rupee, dollar, euro, or yen can have a massive impact on exporters’ earnings, importers’ costs, and even a country’s overall trade balance.
For exporters and importers, understanding currency valuation is not just a financial technicality — it is a survival strategy. Whether a company sells machinery to Europe, imports raw materials from China, or outsources services to the U.S., fluctuations in exchange rates directly affect profitability, competitiveness, and strategic planning.
This essay explores how currency valuations influence exporters and importers, the mechanisms behind exchange rate movements, their implications on pricing, profitability, and policy decisions, and how businesses can manage the risks associated with currency fluctuations.
Understanding Currency Valuation
Currency valuation refers to the market-determined worth of one currency relative to another. It is usually expressed as an exchange rate — for example, ₹83 per U.S. dollar means that one dollar can be exchanged for 83 Indian rupees.
Exchange rates fluctuate due to a combination of factors such as:
Inflation differentials
Interest rate variations
Trade balances
Foreign investment flows
Central bank policies
Market speculation
When a currency appreciates, its value rises compared to others, meaning it can buy more foreign currency. When it depreciates, it loses value, meaning more domestic currency is needed to buy the same amount of foreign currency.
These movements, while often subtle on a daily basis, can have profound effects on international trade.
Impact on Exporters
Exporters earn revenue in foreign currencies but often bear costs in their home currency. Therefore, currency depreciation usually benefits exporters, while currency appreciation tends to hurt them. Let’s explore both situations.
1. Currency Depreciation: A Competitive Advantage
When a country’s currency depreciates, its goods and services become cheaper in foreign markets. For example, if the Indian rupee weakens from ₹75 to ₹85 per U.S. dollar, an American buyer can now buy more Indian products for the same amount of dollars.
This creates several benefits for exporters:
Price Competitiveness: Products appear cheaper abroad, boosting demand.
Higher Profits: Exporters earn more in domestic currency when converting foreign sales revenue.
Market Expansion: Depreciation can help penetrate new markets or outcompete suppliers from stronger-currency nations.
For instance, India’s textile and IT service exporters often benefit when the rupee weakens against the dollar. Their revenues in dollars translate into higher rupee earnings, improving margins even if prices remain constant.
2. Currency Appreciation: A Profit Squeeze
When a domestic currency strengthens, exporters face a dual challenge:
Their products become more expensive for foreign buyers, reducing competitiveness.
Their foreign revenues shrink in domestic terms.
For example, if the rupee appreciates from ₹85 to ₹75 per dollar, the same $1 million export sale now converts into ₹75 million instead of ₹85 million — a clear loss in rupee terms.
Unless exporters hedge their exposure or increase prices (which may hurt demand), their profit margins shrink significantly.
Industries that rely heavily on exports — such as automobiles, textiles, or pharmaceuticals — are particularly sensitive to such changes.
3. Long-Term Effects on Export Strategy
Persistent currency appreciation can force exporters to rethink their strategy:
Shift production abroad to reduce currency exposure.
Focus on higher value-added goods where price sensitivity is lower.
Increase use of financial hedging instruments.
On the other hand, a consistently weak currency can encourage export-led growth but might raise inflation due to costlier imports (like energy or components).
Impact on Importers
Importers face the opposite situation. They pay for foreign goods and services in foreign currencies but sell them domestically in their local currency. Hence, currency appreciation generally benefits importers, while currency depreciation hurts them.
1. Currency Appreciation: Lower Import Costs
When the domestic currency strengthens, importers gain purchasing power. They can buy more goods from abroad for the same amount of domestic currency.
For example, if the rupee appreciates from ₹83 to ₹78 per dollar, a $10,000 machine from the U.S. costs ₹7.8 lakh instead of ₹8.3 lakh.
The benefits include:
Reduced Import Costs: Lower costs for raw materials, equipment, or finished goods.
Lower Inflation: Cheaper imports can reduce overall price pressures in the domestic economy.
Improved Margins: Importers or retailers can either lower their selling prices or increase profit margins.
Industries such as electronics, oil, and automobiles — which rely heavily on imports — often welcome currency appreciation.
2. Currency Depreciation: Costly Imports
Depreciation has the opposite effect. The domestic currency buys fewer foreign goods, increasing import costs.
For example, if the rupee depreciates from ₹83 to ₹88 per dollar, that same $10,000 machine now costs ₹8.8 lakh.
This can lead to:
Higher Input Costs: Import-dependent manufacturers face rising costs of raw materials or components.
Inflationary Pressure: Costlier imports can push up consumer prices, especially for fuel or food.
Profit Margin Squeeze: Importers may struggle to pass higher costs to consumers, hurting profitability.
A prolonged depreciation phase can thus make it difficult for import-driven sectors like energy, technology, and healthcare to maintain stable pricing structures.
Exchange Rate Pass-Through: Linking Valuation to Pricing
The concept of exchange rate pass-through (ERPT) explains how much of the currency movement is reflected in the final price of goods.
Full Pass-Through: Exporters/importers adjust prices completely in line with exchange rate changes.
Partial Pass-Through: Companies absorb part of the exchange rate impact to remain competitive.
For example, if the rupee weakens 10% but an exporter only raises prices abroad by 5%, the remaining 5% is absorbed in margins.
The degree of pass-through depends on market conditions, demand elasticity, and brand power. Highly competitive markets (like garments) show low pass-through, while niche products or monopolistic services show higher pass-through.
Case Examples
1. Indian IT and Pharmaceutical Exporters
When the rupee depreciates, these sectors thrive because they earn in dollars but spend in rupees. During 2020–2023, rupee weakness benefited companies like Infosys, TCS, and Sun Pharma, improving operating margins despite global volatility.
2. Oil and Gold Importers
India imports most of its crude oil and gold. When the rupee weakens, import bills rise sharply, widening the current account deficit and creating inflationary pressure. This shows how currency valuation directly influences macroeconomic stability.
3. Japanese Yen and Export Competitiveness
Japan has long relied on a weak yen to maintain export competitiveness in automobiles and electronics. When the yen strengthens sharply, companies like Toyota or Sony face reduced foreign earnings, prompting shifts in production to other regions.
Macroeconomic Implications
1. Trade Balance Effects
Currency depreciation tends to boost exports and reduce imports, improving the trade balance. Conversely, appreciation may widen trade deficits.
However, the J-Curve effect suggests that after depreciation, the trade deficit may initially worsen (as import bills rise before export volumes adjust) before eventually improving.
2. Inflation and Interest Rates
A weaker currency can stoke inflation through higher import costs, prompting central banks to raise interest rates. A stronger currency can have a disinflationary effect, allowing for looser monetary policy.
Hence, exporters and importers must watch not just exchange rates but also central bank reactions.
3. Investment Flows
Stable currency values attract foreign investment, while volatile or overvalued currencies deter it. Export-oriented economies like China and South Korea often manage currency levels strategically to maintain competitiveness.
Risk Management and Hedging Strategies
Given the volatility in currency markets, exporters and importers use various tools to manage risk:
Forward Contracts: Lock in future exchange rates to avoid uncertainty.
Options and Futures: Provide flexibility to benefit from favorable moves while limiting losses.
Natural Hedging: Matching foreign currency revenues and expenses (e.g., using dollar earnings to pay dollar liabilities).
Diversification: Expanding trade across multiple markets to reduce dependency on one currency.
A disciplined hedging strategy protects profit margins and ensures financial stability despite volatile exchange rates.
Policy and Central Bank Interventions
Governments and central banks often intervene in foreign exchange markets to prevent excessive currency swings.
Managed Float Systems: Authorities allow market forces to determine exchange rates but step in during volatility.
Reserve Management: Buying or selling foreign reserves to influence currency supply.
Export Incentives and Import Duties: Used to balance the impact of currency movements on trade sectors.
For example, the Reserve Bank of India (RBI) actively manages rupee liquidity to avoid sharp fluctuations that could harm exporters or spike import costs.
The Balance Between Exporters and Importers
While a weaker currency aids exporters, it hurts importers and raises inflation. Conversely, a stronger currency benefits importers and consumers but reduces export competitiveness.
Thus, an optimal exchange rate — not too strong, not too weak — is crucial. The goal for policymakers is to maintain stability rather than favor one side.
In the long run, productivity, innovation, and diversification are more sustainable sources of competitiveness than currency manipulation.
Conclusion
Currency valuation stands at the crossroads of global trade, linking the fortunes of exporters, importers, investors, and entire economies. A fluctuating exchange rate is more than a number on a financial screen — it is a reflection of economic strength, investor confidence, and trade competitiveness.
For exporters, a weaker domestic currency can mean opportunity; for importers, it can mean challenge — and vice versa. But those who understand the mechanics of currency valuation, hedge their risks, and adapt strategically can turn volatility into advantage.
In a globalized era, exchange rate literacy is as essential as market knowledge. Whether you’re shipping goods overseas or sourcing materials from abroad, managing currency exposure is not merely financial prudence — it’s the foundation of resilient international business.
Chart Patterns

Understanding Global Market SensitivitiesIntroduction
In an increasingly interconnected world, the global financial system behaves like a finely tuned orchestra—each instrument (country, industry, currency, or commodity) affects the harmony of the whole. When one note goes off-key, the impact resonates far beyond borders. These reactions, known as global market sensitivities, refer to how markets respond to changes in economic indicators, geopolitical tensions, interest rates, and investor sentiment.
Understanding these sensitivities is essential for investors, traders, and policymakers because even a minor shock in one part of the world can ripple across continents. Whether it’s a central bank rate decision in the U.S., a natural disaster in Asia, or an oil supply disruption in the Middle East, the effects are quickly transmitted through the arteries of global trade and finance.
1. What Are Global Market Sensitivities?
Global market sensitivities describe how financial markets react to internal and external stimuli—events or decisions that influence economic expectations, trade flows, and capital movement.
In simple terms, they are the emotional and structural responses of global markets to changing realities. These sensitivities are not random; they are shaped by a complex network of factors such as interest rates, inflation, political stability, supply-chain disruptions, and investor psychology.
For instance:
A spike in U.S. inflation may lead to fears of tighter monetary policy, strengthening the dollar but weakening emerging market currencies.
A conflict in the Middle East might cause oil prices to surge, impacting transportation, manufacturing costs, and inflation worldwide.
Thus, global market sensitivities are a mirror reflecting the pulse of the world economy.
2. The Role of Economic Indicators
Economic data releases are among the strongest triggers of global market movements. The most influential indicators include:
Gross Domestic Product (GDP) — Reflects a nation’s economic health. A strong GDP growth rate signals expansion, attracting investment and strengthening currency.
Consumer Price Index (CPI) — Measures inflation. Rising CPI data can pressure central banks to raise interest rates, which impacts global equity and bond markets.
Unemployment Rate — Indicates labor market strength. Lower unemployment often signals robust consumer spending, while rising unemployment hints at a slowdown.
Purchasing Managers’ Index (PMI) — Reveals the pace of industrial and service activity, providing an early indication of economic direction.
Each of these indicators can cause significant short-term volatility and long-term adjustments in asset allocation. For example, a surprising jump in U.S. inflation data might trigger a global equity sell-off as investors anticipate aggressive rate hikes.
3. The Sensitivity to Monetary Policy
Central banks, particularly the U.S. Federal Reserve, the European Central Bank (ECB), and the Bank of Japan (BoJ), play a pivotal role in global market reactions. Their decisions on interest rates, liquidity, and quantitative easing ripple across the financial world.
When central banks tighten monetary policy:
Bond yields rise.
Stock valuations often fall.
The domestic currency strengthens.
Emerging markets see capital outflows.
Conversely, when they loosen policy through rate cuts or asset purchases, risk assets like equities and commodities usually rally.
The 2020–2021 pandemic period is a perfect example. Central banks worldwide slashed interest rates and flooded economies with liquidity, triggering a global bull run in equities, real estate, and even cryptocurrencies. But when inflation surged in 2022, the reversal of these policies caused sharp corrections.
4. Geopolitical Events and Market Sensitivity
Geopolitical events—wars, trade conflicts, sanctions, and elections—often spark sudden and unpredictable market movements.
Trade Wars: The 2018 U.S.-China trade tensions disrupted global supply chains, increased tariffs, and caused stock market volatility worldwide.
Wars and Conflicts: The Russia-Ukraine war led to energy price spikes, global inflation, and shifts in commodity trade routes.
Elections and Policy Changes: The uncertainty surrounding major elections (like the U.S. Presidential race) often results in cautious trading and market rebalancing.
Markets dislike uncertainty. When geopolitics introduce unpredictability, investors typically move capital to “safe-haven assets” such as gold, the U.S. dollar, or U.S. Treasury bonds. These shifts highlight how sensitive global capital is to changes in stability and governance.
5. Currency Market Sensitivities
The foreign exchange (forex) market is perhaps the most sensitive of all. Currency movements respond instantly to changes in macroeconomic expectations, trade balances, and interest rate differentials.
For example:
If the U.S. Federal Reserve hikes rates while the European Central Bank holds steady, the USD tends to appreciate against the EUR.
Conversely, if China reports stronger-than-expected manufacturing growth, Asian currencies might gain due to improved trade sentiment.
Currency sensitivity also impacts export-import competitiveness. A stronger domestic currency makes exports expensive but reduces import costs—shaping the trade balance and corporate profitability.
6. Commodity Market Sensitivities
Commodities like oil, gold, copper, and wheat are highly sensitive to global demand, supply shocks, and geopolitical risk.
Oil prices often surge during geopolitical crises or supply disruptions (e.g., OPEC decisions, wars in oil-producing regions).
Gold, considered a safe-haven asset, rallies during times of uncertainty, inflation, or currency depreciation.
Industrial metals like copper and aluminum respond to global manufacturing data and infrastructure spending.
For investors and policymakers, understanding these sensitivities helps in forecasting inflation trends and industrial performance, since commodity costs directly affect production and consumer prices.
7. Interconnected Financial Systems
Today’s global markets are deeply interconnected through cross-border investments, supply chains, and digital financial systems.
A single event in one market can rapidly influence others:
A drop in Chinese manufacturing output can lower global metal prices.
A surge in U.S. bond yields can draw funds away from emerging markets.
European energy crises can trigger global shifts toward alternative energy investments.
This interdependence is both a strength and a weakness—it enhances global growth but also increases vulnerability to contagion effects. The 2008 financial crisis and 2020 pandemic shock illustrated how tightly woven these systems have become.
8. The Role of Technology and High-Frequency Trading
Modern markets are far more sensitive than those of the past due to algorithmic trading, AI-driven models, and instant information flow.
High-frequency trading systems can react to economic news within milliseconds, amplifying volatility. Social media and online news platforms also shape sentiment faster than traditional media. A single tweet from a political leader or a corporate executive can move billions in market capitalization.
This technological sensitivity adds a new dimension to global financial behavior—markets now respond not only to fundamentals but also to the speed of perception and reaction.
9. Emerging Markets and Capital Flow Sensitivity
Emerging economies such as India, Brazil, and Indonesia are especially vulnerable to shifts in global investor sentiment.
When global liquidity is high and risk appetite strong, these markets attract capital inflows seeking higher returns. However, when global rates rise or crises occur, these funds often exit rapidly, causing currency depreciation and stock market declines—a phenomenon known as “hot money” reversal.
For example, during the Fed’s 2013 “Taper Tantrum,” several emerging markets faced currency crises as investors pulled funds back to U.S. assets. This highlights the importance of global monetary sensitivity for developing economies.
10. Investor Sentiment and Behavioral Sensitivity
Markets are not purely rational—they are deeply psychological. Fear, greed, and herd mentality drive short-term market movements more than data.
Fear leads to sell-offs during crises.
Greed fuels rallies and bubbles during optimism.
Herd behavior causes investors to follow trends even when fundamentals don’t support them.
This emotional sensitivity explains why markets often overreact to news before stabilizing. Understanding behavioral dynamics is essential for traders aiming to anticipate volatility rather than react to it.
11. Risk Management in a Sensitive Global Market
In a world of interlinked sensitivities, risk management becomes critical. Investors and policymakers must monitor not only domestic data but also global developments.
Some strategies include:
Diversification: Spreading investments across geographies, sectors, and asset classes to reduce exposure.
Hedging: Using derivatives like futures or options to protect against currency and commodity fluctuations.
Scenario Analysis: Stress-testing portfolios under various global event assumptions (e.g., rate hikes, trade wars, pandemics).
Institutional investors also use “Value at Risk (VaR)” and sensitivity analysis to measure potential portfolio losses under different global conditions.
12. Case Studies of Market Sensitivity
a) The COVID-19 Pandemic (2020)
Global markets crashed in March 2020 as lockdowns halted economic activity. Equities plunged, oil prices briefly turned negative, and gold soared. Central bank interventions eventually reversed the panic, illustrating the delicate balance of confidence and liquidity in global systems.
b) The Russia-Ukraine Conflict (2022)
This geopolitical crisis disrupted energy and food supply chains, spiking inflation worldwide. It also led to currency instability and a renewed focus on energy independence across Europe.
c) The U.S. Inflation Surge (2022–2023)
The Federal Reserve’s aggressive rate hikes to tame inflation caused a global reallocation of capital—from risk assets to safer bonds—revealing the powerful global sensitivity to American monetary policy.
13. The Future of Global Market Sensitivities
Looking ahead, the world is entering a phase of “multi-polar market sensitivity.” Power is no longer concentrated in a single economy like the U.S.—China, India, and the EU are equally influential in shaping global sentiment.
Key future drivers include:
Energy transition and climate policy.
Technological disruption (AI, automation, and fintech).
Demographic shifts and consumption patterns.
Geopolitical realignments in trade and defense.
In this landscape, adaptability and awareness will be more valuable than prediction.
Conclusion
Global market sensitivities remind us that the world economy operates as a living organism—responsive, reactive, and interconnected. Every policy decision, natural event, or innovation sends ripples across borders, influencing trade, prices, and investment flows.
For investors, understanding these sensitivities is not merely an academic exercise; it’s a survival skill. The ability to interpret global signals, assess risk exposure, and anticipate reactions gives traders a powerful edge in navigating uncertainty.
As global systems evolve, one truth remains constant: markets move not only on numbers, but on how the world feels about them.

The Resurgence of the Commodity MarketIntroduction: The Return of the Commodity Supercycle
In the ever-evolving global financial landscape, the commodity market has made a remarkable comeback after a period of stagnation. From energy to metals, and agricultural goods to rare earth elements, commodities are once again commanding investor attention. This resurgence is not a coincidence—it’s the result of a complex interplay of geopolitical shifts, supply-chain disruptions, climate policies, and global economic realignments.
The early 2020s witnessed extreme volatility due to the pandemic, trade wars, and inflationary pressures. However, by the mid-2020s, commodities began to reassert themselves as a cornerstone of global trade and investment. Whether it’s oil prices surging due to production cuts, gold reclaiming its role as a hedge against inflation, or agricultural commodities thriving under new technological revolutions—this revival is reshaping how investors view raw materials and physical assets.
Understanding Commodities: The Backbone of Global Trade
Commodities are the raw materials essential for industrial production and everyday consumption. They are broadly categorized into:
Energy Commodities – crude oil, natural gas, coal, etc.
Metal Commodities – gold, silver, copper, aluminum, iron ore, etc.
Agricultural Commodities – wheat, coffee, soybeans, sugar, cotton, etc.
Livestock Commodities – cattle, pork, and poultry.
The commodity market operates through two major platforms—spot markets, where physical goods are traded for immediate delivery, and futures markets, where contracts are traded for future delivery at predetermined prices. These markets are not only crucial for producers and consumers but also for investors seeking diversification and protection against inflation.
The Post-Pandemic Economic Reawakening
The COVID-19 pandemic brought global trade to a halt, creating unprecedented demand shocks. However, as economies reopened and recovery began, the demand for commodities soared. Industries rushed to restock raw materials, pushing prices of metals, energy, and agricultural products upward.
Supply Chain Recalibration: The pandemic exposed the fragility of global supply chains. Countries began rethinking their import dependencies, especially in energy and minerals.
Stimulus-Driven Demand: Governments around the world unleashed massive fiscal stimulus packages to boost economic activity, indirectly fueling demand for construction materials, metals, and oil.
Inflation Hedge: With inflation rising globally, investors turned back to commodities as a hedge, boosting demand in futures markets.
This combination of demand revival and constrained supply triggered the beginning of a new commodity upcycle.
Geopolitical Tensions and Their Ripple Effects
One of the strongest catalysts behind the commodity market’s resurgence has been geopolitics. Conflicts and diplomatic realignments have had a direct impact on energy and raw material prices.
Russia-Ukraine Conflict: The war disrupted global energy and grain supplies. Russia, a leading exporter of oil, natural gas, and fertilizers, faced sanctions, leading to supply shortages and price spikes. Ukraine’s grain exports, critical for global food security, were also severely impacted.
Middle East Volatility: Tensions in the Middle East, particularly involving Iran and Israel, have kept oil markets on edge. Any potential disruption in the Strait of Hormuz can impact nearly 20% of global oil supply.
China’s Resource Strategy: China’s efforts to secure long-term supplies of copper, lithium, and rare earth metals have reshaped global trade patterns, pushing other nations to pursue similar strategies.
Such geopolitical events have underscored how commodities are deeply intertwined with international power dynamics, further driving speculative and strategic interest in these markets.
The Green Energy Transition: A New Commodity Boom
The global push toward decarbonization and renewable energy has created a fresh wave of demand for specific commodities. The green revolution isn’t just about technology—it’s about materials.
Copper and Lithium: The shift to electric vehicles (EVs) and renewable power grids has sent demand for copper, lithium, nickel, and cobalt skyrocketing. These metals are essential for batteries, wind turbines, and solar panels.
Silver and Rare Earths: Silver, known for its conductivity, is vital in solar panels, while rare earth elements power everything from smartphones to electric motors.
Biofuels and Carbon Credits: Agricultural commodities like sugarcane and corn are being used for ethanol and biofuel production, adding new dimensions to their market value.
The green energy boom has effectively launched a “new age commodity supercycle”, where metals and minerals once considered niche are now the focal point of trillion-dollar investment flows.
Technological Advancements and Digital Commodities
Technology is transforming how commodities are traded and valued. Advanced analytics, AI-driven forecasting, and blockchain-based smart contracts are modernizing the age-old commodity trading structure.
Blockchain and Transparency: Blockchain ensures traceability in commodity supply chains, helping verify ethical sourcing, especially for minerals like cobalt and gold.
Algorithmic Trading: Automated trading systems now dominate commodity exchanges, bringing efficiency but also higher volatility.
Digital Commodities: The rise of “digital commodities” such as carbon credits and data storage assets introduces a new layer to the market, expanding its traditional boundaries.
These innovations have enhanced accessibility and transparency, attracting new investors and institutional funds to the sector.
Inflation, Interest Rates, and Investor Behavior
Commodities have historically served as a hedge against inflation. As central banks worldwide grapple with balancing inflation control and economic growth, commodities find themselves at the center of monetary policy discussions.
Inflation Hedge: Gold and silver remain the go-to assets for investors seeking protection from currency devaluation.
Interest Rate Impact: While higher interest rates typically strengthen the dollar (making commodities expensive for non-U.S. buyers), they also suppress speculative demand. However, in a persistently inflationary environment, commodities still outperform many asset classes.
Portfolio Diversification: Institutional investors and hedge funds are increasing commodity exposure through ETFs and index funds to reduce portfolio risk amid equity market volatility.
Thus, the commodity market’s resurgence is not only demand-driven but also investor-driven, as market participants recognize its role as a stabilizer during uncertain times.
Agricultural Commodities: The Silent Winners
While energy and metals grab headlines, agricultural commodities are quietly powering a parallel boom. Climate change, shifting consumption patterns, and food security concerns have made agri-commodities more valuable than ever.
Climate Change Impact: Erratic weather patterns have reduced yields in major producing countries, tightening global supplies.
Rising Global Population: A growing population, especially in emerging markets, is pushing up demand for grains, dairy, and edible oils.
Technological Innovations: Precision farming, AI-driven crop analytics, and bio-engineered seeds are improving productivity, balancing supply-demand dynamics.
Commodities like soybeans, corn, and coffee have seen significant price growth as nations prioritize agricultural sustainability and food independence.
Emerging Market Influence and Demand Surge
Emerging economies like India, China, and Brazil are playing a crucial role in sustaining the commodity bull run. Rapid urbanization, industrialization, and infrastructure expansion have created insatiable demand for energy and metals.
India’s Infrastructure Push: Government initiatives like “Make in India” and renewable energy expansion have spiked demand for steel, copper, and coal.
China’s Urban Growth: Despite efforts to shift to a service-based economy, China’s construction and EV sectors remain massive consumers of raw materials.
Africa’s Resource Potential: African nations are emerging as key suppliers of strategic minerals and agricultural goods, reshaping global supply lines.
The commodity trade’s center of gravity is shifting toward the developing world, ensuring that demand remains robust for years to come.
Challenges: Volatility, Speculation, and Sustainability
Despite its strong recovery, the commodity market is not without challenges. Price volatility remains a major concern, often fueled by speculative trading and external shocks.
Speculative Pressure: Hedge funds and institutional investors often amplify price swings through leveraged positions.
Supply Constraints: Political instability, mining regulations, and environmental restrictions can disrupt supply chains.
Sustainability Issues: The environmental footprint of commodity extraction and production is under scrutiny. ESG (Environmental, Social, and Governance) investing is reshaping how funds approach commodity exposure.
For the commodity rally to sustain long-term, balancing profitability with sustainability will be critical.
India’s Role in the Commodity Resurgence
India, one of the world’s fastest-growing economies, stands at the heart of the commodity revival story. With increasing energy needs, a booming manufacturing sector, and a vibrant agricultural economy, India’s commodity exchanges like MCX and NCDEX are seeing heightened activity.
Energy Imports: India’s dependence on crude oil imports makes it sensitive to global price shifts, influencing domestic inflation.
Gold Consumption: India remains one of the top consumers of gold, linking domestic demand directly with international gold markets.
Agri-Exports: Agricultural exports like rice, spices, and sugar are strengthening India’s global trade presence.
Additionally, the Indian government’s focus on renewable energy and green hydrogen places the nation in a unique position to benefit from the global commodity uptrend.
The Road Ahead: A New Commodity Supercycle?
Market analysts increasingly believe that we are at the beginning of a multi-year commodity supercycle, driven by global transformation in energy, technology, and trade. Key factors fueling this outlook include:
Structural demand from green energy and EV sectors.
Chronic underinvestment in mining and exploration.
Persistent geopolitical fragmentation.
Long-term inflationary pressures.
However, the future of this cycle will depend on how nations balance economic growth with climate commitments. Commodities that align with sustainability goals are likely to outperform those that face regulatory or environmental pushback.
Conclusion: The Age of Strategic Commodities
The resurgence of the commodity market is more than a cyclical rebound—it represents a structural shift in how the world values its natural resources. As the global economy transitions toward sustainability, technological innovation, and multipolar trade systems, commodities are reclaiming their central role in economic development and investment strategy.
From oil rigs to lithium mines and from wheat fields to copper smelters, commodities are driving a silent yet powerful revolution in global finance. For investors, this resurgence offers both opportunities and challenges: opportunities to profit from long-term trends, and challenges to navigate volatility and sustainability risks.
In essence, the world has re-entered an era where “resources equal power.” The commodity market’s revival is not just about prices—it’s about the rediscovery of the tangible foundations that sustain modern civilization.
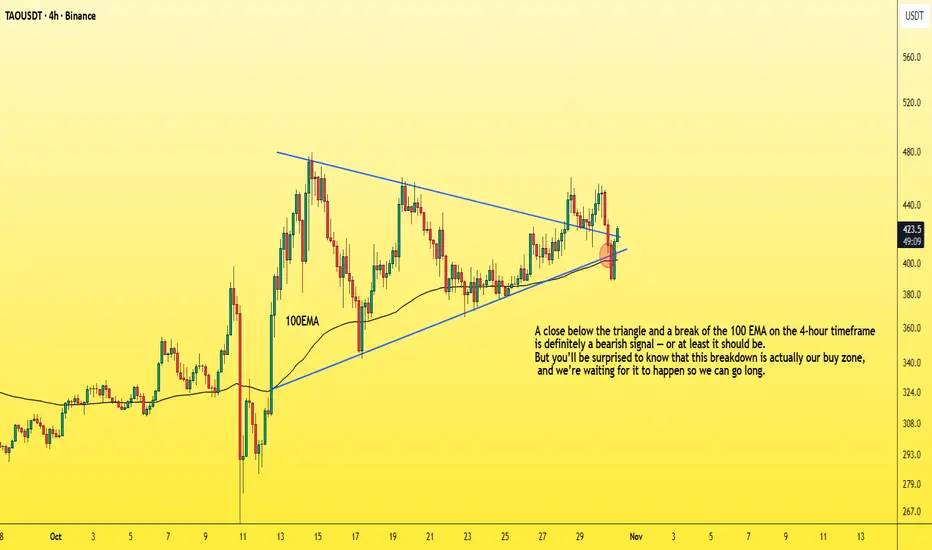
How to enter a successful futures tradeDrop everything and let me show you how to enter a successful long position with the lowest possible risk.
You need to understand that the market maker usually acts against us at major support areas on the chart — like the 100 EMA, 0.618 Fibonacci level, or a trendline.
To make this clearer, let’s take TAO as an example and I’ll explain why.
TAO has strong momentum and a large market cap,
so don’t apply what I’m about to say to meme coins, for example.
Now let’s go step by step on how to enter a futures position after choosing the coin 👇
1. First, wait for a bullish pattern to form — like a triangle — and for the coin to break it upwards with increasing long momentum.
2. The price will then retest the trendline, encouraging people to enter with larger positions, and those who missed the first breakout will likely place buy orders at the retest zone.
3. Then, the market surprises them — it drops back inside the triangle, giving a small bounce at the lower side.
4. But it doesn’t stop there — it continues dropping, breaking below the triangle and closing below the 100 EMA on the 4-hour chart.
This makes you panic and close your long position.
Others start entering shorts thinking it’s a real breakdown.
5. That’s when the market reverses sharply upward,
trapping short traders in losses,
while long traders who exited too early also lose.
In the end, only those who placed buy orders slightly below the strong support level (not directly on it, like under the 100 EMA) — and of course the market maker — end up winning.
So basically, the long traders lose, the short traders lose,
and only a small percentage of smart traders and the market maker win.
Small things to pay attention to 👇
-Your entry point should be slightly below the support, not too far below it.
(That support could be the 100 EMA, below the triangle pattern, or the 0.618 Fibonacci level, as we mentioned.)
-Don’t use high leverage — x5 should be your maximum.
-Place your stop loss 5% below your entry zone,
which equals about 25% loss if you’re using x5 leverage.
And with that, you’ve got yourself a long setup with over a 90% success rate,
and you can apply the same logic in reverse when taking a short position.
Best Regards:
Ceciliones🎯
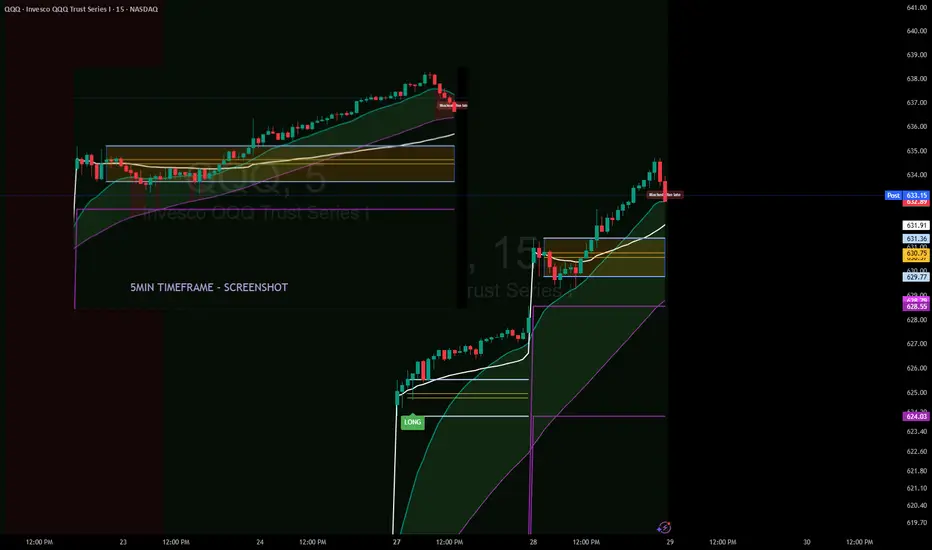
A Lesson in Patience and structure - ORB waited till 2pm todayFellow traders,
Today tested patience more than precision.
The morning was a maze — choppy price action, overlapping candles, and zero conviction. The ORB range between 9:30–9:45 never gave clean confirmation. Buyers held the low, sellers pressed the top, but neither could gain control. Every candle said, “not yet.”
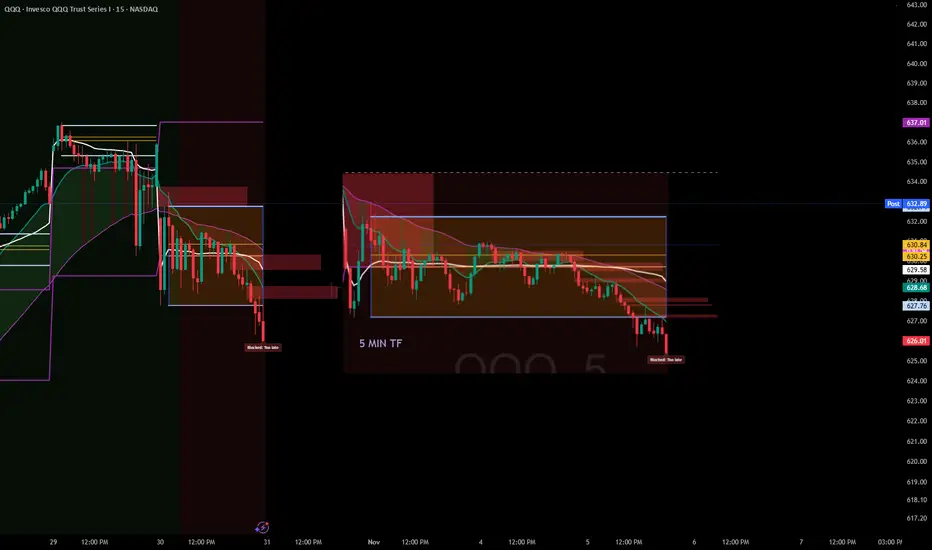
Then came midday compression. From 11 AM to 1:30 PM, QQQ coiled tightly under the EMAs and VWAP. That silence wasn’t random — it was the market loading energy. The moment VWAP was lost for good, the floodgates opened.
Finally, around 2 PM, the breakdown came: a clean retest rejection of the ORB box and an accelerated drop through 629. The move I had been watching all day finally unfolded — only this time, discipline said don’t chase.
And that’s the point of today’s session.
Not every move is yours to catch. Sometimes your biggest win is not forcing a trade that forms too late or breaks your system’s timing window.
Patience is part of the strategy.
The setup played out exactly as it should — I just didn’t have to be in it to learn from it.
Stay disciplined. Stay sharp.
— Trades with B ⚡
Lessons Learned from Past Meltdowns (2008, 2020, etc.)1. The 2008 Financial Crisis: A Wake-Up Call for Systemic Risk
The 2008 Global Financial Crisis (GFC) was triggered by the collapse of the U.S. housing bubble, excessive leverage in financial institutions, and the widespread use of complex derivatives such as mortgage-backed securities (MBS) and collateralized debt obligations (CDOs). When Lehman Brothers filed for bankruptcy in September 2008, panic spread globally. The crisis led to trillions in lost wealth, millions of job losses, and the deepest recession since the Great Depression.
Key Lessons from 2008:
a. Importance of Transparency and Regulation:
The 2008 crisis revealed how opaque financial products and inadequate oversight can destabilize the entire financial ecosystem. Banks took excessive risks without sufficient capital buffers, while rating agencies failed to assess true risk levels. Post-crisis reforms, such as Basel III norms, Dodd-Frank Act, and stress testing frameworks, were introduced to improve capital adequacy, liquidity, and accountability.
b. Systemic Risk Can Spread Rapidly:
The interconnection of global banks turned what began as a housing market issue into a worldwide meltdown. The concept of “too big to fail” became central to financial discourse. The lesson: monitoring systemic risk is as important as regulating individual institutions. Financial contagion can cross borders instantly, necessitating global cooperation among central banks and regulators.
c. Moral Hazard and Bailouts:
Massive government bailouts (e.g., TARP in the U.S.) saved the system but raised questions about moral hazard—whether saving reckless institutions encourages future risk-taking. The lesson was clear: regulation should prevent risk-taking before it requires taxpayer-funded rescues.
d. The Role of Monetary Policy:
Central banks realized their power and limitations. The U.S. Federal Reserve’s near-zero interest rate policy and quantitative easing (QE) became critical tools to stabilize markets. However, these also laid the groundwork for future inflationary pressures and asset bubbles. Lesson: monetary easing is effective but must be balanced with fiscal prudence and structural reforms.
e. Behavioral Economics Matters:
Investor psychology—greed during booms and fear during crashes—played a decisive role. Overconfidence, herd behavior, and the illusion of endless housing price appreciation fueled the bubble. Behavioral finance emerged as a crucial field for understanding and mitigating irrational market behavior.
2. The 2020 Pandemic Crash: A Crisis Like No Other
Unlike 2008, which was a financial crisis rooted in excess and mismanagement, the 2020 crash was a health crisis turned economic catastrophe. When COVID-19 spread globally in early 2020, lockdowns halted production, trade, and travel, triggering a sudden and sharp global recession. Stock markets collapsed, oil prices turned negative, and unemployment soared. Yet, recovery was surprisingly swift—thanks to unprecedented fiscal and monetary interventions.
Key Lessons from 2020:
a. Speed and Scale of Policy Response Matter:
Governments and central banks acted far faster in 2020 than in 2008. The U.S. Federal Reserve slashed rates to zero within weeks and launched unlimited QE, while fiscal packages like the CARES Act pumped trillions into the economy. Similarly, India announced the Atmanirbhar Bharat stimulus. The lesson: speed and magnitude of support can prevent temporary shocks from becoming long-term depressions.
b. Technology as an Economic Lifeline:
The digital economy emerged as a savior. Remote work, e-commerce, fintech, and cloud computing allowed many sectors to survive and even thrive. The pandemic accelerated the digital transformation of business and finance, leading to greater adoption of digital payments, virtual collaboration, and online education. Lesson: digital infrastructure is not optional—it is a core pillar of economic resilience.
c. The Fragility of Global Supply Chains:
The shutdown of manufacturing hubs in China and other countries exposed how deeply global supply chains were interconnected and vulnerable. The shortage of semiconductors, medical supplies, and essential goods highlighted the risk of over-dependence on a few suppliers. Lesson: economies must build supply chain diversification and strategic self-reliance.
d. Inequality and Social Resilience:
The pandemic widened existing inequalities. While asset prices recovered quickly, millions of small businesses and low-income workers faced lasting damage. Lesson: inclusive recovery must be prioritized; safety nets and targeted fiscal support are crucial for societal stability.
e. Investor Behavior and Market Resilience:
The 2020 crash also showcased how investor psychology had evolved. Retail investors, aided by trading apps and social media, became a dominant force. Markets rebounded sharply, partly due to liquidity and optimism about vaccines and technology. Lesson: information flow, sentiment, and social media can now move markets faster than ever.
3. Common Threads Between 2008 and 2020
Though different in origin, both crises shared key characteristics that reveal the vulnerabilities of modern capitalism.
a. Interconnected Global Systems:
Both crises demonstrated how local shocks quickly became global due to financial, trade, and psychological linkages. Whether it was mortgage-backed securities in 2008 or supply chain disruptions in 2020, the globalized economy magnifies contagion. The lesson: resilience depends on diversification—not isolation.
b. Central Bank Dominance:
In both crises, central banks played an unprecedented role. The Federal Reserve, European Central Bank, and others became the “market backstop.” Their actions stabilized confidence but also increased dependence on monetary intervention. This dependence raises long-term concerns about asset bubbles and debt sustainability.
c. The Importance of Communication and Trust:
Both meltdowns showed that trust is the ultimate currency in a crisis. When financial institutions, governments, or investors lose confidence, panic sets in faster than any policy can react. Transparent communication by policymakers can anchor expectations and prevent spirals of fear.
d. Innovation Follows Crisis:
Both periods triggered innovation. After 2008, fintech and blockchain rose from the ashes of mistrust in traditional banks. After 2020, remote work tech, digital health, and AI-driven analytics became mainstream. History proves: crises often accelerate technological and structural evolution.
4. Lessons for Policymakers
a. Build Buffer Capital and Fiscal Space:
Governments and banks must maintain sufficient reserves for emergencies. High fiscal deficits and excessive leverage before a crisis reduce the ability to respond later. Prudent fiscal management and healthy capital ratios are essential for resilience.
b. Develop Counter-Cyclical Tools:
Automatic stabilizers—such as unemployment benefits and targeted stimulus—can cushion economic shocks. Regulators must enforce counter-cyclical lending and investment practices to prevent overheating during booms.
c. Strengthen Global Coordination:
Global problems require global responses. The 2008 and 2020 crises both highlighted how coordination among G20 nations, IMF, and World Bank was vital. Shared frameworks for debt relief, liquidity swaps, and vaccine distribution illustrate the power of cooperation.
d. Invest in Data and Predictive Systems:
Early warning systems using AI and real-time data could help detect vulnerabilities before they escalate. Governments and financial regulators must embrace data-driven policy frameworks for crisis prevention.
5. Lessons for Financial Institutions
a. Risk Management Must Be Dynamic:
Traditional models failed to predict both crises. Stress testing must account for low-probability, high-impact events like pandemics or geopolitical disruptions. Banks must integrate climate risk, cyber risk, and behavioral risk into their frameworks.
b. Liquidity Is King:
Both meltdowns reinforced that liquidity dries up first in a panic. Institutions must maintain adequate short-term funding buffers. Central banks’ liquidity facilities are a lifeline, but dependence should be reduced through prudent planning.
c. ESG and Sustainable Finance:
The 2020 crisis emphasized environmental and social resilience. Firms with strong ESG principles fared better, reflecting investor preference for sustainability. Lesson: ethics and responsibility are now financial imperatives, not optional ideals.
6. Lessons for Investors
a. Stay Rational Amid Panic:
The biggest losses occur when investors react emotionally. Those who stayed invested or bought during the 2020 crash witnessed record recoveries. Lesson: time in the market often beats timing the market.
b. Diversification Works:
Diversified portfolios—across asset classes, sectors, and geographies—performed better in both crises. Lesson: never rely solely on one market or theme.
c. Long-Term Vision Pays Off:
Both crises produced winners—innovative companies that adapted early. Investors who focused on fundamentals and long-term growth stories reaped massive returns. Lesson: focus on quality, adaptability, and innovation.
7. Structural Shifts Triggered by Crises
a. Rise of Alternative Finance:
Post-2008, distrust in banks led to the growth of fintech, crypto assets, and decentralized finance (DeFi). These innovations democratized finance but also created new regulatory challenges.
b. Work and Consumption Redefined:
After 2020, remote work, digital payments, and online services became embedded in everyday life. Businesses now prioritize resilience over efficiency—shifting from “just-in-time” to “just-in-case” models.
c. Inflation and Monetary Reckoning:
Massive stimulus in 2020 eventually fueled inflationary pressures by 2022–23. This underscored that liquidity without productivity creates long-term imbalances. Lesson: monetary expansion must be matched with real economic output.
8. Preparing for the Next Crisis
While we can’t predict the next meltdown, we can prepare for it. Future shocks might stem from climate change, AI-driven job disruptions, or cyber warfare. The lessons from 2008 and 2020 teach us that flexibility, coordination, and foresight are the best defenses.
Anticipate the Unthinkable: Stress testing and scenario modeling must include black swan events.
Prioritize Human Capital: Education, healthcare, and social safety nets ensure societies rebound faster.
Embrace Sustainable Growth: Over-leverage and short-term gains always backfire.
Enhance Financial Literacy: Empowering individuals to understand risk and debt reduces systemic vulnerability.
Conclusion
The crises of 2008 and 2020 were vastly different in origin—one financial, the other biological—but they shared a common truth: economic systems are only as strong as the trust, transparency, and adaptability they embody. The lessons learned from these meltdowns go beyond economics—they speak to governance, ethics, and collective responsibility.
In both cases, the world witnessed immense pain but also extraordinary recovery and innovation. As we move deeper into an era of digital finance, geopolitical shifts, and environmental challenges, these lessons form the blueprint for building a resilient, equitable, and sustainable global economy—one that learns from its scars and grows stronger after every crisis.
The Interconnected Role of Banks and Financial Markets1. The Foundation: Banking and Market Structures
At the heart of the financial system lie two major components—banks and financial markets—that collectively mobilize and allocate resources.
Banks are institutions that accept deposits and extend loans, serving as a bridge between surplus and deficit units. They play a key role in transforming short-term deposits into long-term credit—a process known as maturity transformation.
Financial markets, on the other hand, provide direct channels for capital raising. Investors buy securities issued by corporations or governments, thus providing funds without the need for traditional bank intermediation.
While both systems perform similar economic functions—mobilizing savings, facilitating investment, and managing risks—the mechanisms differ. Banks rely on balance-sheet intermediation, whereas markets depend on price mechanisms and investor behavior. Over time, the boundary between them has blurred due to financial innovation, deregulation, and globalization.
2. Complementary Functions in Capital Allocation
Banks and financial markets complement each other in channeling funds to productive sectors.
Banks specialize in relationship-based finance. They lend to small and medium-sized enterprises (SMEs), consumers, and sectors where creditworthiness is difficult to assess using market signals. Through continuous relationships, banks monitor borrowers, reduce information asymmetry, and support long-term projects.
Financial markets excel in allocating large-scale capital efficiently. Public corporations issue shares or bonds to raise funds from a diverse investor base, allowing broader participation and liquidity. Market prices serve as signals that guide resource allocation—firms with strong prospects can attract funds easily, while weaker firms face higher costs.
This complementarity ensures that both traditional lending and market-based finance coexist, offering a diversified funding ecosystem. For instance, in emerging markets, banks often dominate due to limited capital market development. In contrast, in advanced economies like the U.S., markets play a larger role, but banks remain critical in supporting households and smaller firms.
3. Interdependence through Financial Instruments
The interaction between banks and markets is not merely functional—it is structural. Banks are active participants in financial markets as investors, borrowers, and intermediaries.
As investors, banks hold government securities, corporate bonds, and even equities as part of their portfolios. These assets help manage liquidity, meet regulatory requirements, and generate income.
As borrowers, banks raise funds in the interbank and bond markets, issuing certificates of deposit (CDs), commercial papers, or subordinated debt.
As intermediaries, they facilitate client transactions, underwrite securities, and provide market-making services.
The development of securitization—where banks pool loans (like mortgages) and sell them as securities—further integrates banks with capital markets. This process frees up bank capital for new lending but also links their balance sheets to market fluctuations. The 2008 Global Financial Crisis demonstrated how deep this interconnection had become: when market liquidity dried up, banks’ asset values plummeted, and credit supply froze, leading to a systemic collapse.
4. Role in Monetary Policy Transmission
The central bank’s monetary policy relies heavily on the interconnectedness of banks and financial markets. Policy instruments such as interest rates, reserve requirements, and open market operations influence both sectors simultaneously.
Through banks, lower policy rates reduce borrowing costs, encouraging credit expansion. Higher rates, conversely, tighten lending and cool demand.
Through financial markets, interest rate changes impact bond yields, stock valuations, and investor sentiment. A cut in rates typically boosts equity prices and lowers bond yields, improving firms’ ability to raise funds.
The policy transmission mechanism, therefore, operates via both the bank-lending channel and the asset-price channel. If either sector weakens—say, if banks are undercapitalized or markets are illiquid—the effectiveness of monetary policy diminishes. Hence, a well-integrated and stable relationship between banks and markets is essential for maintaining macroeconomic stability.
5. Risk Sharing and Financial Stability
A major benefit of interconnectedness is diversified risk sharing. Financial markets distribute risks among a broad base of investors, while banks absorb and manage credit risks internally.
However, this interlinkage can also amplify vulnerabilities. Banks’ exposure to market risks—interest rate, liquidity, and credit spread risks—means that shocks in markets can directly hit bank balance sheets. For example, a sudden rise in bond yields can devalue banks’ holdings, reducing their capital adequacy. Similarly, a decline in stock or real estate prices can increase default risks among borrowers.
To mitigate such contagion, financial regulators emphasize macroprudential policies, stress testing, and capital buffers. The Basel III framework, for instance, requires banks to maintain higher liquidity and leverage ratios to withstand market shocks. Simultaneously, market regulators enforce disclosure and transparency norms to prevent mispricing of risks.
6. The Shift Toward Market-Based Finance
In recent decades, there has been a structural shift from bank-dominated systems to market-based finance, particularly in advanced economies. The rise of institutional investors—such as pension funds, mutual funds, and insurance companies—has reduced firms’ dependence on bank loans. Securitization and shadow banking have expanded credit creation outside the traditional banking system.
This evolution enhances financial flexibility but also introduces new systemic risks. Market-based institutions are less regulated and more sensitive to investor sentiment. During crises, sudden capital outflows or liquidity shortages can trigger chain reactions that eventually affect banks. Hence, central banks now monitor not only banking indicators but also non-bank financial intermediation (NBFI) activities to assess systemic health.
7. Globalization and Cross-Border Interlinkages
Global financial integration has deepened the ties between banks and markets across borders. International banks operate in multiple jurisdictions, participating in global bond, currency, and derivative markets. Capital flows move rapidly in response to policy changes or market shocks, linking domestic systems to global cycles.
For example, when the U.S. Federal Reserve tightens rates, emerging markets often experience capital outflows, currency depreciation, and tighter liquidity conditions. Banks in these countries face funding pressures, while local bond markets witness volatility. The 1997 Asian Financial Crisis and the 2008 Global Financial Crisis both highlighted how cross-border linkages can transmit shocks worldwide.
This interconnectedness calls for international coordination in financial regulation and crisis management. Institutions such as the IMF, BIS, and FSB play vital roles in promoting stability through policy frameworks and global standards.
8. Digitalization and Financial Innovation
The digital era has redefined how banks and markets interact. Fintech, blockchain, and digital payments have blurred traditional boundaries even further. Banks use algorithmic trading, robo-advisory, and tokenized assets to access markets efficiently. Meanwhile, online platforms offer market-based credit (peer-to-peer lending) that competes with bank loans.
While innovation enhances efficiency and inclusion, it also introduces cybersecurity risks, data privacy concerns, and regulatory challenges. Central banks are exploring Central Bank Digital Currencies (CBDCs) to ensure that digital finance remains integrated with the formal monetary system. The next phase of interconnectedness will likely involve hybrid models—where banks act as gateways to decentralized markets while maintaining regulatory oversight.
9. The Role During Economic Crises
During economic downturns or financial crises, the interdependence of banks and markets becomes most visible. When one system falters, the other provides temporary stability—though sometimes at a cost.
In crises like 2008, central banks injected liquidity into both sectors through quantitative easing (QE)—purchasing bonds and securities to stabilize markets and ensure banks had access to funds.
Conversely, when markets freeze, banks become the primary credit providers, cushioning the economy through lending backed by government guarantees.
The COVID-19 pandemic reaffirmed this relationship. As markets crashed, banks played a stabilizing role by extending credit lines, while policy interventions restored confidence in capital markets. Such coordination ensures the continuity of capital flow and prevents systemic collapse.
10. Emerging Market Perspectives
In emerging economies like India, Brazil, and Indonesia, banks traditionally dominate the financial system due to underdeveloped markets. However, the trend is gradually changing as equity and bond markets expand and retail participation grows.
For instance, in India, the rise of corporate bond markets, mutual funds, and Sovereign Gold Bonds (SGBs) has diversified funding channels. Yet, banks remain central to infrastructure financing and SME lending—areas where markets are less effective. The integration between banks and markets is therefore essential for mobilizing long-term capital, especially for nation-building projects.
Regulatory bodies like the Reserve Bank of India (RBI) and SEBI coordinate to align monetary and market policies, ensuring balance between credit growth and capital market stability.
11. Policy Implications and the Need for Balance
The interconnectedness between banks and markets creates both opportunities and risks. Policymakers must strike a balance between efficiency, innovation, and stability.
Excessive dependence on banks can limit credit diversification and expose economies to concentrated risks.
Overreliance on markets can lead to speculative bubbles and volatility.
Thus, a hybrid financial architecture—where banks and markets complement each other—is most desirable. Regulations should encourage market deepening while ensuring that banks remain well-capitalized and resilient.
Coordinated oversight, robust information systems, and global cooperation are crucial. Transparency in both banking operations and market transactions helps prevent contagion and enhances investor confidence.
12. Conclusion: An Integrated Financial Ecosystem
The relationship between banks and financial markets is not one of competition, but of mutual reinforcement. Together, they form an integrated ecosystem that fuels economic growth, manages risks, and supports innovation. Their interconnection ensures that savings are efficiently transformed into investments, liquidity is maintained across sectors, and monetary policy reaches its intended targets.
As the global economy evolves—driven by technology, globalization, and sustainability—this partnership will become even more intricate. The challenge for regulators, investors, and policymakers is to harness the benefits of this interconnectedness while minimizing systemic vulnerabilities. A stable, transparent, and adaptive financial system—where banks and markets coexist harmoniously—is the cornerstone of a resilient global economy.

Blockchain’s Role in Different Trading Segments1. Introduction: Redefining Trust in the Trading World
The modern trading ecosystem — spanning financial markets, commodities, forex, and digital assets — relies heavily on trust, transparency, and speed. For decades, intermediaries such as brokers, clearing houses, and central depositories have played a vital role in ensuring smooth settlements and recordkeeping. However, this system is often plagued by inefficiencies, high transaction costs, and occasional lapses in security or accountability.
Enter blockchain technology — a decentralized ledger system that offers immutable, transparent, and secure recordkeeping. By eliminating the need for traditional intermediaries, blockchain has the potential to revolutionize how trades are executed, verified, and settled across different segments of the global financial market.
Blockchain’s role in trading is not confined to cryptocurrencies. Its applications now extend to stock markets, commodity exchanges, forex trading, derivatives, and even carbon credit and energy trading. Each of these sectors can benefit from blockchain’s ability to automate trust and reduce systemic inefficiencies.
2. Understanding Blockchain in the Context of Trading
At its core, blockchain is a distributed database shared among a network of participants. Once data — such as trade details or payment confirmations — is recorded on the blockchain, it cannot be altered without the consensus of the network. This ensures that all trading participants operate from a single, verified source of truth.
In trading terms:
Each transaction (buy or sell order) is a “block.”
These transactions are chained together chronologically.
The system is decentralized, meaning no single entity can manipulate data.
This architecture has far-reaching implications for global markets:
Instant settlements instead of multi-day clearing cycles.
Elimination of counterparty risk, as smart contracts execute automatically.
Lower transaction costs due to reduced intermediary dependence.
Enhanced auditability, since all data is time-stamped and verifiable.
3. Blockchain in Stock Market Trading
The traditional equity trading system involves multiple intermediaries — brokers, stock exchanges, clearing corporations, and custodians — all performing specific functions such as matching orders, confirming trades, and settling securities. While effective, this system is slow and costly.
How Blockchain Transforms Stock Trading
Real-Time Settlement: Blockchain can reduce the settlement period from the current T+2 (trade date plus two days) to near-instantaneous settlement (T+0). This significantly reduces liquidity risk and capital lock-in.
Tokenization of Assets: Shares can be represented as digital tokens on a blockchain. This enables fractional ownership, making high-value stocks accessible to smaller investors.
Decentralized Exchange Platforms: Decentralized stock trading platforms can facilitate peer-to-peer transactions without intermediaries, ensuring transparency and reducing costs.
Immutable Recordkeeping: Corporate actions such as dividends, bonus issues, and stock splits can be recorded permanently and automatically distributed using smart contracts.
Examples
Nasdaq Linq: One of the early adopters of blockchain, Nasdaq used the Linq platform to record private securities transactions, demonstrating efficiency and transparency.
India’s NSE pilot programs: The National Stock Exchange of India has experimented with blockchain for know-your-customer (KYC) data and settlement tracking.
4. Blockchain in Forex (Foreign Exchange) Trading
The foreign exchange market is the world’s largest financial market, with daily volumes exceeding $7 trillion. Yet, it remains fragmented, opaque, and reliant on central intermediaries like banks and payment processors.
Blockchain’s Advantages in Forex
Cross-Border Settlement: Blockchain enables direct peer-to-peer currency exchange without intermediaries, drastically cutting transfer times and fees.
Transparency and Auditability: All trades recorded on a blockchain are verifiable, reducing manipulation and fraud risks.
Smart Contracts for FX Swaps: Automated execution of forex swaps and forward contracts ensures minimal counterparty risk.
24/7 Accessibility: Unlike traditional systems, blockchain-based FX networks can operate continuously without downtime.
Example
RippleNet and Stellar Lumens use blockchain to enable instant cross-border currency transfers with minimal costs, challenging the dominance of SWIFT.
5. Blockchain in Commodity Trading
Commodity trading — involving oil, metals, and agricultural goods — often suffers from documentation delays, supply chain opacity, and settlement inefficiencies. Blockchain brings trust and traceability to this sector.
Applications
Smart Contracts for Trade Settlement: Automatically execute trades once contractual conditions are met (e.g., delivery confirmation triggers payment).
Supply Chain Transparency: Blockchain can trace commodities from extraction or production to final sale, ensuring authenticity and sustainability.
Tokenization of Commodities: Commodities like gold, crude oil, or carbon credits can be represented digitally, making them easier to trade and fractionalize.
Reduction in Paperwork: Blockchain eliminates the need for multiple physical documents like bills of lading, inspection certificates, and letters of credit.
Example
Vakt, a blockchain-based platform supported by BP and Shell, digitizes the post-trade processes in oil markets, improving efficiency and reducing fraud.
6. Blockchain in Derivatives and Futures Markets
Derivatives — including futures, options, and swaps — are complex instruments often involving multiple intermediaries. Blockchain’s smart contracts can automate these trades and settlements with precision.
Benefits
Instantaneous Settlement: Reduces the time gap between contract execution and settlement, minimizing counterparty and liquidity risks.
Automated Margin Calls: Smart contracts can automatically adjust margin requirements based on real-time price movements.
Transparency: Blockchain’s shared ledger ensures all participants view the same data, reducing disputes.
Regulatory Compliance: Blockchain enables real-time reporting to regulators, improving oversight.
Example
DTCC (Depository Trust & Clearing Corporation), which handles trillions in derivatives, has explored blockchain for trade reporting and settlement to enhance efficiency.
7. Blockchain in Cryptocurrency Trading
Cryptocurrency trading is the first and most obvious area where blockchain has already established dominance. Cryptos like Bitcoin and Ethereum are themselves blockchain-native assets, and their trading happens entirely on blockchain-based exchanges.
Innovations
Decentralized Exchanges (DEXs): Platforms like Uniswap and PancakeSwap allow traders to exchange tokens directly from their wallets without intermediaries.
Liquidity Pools: Smart contracts automatically match buyers and sellers, ensuring market liquidity.
Transparency and Security: Every trade is publicly recorded on the blockchain, ensuring full auditability.
Challenges
High volatility, lack of regulation, and scalability limitations still pose obstacles to mainstream adoption.
8. Blockchain in Energy and Carbon Credit Trading
The rise of sustainability-focused finance has introduced new markets like carbon credits and renewable energy certificates. Blockchain ensures authenticity and prevents double-counting in these emerging asset classes.
Applications
Tokenized Energy Certificates: Renewable energy output (solar, wind, hydro) can be tokenized and traded on blockchain platforms.
Carbon Credit Trading: Blockchain ensures each credit is unique, traceable, and not resold multiple times.
Peer-to-Peer Energy Trading: Consumers with solar panels can directly sell surplus energy to others through blockchain-enabled microgrids.
Example
Power Ledger (Australia) uses blockchain to enable P2P renewable energy trading, giving consumers control over energy distribution and pricing.
9. Blockchain in Real Estate and Asset Tokenization
Although not traditionally viewed as a “trading” sector, real estate is rapidly evolving into a digital trading marketplace through blockchain tokenization.
Benefits
Fractional Ownership: High-value properties can be divided into digital tokens, allowing small investors to participate.
Instant Liquidity: Instead of lengthy paperwork, property tokens can be traded instantly on secondary markets.
Transparency and Authenticity: Land titles and ownership histories recorded on blockchain reduce fraud.
Example
Platforms like RealT and Propy are pioneering blockchain-based real estate trading with tokenized assets.
10. Blockchain’s Role in Regulatory Compliance and Risk Management
Beyond execution and settlement, blockchain plays a crucial role in compliance, auditing, and risk management.
Regulatory Advantages
Real-Time Monitoring: Regulators can access immutable records of trades in real-time.
KYC/AML Integration: Blockchain-based identity systems simplify customer verification while maintaining data privacy.
Reduced Fraud and Errors: Tamper-proof records and automated reconciliations enhance overall market integrity.
Example
The European Securities and Markets Authority (ESMA) has studied blockchain-based trade reporting to enhance transparency across the EU markets.
11. Challenges and Limitations
Despite its immense potential, blockchain adoption in trading faces practical and regulatory hurdles:
Scalability Issues: Large exchanges process millions of transactions daily; most blockchains still struggle with high throughput.
Regulatory Uncertainty: Many governments have yet to create clear frameworks for blockchain-based trading systems.
Integration Complexity: Legacy financial infrastructure is deeply entrenched, making transition costly and time-consuming.
Privacy Concerns: While transparency is valuable, full data visibility may conflict with confidentiality requirements in institutional trading.
Energy Consumption: Proof-of-work systems like Bitcoin consume significant power, though newer consensus models (e.g., proof-of-stake) are more efficient.
12. The Future of Blockchain in Global Trading
As the technology matures, blockchain is expected to become the backbone of next-generation trading infrastructure. The future may see:
Fully tokenized stock exchanges, where equities, bonds, and derivatives exist as digital assets.
Interoperable blockchains, allowing seamless transfers between different networks and asset classes.
AI and blockchain integration, combining data-driven trading strategies with transparent execution.
Central Bank Digital Currencies (CBDCs) simplifying settlement between global financial institutions.
The convergence of blockchain, AI, and IoT will lead to hyper-efficient, transparent, and inclusive trading ecosystems — reshaping how capital, commodities, and data flow across borders.
13. Conclusion
Blockchain’s entry into the trading world represents a paradigm shift — from trust-based intermediaries to trustless digital verification. Whether in stock markets, forex, commodities, or emerging asset classes like carbon credits, blockchain introduces unmatched levels of transparency, efficiency, and inclusiveness.
While challenges persist, the direction is clear: blockchain is not just a supporting technology; it is the new foundation of global trading architecture. The world’s markets are moving steadily toward an era where every trade, every asset, and every participant is digitally connected in a decentralized, verifiable, and borderless network of trust.
Defining Shadow Banking: Beyond Traditional FinanceIntroduction: The Rise of a Parallel Financial Universe
The modern financial system is far more complex than traditional banking institutions alone. Beyond the visible landscape of commercial banks, savings institutions, and central banks lies an intricate web of entities and mechanisms collectively known as the shadow banking system. This term, though somewhat misleading, refers not to illegal or secretive finance, but to a vast network of non-bank financial intermediaries that perform bank-like functions — such as credit intermediation, liquidity transformation, and maturity transformation — without being subject to the same regulatory oversight as traditional banks.
Shadow banking has grown exponentially over the past three decades, transforming from a peripheral market function into a core pillar of global finance. By the mid-2020s, the Financial Stability Board (FSB) estimated the size of the shadow banking sector to exceed $65 trillion globally, encompassing everything from money market funds, hedge funds, and private credit vehicles to structured finance products and fintech lending platforms. Its growth underscores both the innovation and risks embedded within modern financial markets.
Understanding Shadow Banking: A Conceptual Definition
At its core, shadow banking refers to credit intermediation that occurs outside the traditional banking system. In simpler terms, it’s about institutions that borrow funds and lend them out — just like banks — but without having access to central bank funding or deposit insurance protections.
The term “shadow” doesn’t imply illegitimacy; rather, it reflects the lack of regulatory transparency and indirect connection to formal monetary authorities. These entities can include:
Investment funds (hedge funds, private equity funds, venture capital, mutual funds)
Structured investment vehicles (SIVs)
Asset-backed securities (ABS) and collateralized debt obligations (CDOs)
Money market funds (MMFs)
Fintech platforms and peer-to-peer lenders
Insurance and pension funds engaged in credit intermediation
Collectively, these entities provide credit, liquidity, and investment opportunities across global markets — often operating with higher flexibility, leverage, and innovation than banks, but also carrying higher systemic risk.
The Evolution of Shadow Banking: From Innovation to Complexity
The shadow banking system did not emerge overnight. Its origins trace back to financial deregulation and innovation in the late 20th century.
1970s–1980s: The Birth of Market-Based Lending
During this period, banks faced restrictions on deposit interest rates and lending limits. As markets liberalized, non-bank entities started to fill the gaps by offering higher returns and more flexible credit. Money market funds became popular as safe alternatives to bank deposits.
1990s–2000s: The Era of Securitization
Financial institutions began to transform illiquid loans (like mortgages) into tradable securities, allowing risk to be distributed across investors globally. This process — known as securitization — became the backbone of shadow banking. Structured products like mortgage-backed securities (MBS) and CDOs attracted massive investment inflows, particularly from institutional investors.
2000s–2008: The Shadow Banking Boom and Crisis
Before the 2008 Global Financial Crisis (GFC), shadow banking had become deeply intertwined with traditional banks. Many banks funded their off-balance-sheet operations through shadow channels, leveraging short-term borrowing in wholesale markets. When liquidity dried up in 2008, the collapse of shadow banking chains amplified the crisis, revealing its systemic fragility.
Post-2008: Regulation and Re-emergence
After the GFC, regulators tightened banking supervision, inadvertently pushing risk-taking into the shadows once again. With stricter capital requirements on banks, credit migration occurred toward private credit funds, fintech lenders, and structured finance entities. By the 2020s, shadow banking had reinvented itself — more diversified, tech-driven, and global than ever.
Core Functions of Shadow Banking
Despite operating outside traditional frameworks, shadow banking serves crucial economic functions. Understanding these helps explain its resilience and attractiveness.
1. Credit Intermediation
Shadow banks channel savings into investments by lending to corporations, households, and governments. For example, private credit funds and securitization vehicles provide loans where banks might hesitate due to risk-weighted capital constraints.
2. Maturity Transformation
Similar to banks, shadow entities borrow short-term (e.g., through repurchase agreements or money markets) and lend long-term (e.g., mortgages, infrastructure loans). This creates liquidity but also exposes them to rollover risk — the inability to renew short-term funding during stress periods.
3. Liquidity Transformation
Through securitization and other mechanisms, illiquid assets are repackaged into marketable securities. This process enhances financial market efficiency but can distort true asset quality and risk perception.
4. Risk Transfer
Shadow banking allows risks to be distributed among investors rather than concentrated in banks. However, it also creates opacity, as risk becomes harder to trace and assess across the financial chain.
5. Market Innovation and Flexibility
Without the burden of heavy regulation, shadow entities can innovate rapidly. Fintech-based lending, decentralized finance (DeFi), and structured investment products owe their existence to this flexibility.
Major Components of the Shadow Banking Ecosystem
1. Money Market Funds (MMFs)
MMFs act as short-term investment vehicles that provide liquidity to borrowers and stable returns to investors. However, during crises, sudden redemptions can trigger liquidity squeezes, as seen in 2008 and during the COVID-19 panic of 2020.
2. Securitization Vehicles
Entities such as special purpose vehicles (SPVs) pool loans (mortgages, auto loans, etc.) and issue asset-backed securities. This helps lenders free up capital but makes the system vulnerable to cascading defaults if underlying assets deteriorate.
3. Hedge Funds and Private Credit
Hedge funds often engage in leveraged lending or credit arbitrage. Private credit funds have recently become major financiers of mid-sized businesses, filling gaps left by cautious banks.
4. Fintech and Peer-to-Peer (P2P) Lenders
Digital platforms like LendingClub, Upstart, or India’s NBFC-based fintechs offer fast, tech-enabled credit solutions. While democratizing finance, they also introduce cyber and data-driven risks.
5. Repurchase Agreements (Repo Markets)
Repos allow institutions to borrow short-term funds by pledging securities as collateral. Though efficient, they are central to shadow liquidity chains, making them a potential point of contagion.
Advantages of Shadow Banking: Why It Matters
Enhancing Credit Availability
Shadow banks often lend to sectors or borrowers overlooked by traditional banks — such as small businesses, startups, or subprime consumers — thereby supporting financial inclusion and economic growth.
Improving Market Liquidity
Through securitization and secondary markets, shadow entities increase liquidity, helping investors adjust portfolios efficiently.
Driving Innovation
By operating outside regulatory rigidity, shadow players have been the source of major financial innovations — from structured products to algorithmic lending models.
Diversifying Risk and Funding Sources
Shadow banking broadens funding channels, reducing dependence on the banking sector alone.
Risks and Challenges: The Dark Side of the Shadows
While shadow banking fuels financial dynamism, it also poses serious systemic risks.
1. Lack of Transparency and Regulation
Many shadow activities occur off-balance-sheet, making it difficult for regulators to monitor risk accumulation. This opacity can mask leverage and credit quality problems until it’s too late.
2. Liquidity Mismatch and Runs
Entities that borrow short-term and lend long-term are vulnerable to sudden funding withdrawals, leading to fire sales and contagion — much like a bank run, but without deposit insurance safety nets.
3. Interconnectedness with Traditional Banks
Though formally separate, shadow banks often rely on bank credit lines and repo funding, meaning shocks can quickly spill into the regulated system.
4. Procyclicality
Shadow banking amplifies credit cycles — expanding rapidly during booms and contracting sharply during downturns — thereby intensifying market volatility.
5. Regulatory Arbitrage
By exploiting gaps in financial regulations, shadow entities can take excessive risks that banks cannot. This can undermine the intent of financial stability rules.
Post-Crisis Reforms and Regulatory Oversight
Since 2008, global regulators have taken several steps to contain shadow banking risks:
Financial Stability Board (FSB) introduced the term “Non-Bank Financial Intermediation (NBFI)”, to reduce stigma and establish better oversight.
Basel III tightened bank capital and liquidity standards, reducing reliance on off-balance-sheet vehicles.
Money Market Fund reforms introduced liquidity buffers and redemption gates.
Repo market regulations sought to enhance collateral transparency.
Macroprudential policies began monitoring interconnected leverage between banks and non-banks.
However, regulation remains fragmented. As shadow banking evolves through fintech, decentralized finance (DeFi), and global capital mobility, regulators often play catch-up in a fast-moving ecosystem.
The New Era: Shadow Banking Meets Technology
The 2020s have introduced a new dimension: digital shadow banking. Fintechs, crypto-based lending platforms, and algorithmic liquidity pools now conduct credit intermediation at scale — often without clear jurisdictional boundaries.
Fintech Credit: Online lenders use data analytics and AI to assess credit risk rapidly, bypassing traditional bank models.
DeFi (Decentralized Finance): Blockchain platforms facilitate peer-to-peer lending and liquidity pools, effectively creating shadow banking 2.0, where smart contracts replace intermediaries.
Private Credit Expansion: Institutional investors are increasingly shifting toward direct lending, driving a multi-trillion-dollar private debt market.
These innovations improve accessibility but introduce new systemic vulnerabilities — such as cyber risk, operational fragility, and regulatory blind spots.
India’s Perspective: The NBFC-Shadow Banking Nexus
In India, shadow banking largely manifests through Non-Banking Financial Companies (NBFCs). They play a vital role in credit delivery to sectors like MSMEs, real estate, and rural finance. However, episodes like the IL&FS crisis (2018) highlighted their dependence on short-term funding and exposure to credit concentration.
The Reserve Bank of India (RBI) has since strengthened NBFC oversight through:
Scale-based regulation framework
Liquidity coverage ratios
Enhanced stress testing and capital norms
Despite challenges, India’s NBFCs and fintech lenders remain crucial conduits for inclusive growth, bridging gaps that banks often leave unserved.
Conclusion: The Future of Finance Lies in the Shadows
Shadow banking is neither a villain nor a savior. It represents the unseen arteries of global finance — channels that enable credit, innovation, and liquidity to flow where traditional banks cannot. Yet, its very strengths — flexibility, innovation, and reach — are also its vulnerabilities.
As the world moves toward a digital and decentralized financial order, shadow banking will likely expand further, reshaping how economies allocate capital. The challenge for regulators, investors, and policymakers lies in balancing innovation with stability — ensuring that the “shadows” remain a source of light, not systemic darkness.
Ultimately, shadow banking reflects the continuing evolution of capitalism itself — adaptive, complex, and perpetually pushing beyond the boundaries of regulation. Its future will depend on how wisely we illuminate its paths without extinguishing its creative spark.
Why the Eurodollar Market Became a Financial HavenIntroduction
The Eurodollar market stands as one of the most significant and transformative developments in modern finance. Despite its name, the term “Eurodollar” has little to do with Europe as a continent or the euro as a currency. Instead, it refers to U.S. dollar-denominated deposits held in banks outside the United States, particularly in Europe during its early days. What began as a niche market in the post-World War II era gradually evolved into a global financial haven—an offshore ecosystem of liquidity, flexibility, and innovation that reshaped international finance.
Understanding why the Eurodollar market became a financial haven requires examining the historical context, regulatory framework, and the incentives driving global capital flows. It was not merely a byproduct of globalization; it was the very foundation that allowed global finance to operate efficiently across borders, free from the constraints of national monetary policies.
1. Origins of the Eurodollar Market
The roots of the Eurodollar market trace back to the late 1940s and 1950s, when geopolitical tensions and economic transformations began reshaping the financial landscape. After World War II, the United States emerged as the world’s dominant economic power, with the U.S. dollar becoming the global reserve currency under the Bretton Woods system.
During this time, many foreign banks and corporations began holding dollar deposits outside the United States, particularly in European banks. One of the first major holders of such deposits was the Soviet Union, which sought to protect its dollar holdings from potential U.S. sanctions during the Cold War. By placing dollars in European banks, the Soviets could still conduct trade and financial transactions in dollars—without the risk of U.S. authorities freezing their assets.
As European economies rebuilt under the Marshall Plan, dollar-based trade expanded rapidly. European banks found themselves flush with dollar deposits, which they began lending out to other international borrowers. This marked the birth of the Eurodollar market—a decentralized, unregulated offshore market for U.S. dollars.
2. Regulatory Arbitrage: The Core Catalyst
The Eurodollar market thrived largely because it existed outside U.S. regulatory jurisdiction. Domestic banks in the United States faced strict regulations under the Federal Reserve System, including reserve requirements and interest rate ceilings imposed by Regulation Q. These restrictions limited how much interest U.S. banks could pay on deposits and constrained their lending flexibility.
In contrast, offshore banks—mainly in London—were not subject to U.S. banking regulations. This regulatory arbitrage created a competitive advantage: Eurodollar deposits could offer higher interest rates, and Eurodollar loans could be made more flexibly and at lower costs.
Borrowers and depositors around the world quickly recognized the benefits. Multinational corporations preferred Eurodollar loans for their international operations, and investors sought Eurodollar deposits for better yields. The absence of reserve requirements meant that Eurobanks could leverage their funds more aggressively, enhancing liquidity in the market.
This unregulated freedom made the Eurodollar system an ideal haven—a place where capital could move freely, unencumbered by the constraints of national borders and domestic monetary policies.
3. The London Advantage: The World’s Financial Hub
London’s role as the birthplace and hub of the Eurodollar market was no coincidence. The city had centuries of experience as a global financial center, connecting Europe, America, and the Commonwealth. By the 1950s, the British government encouraged offshore banking activity to boost its post-war economy and maintain London’s global relevance.
The Bank of England adopted a hands-off approach toward Eurodollar transactions, seeing them as foreign currency operations that did not affect domestic monetary stability. This permissive environment, combined with London’s strategic time zone (bridging Asia and America), created a perfect breeding ground for 24-hour international finance.
As a result, London became the nerve center of global dollar liquidity, with Eurodollar deposits circulating seamlessly between Europe, Asia, and the Americas. By the 1970s, Eurodollar markets had become the cornerstone of global finance—fueling trade, investment, and speculation on an unprecedented scale.
4. The Rise of Global Liquidity and Flexibility
The Eurodollar market’s greatest strength was its ability to provide liquidity when and where it was needed most. Unlike domestic banking systems, which were often constrained by national policies and reserve rules, Eurobanks operated in a borderless environment.
Corporations used Eurodollar loans to fund trade, mergers, and acquisitions, while central banks and sovereign wealth funds used Eurodollar deposits as a store of value. The market also became a vital source of funding for governments, especially developing nations seeking to borrow in dollars without going through the tightly regulated U.S. market.
By the late 1960s, the Eurodollar market had grown into a massive pool of offshore liquidity. When the Bretton Woods system collapsed in 1971 and exchange rates began to float, the Eurodollar market became even more essential. It offered a global mechanism for hedging, borrowing, and investing across currencies—laying the foundation for today’s interconnected financial system.
5. Freedom from Monetary Control
Another key reason the Eurodollar market became a financial haven lies in its freedom from central bank control. In the U.S., the Federal Reserve could regulate domestic money supply, influence interest rates, and impose capital controls. However, it had little jurisdiction over offshore dollar transactions.
This meant that even when the Fed tightened domestic credit conditions, international borrowers could still access dollar liquidity through Eurobanks. In essence, the Eurodollar market allowed global finance to operate independently of U.S. monetary policy.
This autonomy had far-reaching implications. It weakened the effectiveness of national monetary controls and allowed financial institutions to bypass domestic credit restrictions. The result was a truly globalized money market—one that operated beyond the reach of any single government, creating a self-sustaining ecosystem of private credit creation.
6. Innovation and Market Instruments
The Eurodollar market also became a laboratory for financial innovation. As competition intensified, banks developed new instruments to manage risk and enhance returns. These included floating-rate loans, syndicated lending, and short-term Eurodollar certificates of deposit.
The introduction of the London Interbank Offered Rate (LIBOR) in the 1960s provided a standardized benchmark for pricing Eurodollar loans. LIBOR quickly became the most important reference rate in global finance, underpinning trillions of dollars in loans, derivatives, and securities.
These innovations transformed the Eurodollar market into a complex web of interbank relationships and credit channels. It was not just a deposit market—it was a full-fledged financial system operating parallel to, but distinct from, domestic banking systems.
7. Safe Haven for Capital and Sovereigns
For many investors and nations, the Eurodollar market became a safe haven for several reasons:
Currency Stability: The U.S. dollar was (and remains) the world’s most trusted currency. Holding dollar assets offshore allowed investors to preserve value even when local currencies faced inflation or devaluation.
Confidentiality: Offshore banking jurisdictions often offered privacy and discretion, making them attractive to corporations, governments, and wealthy individuals seeking to protect their assets from political risks.
Political Neutrality: During the Cold War and beyond, the Eurodollar market offered a politically neutral ground for transactions between entities that might not otherwise cooperate through U.S.-regulated channels.
Diversification: Holding Eurodollar assets provided global investors with diversification away from domestic financial risks.
These features reinforced the Eurodollar market’s reputation as a financial sanctuary, a place where money could flow freely and securely amid global uncertainty.
8. The Eurodollar Market and Global Financial Power
Over time, the Eurodollar system reshaped the balance of financial power. It gave rise to massive offshore banking networks, enabled shadow banking, and facilitated the globalization of credit.
By the 1980s and 1990s, Eurodollar deposits had become an integral part of international capital markets. They funded corporate expansions, sovereign debt issuance, and speculative investments across continents. Even today, a significant portion of the world’s dollar liquidity exists outside U.S. borders—testament to the enduring legacy of the Eurodollar market.
In essence, the Eurodollar market made the U.S. dollar truly global—not just a national currency, but the lifeblood of international finance. Ironically, while it strengthened the dollar’s dominance, it simultaneously limited America’s ability to control its own currency’s global circulation.
9. Challenges and Risks
While the Eurodollar market offered flexibility and freedom, it also introduced new risks. The absence of regulation meant there was no lender of last resort for Eurobanks. During periods of financial stress, such as the 2008 Global Financial Crisis, the shortage of dollar liquidity in offshore markets amplified global instability.
Moreover, the market’s opacity made it difficult for regulators to monitor systemic risk. Interbank exposures, derivative linkages, and maturity mismatches often went undetected until crises struck. Despite these challenges, the Eurodollar market’s scale and interconnectedness made it impossible to dismantle—it had become too central to the functioning of global finance.
10. The Modern Eurodollar Landscape
Today, the Eurodollar market continues to play a vital role, even as financial technology and regulations evolve. Although LIBOR is being phased out and replaced by alternative benchmarks like SOFR (Secured Overnight Financing Rate), the fundamental dynamics of offshore dollar liquidity remain intact.
From Asian financial hubs like Singapore and Hong Kong to Middle Eastern centers like Dubai, the Eurodollar spirit lives on through global dollar lending and deposit activities. The rise of digital finance and offshore capital markets further extends the reach of the Eurodollar ecosystem—making it an indispensable pillar of the global financial architecture.
Conclusion
The Eurodollar market became a financial haven because it embodied freedom, efficiency, and trust in a world increasingly shaped by regulation and geopolitics. Its unregulated origins offered participants higher yields and greater flexibility, while its global reach turned the U.S. dollar into a universal instrument of trade, investment, and security.
From Cold War strategies to modern financial globalization, the Eurodollar market represents more than just offshore banking—it represents the world’s pursuit of monetary independence beyond political borders.
Even in the 21st century, the Eurodollar system remains the invisible backbone of global liquidity, silently powering international finance. It is both a sanctuary for capital and a mirror of our interconnected economic reality—a financial haven born from innovation, trust, and the unstoppable flow of money across nations.

AI as a Catalyst for Global Economic IntegrationIntroduction: A New Era of Intelligent Globalization
Artificial Intelligence (AI) is redefining how the world communicates, trades, and grows economically. Unlike the previous waves of globalization powered by industrialization or digital communication, the AI revolution represents a more intelligent and automated form of global integration. It is not just connecting markets—it is aligning human decision-making, production efficiency, and cross-border collaboration on a scale never seen before.
AI acts as a catalyst for global economic integration by enabling smarter supply chains, automated financial systems, predictive analytics for trade, and adaptive manufacturing that transcends geographical limitations. From multinational corporations optimizing global logistics to small businesses accessing international markets through AI-driven e-commerce, the influence of artificial intelligence is broad and transformative.
In the following sections, we explore how AI fosters global integration, reshapes economic landscapes, and bridges gaps between developed and developing economies.
1. The Foundation of Economic Integration in the AI Age
Economic integration refers to the process where nations coordinate economic policies, remove trade barriers, and align market systems to promote free flow of goods, services, capital, and technology. Historically, it evolved in stages — from free trade agreements and customs unions to common markets and economic unions.
Now, AI adds a fifth dimension to this progression: intelligent integration. This stage is marked by the use of machine learning, automation, and data analytics to:
Synchronize economic data across borders
Predict market behavior
Improve trade efficiency
Foster innovation in global industries
AI creates digital bridges that are faster and more accurate than political treaties or traditional trade mechanisms. It ensures that integration is not just about policy coordination but about real-time decision alignment across continents.
2. AI and the Transformation of Global Trade Dynamics
Global trade is the lifeblood of economic integration. Traditionally, logistics inefficiencies, fluctuating demand, and geopolitical uncertainties hindered smooth trade flows. AI is eliminating these barriers through advanced analytics and automation.
a. Predictive Trade Analytics
AI can analyze large datasets of global demand, pricing trends, and shipping routes to forecast trade movements. This helps exporters and importers anticipate shifts in demand, reduce wastage, and optimize production levels.
For instance, platforms like IBM Watson and Google Cloud AI provide supply chain optimization solutions that monitor real-time trade conditions and suggest best routes and timings.
b. Smart Logistics and Supply Chains
AI-driven supply chains are becoming self-learning systems. Algorithms can monitor port congestion, weather disruptions, or political instability and automatically reroute shipments. Autonomous vehicles and drones further enhance delivery speed and cost efficiency.
Global logistics firms like Maersk and DHL already use AI for predictive maintenance, route optimization, and fuel management — all of which make global trade more seamless.
c. Cross-Border Payment Automation
AI-based fintech systems enable smoother international transactions. Machine learning helps detect fraud, optimize currency conversion, and reduce transaction time. Digital banks use AI algorithms to assess risk and facilitate instant credit approvals, making it easier for small and medium enterprises (SMEs) to engage in global trade.
3. AI Empowering Emerging Economies
One of the most promising aspects of AI in global integration is its potential to level the playing field between developed and developing nations.
a. Access to Global Markets
AI-driven platforms such as Alibaba’s AI commerce tools or Amazon’s recommendation systems allow small producers from Asia, Africa, or Latin America to reach global customers efficiently. AI translates languages, automates marketing, and predicts consumer demand, enabling local entrepreneurs to compete internationally.
b. Digital Skill Development
AI-based education platforms are providing upskilling opportunities across the world. Through adaptive learning systems, even remote communities can gain technical and financial literacy. This democratization of knowledge promotes workforce integration into global value chains.
c. Agriculture and Manufacturing Uplift
In regions where agriculture and low-cost manufacturing dominate, AI tools enhance productivity. Smart sensors, predictive weather models, and AI-based quality control enable local producers to meet international standards, expanding their market access and economic integration.
4. Financial Integration through AI Innovation
The financial system forms the backbone of economic connectivity. AI is revolutionizing banking, investment, and insurance sectors by creating faster, safer, and more intelligent systems.
a. Global Digital Payments
AI powers the infrastructure behind cross-border digital payments through real-time fraud detection and transaction optimization. Tools like SWIFT GPI and RippleNet use AI to provide near-instant settlements and transparent tracking — reducing the friction of international money transfers.
b. Algorithmic Trading and Market Efficiency
Stock exchanges and investment platforms rely on AI algorithms for predictive modeling, market sentiment analysis, and risk management. These systems help maintain liquidity and transparency in international markets, aligning capital flows across countries.
c. Financial Inclusion
AI-driven mobile banking platforms such as M-Pesa in Africa or Paytm in India extend access to global financial systems for previously unbanked populations. This inclusion accelerates integration by increasing participation in international commerce and remittance flows.
5. Redefining Global Supply Chains
The pandemic and geopolitical tensions have highlighted vulnerabilities in global supply chains. AI is addressing these by introducing resilient and adaptive systems.
Predictive supply chain management: AI forecasts disruptions before they occur.
Automation of inventory control: Smart sensors and robotics balance supply-demand mismatches.
Decentralized manufacturing: AI enables localized production through 3D printing and robotics, reducing dependency on a single country or supplier.
By distributing production intelligence globally, AI ensures that integration is both efficient and sustainable. Companies can collaborate seamlessly across continents with synchronized production schedules and data-sharing platforms.
6. AI and Global Labor Market Integration
AI is not just transforming how businesses operate; it’s reshaping how people work globally.
a. Remote and Cross-Border Collaboration
AI-driven communication tools like Zoom AI Companion, Microsoft Copilot, or ChatGPT enable remote teams from different countries to collaborate effectively. Natural language processing (NLP) tools overcome linguistic barriers, promoting global teamwork.
b. AI in Talent Matching
Platforms like LinkedIn Talent Insights and Indeed AI Recruiter use machine learning to match employers and job seekers across borders. This global labor fluidity supports economic integration by ensuring that talent can flow to where it’s most needed.
c. Productivity and Skill Shift
While some jobs are being automated, AI is simultaneously creating demand for new skills in data analytics, robotics, cybersecurity, and digital marketing. Global labor mobility is increasingly based on AI literacy, encouraging educational institutions and governments to align skill frameworks internationally.
7. Policy, Governance, and Ethical Coordination
As AI-driven integration accelerates, international policy alignment becomes critical.
a. AI Regulation Frameworks
Organizations such as the OECD, EU, and UNESCO are developing AI ethics and data governance standards. Harmonizing these regulations ensures safe and fair use of AI across borders, fostering trust in international trade and data exchange.
b. Data Sharing and Security
Global data flow is the currency of AI-driven integration. Establishing secure and transparent mechanisms for cross-border data exchange is essential for maintaining economic stability and protecting privacy.
c. Collaboration between Nations
Multilateral initiatives like Global Partnership on AI (GPAI) promote research collaboration, resource sharing, and collective policymaking. This cooperative model strengthens the foundation for a globally integrated AI economy.
8. The Role of AI in Sustainable Global Growth
Economic integration today must balance profit with sustainability — and AI is central to this balance.
a. Energy Efficiency
AI optimizes energy consumption in manufacturing, logistics, and transportation. Global initiatives use AI to reduce carbon footprints while maintaining economic growth.
b. Climate Monitoring and Green Trade
AI models help predict climate patterns and assist governments in designing sustainable trade policies. International collaboration on AI-driven environmental technology promotes green integration across markets.
c. Inclusive Growth
AI enables equitable access to technology, finance, and education — reducing inequality and promoting balanced global development.
9. Challenges in AI-Driven Integration
Despite its potential, AI-driven integration faces several challenges:
Digital Divide: Unequal access to AI infrastructure widens the gap between advanced and developing nations.
Job Displacement: Automation threatens traditional employment sectors if reskilling is not prioritized.
Ethical and Data Privacy Concerns: Differing regulations across nations may hinder seamless data flow.
Algorithmic Bias: AI systems can perpetuate inequality if trained on biased data.
Addressing these issues requires a coordinated global strategy emphasizing inclusivity, transparency, and shared innovation.
10. The Road Ahead: Building a Unified AI-Enabled Economy
The next decade will witness the evolution of “AI Globalization 2.0”, where human intelligence and artificial intelligence co-develop economic ecosystems. Nations investing in AI education, digital infrastructure, and ethical frameworks will lead the global integration movement.
Partnerships between governments, corporations, and academia will create a globally interoperable AI network — a system where data, ideas, and innovations move across borders as freely as goods and capital once did.
Ultimately, AI will not just integrate economies but align human progress with technological intelligence, ensuring that globalization evolves toward shared prosperity and sustainability.
Conclusion: Intelligence as the New Currency of Integration
AI has become the central nervous system of the global economy. It drives efficiency, enhances collaboration, and democratizes opportunity. As the world becomes more interconnected through intelligent systems, economic integration will no longer depend solely on trade treaties or capital flows — it will depend on data intelligence, digital cooperation, and shared ethical values.
In essence, Artificial Intelligence is not just a tool of globalization — it is its new architect. It is redefining what it means for nations, businesses, and individuals to be connected, and guiding humanity toward a more integrated, innovative, and inclusive global economy.

A few important steps for creating robust and winning StrategiesAs the title says, I want to share knowledge & important insights into the best practices for creating robust, trustworthy and profitable trading Strategies here on TradingView.
These bits of information that my team I have gathered throughout the years and have managed to learn through mostly trial and error. Costly errors too .
Many of these points more professional traders know, however, there are some that are quite innovative for all levels of experience in my opinion. Please, feel free to correct me or add more in the comments.
There are a few strategic and tactical changes to our process that made a noticeable difference in the quality of Strategies and Indicators immediately.
Firstly and most importantly, we have all heard about it, but it is having the most data available. A good algorithm, when being built NEEDS to have as many market situations in its training data as possible. Choppy markets, uptrends, downtrends, fakeouts, manipulations - all of these are necessary for the strategy to learn the possible market conditions as much as possible and be prepared for trading on unknown data.
Many may have heard the phrase "History doesn't repeat itself but rhymes well" - you need to have the whole dictionary of price movements to be able to spot when it rhymes and act accordingly.
The TradingView Ultimate plan offers the most data in terms of historical candles and is best suited for creating robust strategies.
___
Secondly, of course, robustness tests. Your algorithm can perform amazingly on training data, but start losing immediately in real time, even if you have trained it on decades of data.
These include Monte-carlo simulations to see best and worst scenarios during the training period. Tests also include the fundamentally important out-of-sample checks . For those who aren’t familiar - this means that you should separate data into training sets and testing sets. You should train your algorithm on some data, then perform a test on unknown to the optimization process data. It's common practice to separate data as 20% training / 20% unknown / 20% training etc. to build a data set that will show how your algorithm performs on unknown to it market movements. Out of sample tests are crucial and you can never trust a strategy that has not been through them.
Walk-forward simulations are similar - you train your algorithm on X amount of data and simulate real-time price feeds and monitor how it performs. You can use the Replay function of TradingView to do walk-forward tests!
When you are doing robustness tests, we have found that a stable strategy performs around 90% similarly in terms of win rate and Sortino ratio compared to training data. The higher the correlation between training performance and out of sample performance, the more risk you can allocate to this algorithm.
___
Now lets move onto some more niche details. Markets don’t behave the same when they are trending downward and when they are trending upwards. We have found that separating parameters for optimization into two - for long and for short - independent of each other, has greatly improved performance and also stability.
Logically it is obvious when you look at market movements. In our case, with cryptocurrencies, there is a clear difference between the duration and intensity of “dumps” and “pumps”. This is normal, since the psychology of traders is different during bearish and bullish periods. Yes, introducing double the amount of parameters into an algorithm, once for long, once for short, can carry the risk of overfitting since the better the optimizer (manual or not), the better the values will be adjusted to fit training data. But if you apply the robustness tests mentioned above, you will find that performance is greatly increased by simply splitting trade logic between long and short. Same goes for indicators.
Some indicators are great for uptrends but not for downtrends. Why have conditions for short positions that include indicators that are great for longs but suck at shorting, when you can use ones that perform better in the given context?
___
Moving on - while overfitting is the main worry when making an algorithm, underoptimization as a result of fear of overfitting is a big threat too . You need to find the right balance by using robustness tests. In the beginning, we had limited access to software to test our strategies out of sample and we found out that we were underoptimizing because we were scared of overfitting, while in reality we were just holding back the performance out of fear. Whats worse is we attributed the losses in live trading to what we thought was overfitting, while in reality we were handicapping the algorithm out of fear.
___
Finally, and this relates to trading in general too, we put in place very strict rules and guidelines on what indicators to use in combination with others and what their parameter range is. We went right to theory and capped the values for each indicator to be within the predefined limits.
A simple example is MACD . Your optimizer might make a condition that includes MACD with a fast length of 200, slow length of 160 and signal length of 100. This may look amazing on backtesting and may work for a bit on live testing, but these values are FUNDAMENTALLY wrong (Investopedia, MACD). You must know what each indicator does and how it calculates its values. Having a fast length bigger than the slow one is completely backwards, but the results may show otherwise.
When you optimize any strategy, manually or with the help of a software, be mindful of the theory. Mathematical formulas don’t care about the indicator’s logic, only about the best combination of numbers to reach the goal you are optimizing for - be it % Return, Profit Factor or other.
Parabolic SAR is another one - you can optimize values like 0.267; 0.001; 0.7899 or the sort and have great performance on backtesting. This, however, is completely wrong when you look into the indicator and it’s default values (Investopedia, Parabolic SAR).
To prevent overfitting and ensure a stable profitability over time, make sure that all parameters are within their theoretical limits and constraints, ideally very close to their default values.
Thank you for reading this long essay and I hope that at least some of our experience will help you in the future. We have suffered greatly due to things like not following trading theory and leaving it all up to pure mathematical optimization, which is ignorant of the principles of the indicators. The separation between Long / Short logic was also an amazing instant improvement.
View the linked idea where we explain the psychology of risk management and suggest a few great ways to calculate and manage your risk when trading - just as important as the strategy itself!
What do you think? Do you use any of these methods; Or better ones?
Let us know in the comments.
When Generals Run and Soldiers Nap — The Market’s Odd ParadeEver seen an army march where the generals sprint ahead, but the soldiers just yawn and stay behind?
That’s exactly what’s happening in the U.S. futures battlefield right now.
The ES, NQ, and YM — our large-cap “generals” — opened the week above their prior highs, looking ready for victory speeches. But the RTY, representing small caps, is still lagging like it hit the snooze button.
The Breadth Problem
Healthy rallies need everyone on board. When small caps don’t join the charge, it’s like running a marathon with only one leg — you might move forward, but not for long.
That’s why this gap between the big guys and the small ones is called bearish divergence — momentum without muscle.
How Deep Could It Go?
Under the surface, liquidity pockets (UFO supports) show the “landing zones” below price:
ES: ~5% lower
NQ: ~6% lower
YM: ~9% lower
RTY: ~14% lower (!)
Translation: if the market trips, the generals may bruise a knee — but the soldiers could roll down the hill.
Tick, Margin, and Scale
CME index futures come in two flavors — E-minis for the pros, Micro E-minis for precision control:
S&P 500 (ES/MES): tick 0.25 → $12.50 / $1.25; margin ≈ $21K / $2.1K
Nasdaq 100 (NQ/MNQ): tick 0.25 → $5 / $0.50; margin ≈ $30K / $3K
Dow Jones (YM/MYM): tick 1 → $5 / $0.50; margin ≈ $13K / $1.3K
Russell 2000 (RTY/M2K): tick 0.10 → $5 / $0.50; margin ≈ $9K / $0.9K
(Approximate numbers, educational only.)
The Lesson
Breadth divergences don’t “predict” the end of the rally — they just whisper: “Careful, this parade’s out of sync.”
So before chasing the next breakout, remember:
even the best generals can’t win a war if their soldiers stay in camp.
Want More Depth?
If you’d like to go deeper into the building blocks of trading, check out our From Mystery to Mastery trilogy, three cornerstone articles that complement this one:
🔗 From Mystery to Mastery: Trading Essentials
🔗 From Mystery to Mastery: Futures Explained
🔗 From Mystery to Mastery: Options Explained
When charting futures, the data provided could be delayed. Traders working with the ticker symbols discussed in this idea may prefer to use CME Group real-time data plan on TradingView: www.tradingview.com - This consideration is particularly important for shorter-term traders, whereas it may be less critical for those focused on longer-term trading strategies.
General Disclaimer:
The trade ideas presented herein are solely for illustrative purposes forming a part of a case study intended to demonstrate key principles in risk management within the context of the specific market scenarios discussed. These ideas are not to be interpreted as investment recommendations or financial advice. They do not endorse or promote any specific trading strategies, financial products, or services. The information provided is based on data believed to be reliable; however, its accuracy or completeness cannot be guaranteed. Trading in financial markets involves risks, including the potential loss of principal. Each individual should conduct their own research and consult with professional financial advisors before making any investment decisions. The author or publisher of this content bears no responsibility for any actions taken based on the information provided or for any resultant financial or other losses.
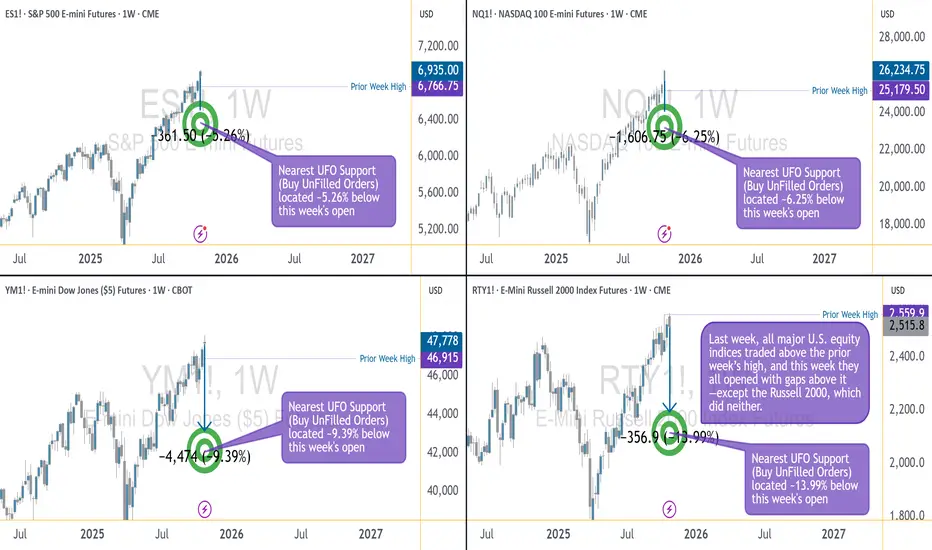
Position Sizing: The Math That Separates Winners from LosersMost traders blow up their accounts not because of bad entries, but because of terrible position sizing. You can have a 60% win rate and still go broke if you risk too much per trade.
The 1-2% Rule (And Why It Works)
Never risk more than 1-2% of your account on a single trade.
Here's why this matters:
Risk 2% per trade → You can survive 50 consecutive losses
Risk 10% per trade → 10 losses = -65% drawdown (you need +186% just to break even)
Risk 20% per trade → 5 losses = game over
The Position Sizing Formula
Position Size = (Account Size × Risk %) / (Entry Price - Stop Loss)
Real Example:
Account: $10,000
Risk per trade: 2% = $200
Entry: $50
Stop loss: $48
Risk per share: $2
Position Size = $200 / $2 = 100 shares
If stopped out → You lose exactly $200 (2%)
If price hits $54 → You make $400 (4% gain, 2:1 R/R)
Different Risk Frameworks
Conservative (1% risk)
Best for: Beginners, volatile markets, high-frequency trading
Survivability: Can take 100+ losses
Growth: Slower but steady
Moderate (2% risk)
Best for: Experienced traders, tested strategies
Survivability: 50 consecutive losses
Growth: Balanced risk/reward
Aggressive (3-5% risk)
Best for: High conviction setups, smaller accounts trying to grow
Survivability: 20-33 losses
Growth: Faster but dangerous
Warning: Never go above 5% unless you're gambling, not trading.
The Kelly Criterion (Advanced)
For traders with significant backtested data:
Kelly % = Win Rate -
Example:
Win rate: 55%
Avg win: $300
Avg loss: $200
Win/Loss ratio: 1.5
Kelly % = 0.55 - = 0.55 - 0.30 = 25%
But use 1/4 Kelly (6.25%) or 1/2 Kelly (12.5%) - Full Kelly is too aggressive for real markets.
Common Position Sizing Mistakes
❌ Revenge trading larger after a loss
✅ Keep position size constant based on current account value
❌ Risking the same dollar amount regardless of setup quality
✅ Risk 0.5% on B-setups, 2% on A+ setups
❌ Ignoring correlation risk
✅ If you have 5 tech stocks open, you're really risking 10% on one sector
❌ Not adjusting after drawdowns
✅ If account drops 20%, your 2% risk should recalculate from new balance
The Volatility Adjustment
In high volatility (VIX > 30):
Cut position sizes by 30-50%
Widen stops or risk less per trade
Market can gap past your stops
In low volatility (VIX < 15):
Can use normal position sizing
Tighter stops possible
More predictable price action
My Personal Framework
I use a tiered approach:
High conviction setups (A+): 2% risk
Good setups (A): 1.5% risk
Decent setups (B): 1% risk
Experimental/learning: 0.5% risk
Maximum combined risk: Never more than 6% across all open positions.
The Bottom Line
Position sizing is the only thing you have complete control over in trading. You can't control:
Where price goes
Market volatility
News events
But you CAN control how much you risk.
The traders who survive long enough to get good are the ones who master position sizing first.
What's your current risk per trade? Drop it in the comments. If it's above 5%, we need to talk.
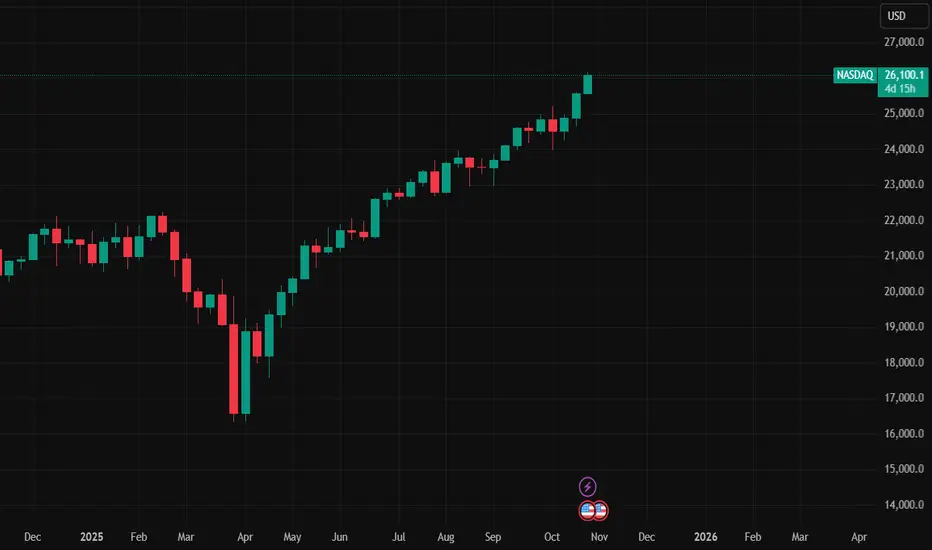
The Power Play Between Derivatives and HedgingIntroduction
In the complex and volatile world of financial markets, risk is an ever-present companion. Investors, corporations, and governments alike constantly seek ways to manage and mitigate these uncertainties. Two powerful instruments that dominate the modern financial landscape are derivatives and hedging. Both are closely interconnected—derivatives are the tools, while hedging is often the strategy. Together, they form a dynamic power play that influences global markets, stabilizes corporate earnings, and occasionally, when misused, leads to financial turmoil. Understanding the balance between these forces is essential for grasping how financial markets truly operate.
Understanding Derivatives: The Financial Instruments of Leverage
Derivatives are financial contracts whose value is derived from an underlying asset, index, rate, or event. These underlying assets can range from stocks, bonds, commodities, and interest rates to currencies and even weather conditions. The essence of a derivative lies in its dependency—its price moves in response to the value of something else.
Types of Derivatives
Futures Contracts
Futures are standardized agreements traded on exchanges to buy or sell an asset at a predetermined price and date in the future. They are widely used in commodities, indices, and currencies. For example, an airline company might use crude oil futures to lock in future fuel prices.
Options Contracts
Options give the holder the right, but not the obligation, to buy (call) or sell (put) an asset at a specific price within a specified period. Options are extremely popular among traders and institutions because they offer flexibility in hedging and speculation.
Swaps
Swaps involve exchanging one stream of cash flows for another. Common types include interest rate swaps and currency swaps. For instance, a company with variable-rate debt may enter into a swap to fix its interest payments and stabilize costs.
Forwards
Forwards are customized over-the-counter (OTC) agreements similar to futures but not traded on exchanges. They are tailored for specific needs, making them highly flexible yet riskier due to counterparty exposure.
Purpose of Derivatives
Derivatives serve multiple purposes:
Risk Management: They allow investors and corporations to hedge against adverse price movements.
Speculation: Traders use derivatives to profit from market volatility or price predictions.
Arbitrage: Derivatives help exploit price differences in markets to earn risk-free profits.
Leverage: A small amount of capital can control large positions, magnifying both gains and losses.
In essence, derivatives amplify financial capabilities, offering both protection and peril depending on how they are used.
The Art of Hedging: Controlling the Uncontrollable
Hedging is a strategy designed to reduce or eliminate the risk of adverse price movements in assets. It’s akin to buying insurance against potential financial loss. A hedge doesn’t necessarily eliminate risk—it transfers or mitigates it.
How Hedging Works
Suppose a wheat farmer is concerned that prices might fall by harvest time. By selling wheat futures now, the farmer locks in a price and ensures predictable income regardless of future market fluctuations. Similarly, an importer concerned about currency appreciation may use forward contracts to secure a fixed exchange rate.
Hedging typically involves taking an offsetting position in a related asset or derivative to counterbalance potential losses. If the market moves unfavorably in one position, the gain in the hedge offsets the loss, thereby stabilizing overall performance.
Common Hedging Techniques
Forward and Futures Hedging – Locking in prices today for future transactions.
Options Hedging – Purchasing options to protect against downside risk while retaining upside potential.
Swap Hedging – Managing exposure to interest rates or currency fluctuations.
Portfolio Diversification – Spreading investments across asset classes to reduce overall volatility.
Hedging, in short, is about stability and foresight—it prioritizes security over speculative gain.
Derivatives as the Engine of Hedging
The relationship between derivatives and hedging is symbiotic. Derivatives enable hedging strategies, providing the mechanism to offset risk exposure across markets. Without derivatives, hedging would be limited to traditional methods like asset diversification or insurance, which are often slower, less efficient, and more costly.
For instance:
Commodity producers use futures and options to stabilize revenues.
Exporters and importers hedge against foreign exchange risks through currency forwards and swaps.
Investors protect portfolios from market downturns using index options or equity futures.
Banks manage interest rate risk using interest rate swaps and caps.
This interplay creates a more stable financial ecosystem—when used prudently. Derivatives make markets more liquid and efficient, allowing participants to distribute risk where it can best be managed.
The Power and Peril: When Derivatives Overwhelm Hedging
While derivatives are powerful risk management tools, their misuse can amplify market instability. The same leverage that makes them effective hedging instruments can also turn them into speculative weapons.
Historical Examples of Misuse
Barings Bank Collapse (1995)
A single trader, Nick Leeson, made unauthorized derivatives trades in the Singapore futures market, resulting in losses exceeding £800 million. His speculation, disguised as hedging, bankrupted one of Britain’s oldest banks.
Long-Term Capital Management (LTCM) Crisis (1998)
LTCM used highly leveraged derivative positions to exploit small market inefficiencies. When markets turned volatile, the fund’s positions spiraled out of control, threatening the global financial system.
Global Financial Crisis (2008)
The widespread use of credit default swaps (CDS) on mortgage-backed securities created massive systemic risk. What began as a hedging tool evolved into a speculative bubble, culminating in a global meltdown.
These cases highlight that derivatives without proper risk control can undermine financial stability. The thin line between hedging and speculation defines whether derivatives act as a shield or a sword.
Corporate Hedging Strategies: Real-World Applications
Corporations across sectors rely heavily on derivative-based hedging to protect against market uncertainties.
1. Currency Risk Management
Multinational corporations face constant foreign exchange volatility. For instance, Infosys and Tata Consultancy Services (TCS) use currency forwards and options to manage rupee-dollar exchange rate exposure. These hedges protect profit margins despite currency fluctuations.
2. Commodity Price Protection
Oil producers, airlines, and food companies frequently hedge input costs. Southwest Airlines, for example, famously used long-term crude oil futures to secure low fuel prices during the 2000s, giving it a massive competitive advantage.
3. Interest Rate Risk Control
Financial institutions use interest rate swaps to stabilize returns. A bank holding floating-rate loans may enter into a swap to receive fixed payments, shielding itself from rising rates.
4. Portfolio Risk Hedging
Institutional investors employ derivatives like put options on stock indices to guard against market downturns. These hedges act as “insurance policies” for portfolios, especially during economic uncertainty.
In these scenarios, derivatives serve as precision tools that allow corporations to forecast and control financial outcomes.
Regulatory Oversight and Risk Management
Given the complexity and potential risks, global regulators have tightened oversight of derivatives markets. The Dodd-Frank Act (2010) in the United States and similar regulations in Europe and Asia mandate greater transparency and reporting for derivative trades.
Key Regulatory Measures:
Central Clearing: Standardized derivatives must pass through clearinghouses to reduce counterparty risk.
Reporting Requirements: All trades must be recorded in trade repositories to improve market transparency.
Margin Requirements: Participants must post collateral to prevent excessive leverage.
Risk Management Standards: Firms must establish internal controls and limits on derivative exposures.
These measures aim to restore balance—allowing derivatives to support hedging rather than fuel speculation.
Technological Influence: Algorithmic and AI-Driven Hedging
In the digital era, technology has revolutionized derivative trading and hedging strategies. Algorithmic models and artificial intelligence (AI) now play key roles in managing risk dynamically.
AI-Based Risk Prediction: Machine learning models analyze real-time market data to anticipate price movements and adjust hedges instantly.
Automated Hedging Systems: Advanced algorithms execute complex hedging strategies across multiple asset classes simultaneously.
Blockchain and Smart Contracts: These technologies enhance transparency and efficiency in derivative settlements.
Such innovations have made hedging more precise, faster, and cost-effective—but also more dependent on data integrity and cybersecurity.
The Strategic Balance: Hedging vs. Speculation
The power play between derivatives and hedging ultimately lies in their dual nature. The same instrument can serve either purpose—risk mitigation or risk creation—depending on how it’s used.
Hedging Focus: The objective is protection. Gains are secondary; stability is paramount.
Speculative Focus: The objective is profit. Risk-taking is intentional, often amplified by leverage.
A mature financial system depends on equilibrium between these forces. Without hedgers, markets would lack stability. Without speculators, liquidity would vanish. Together, they form a dynamic yet delicate ecosystem that drives modern finance.
Future Outlook: Evolving Role of Derivatives and Hedging
As global markets grow more interconnected and digitalized, the role of derivatives and hedging will continue to expand.
Green Derivatives: Instruments linked to carbon credits and ESG benchmarks are emerging, helping companies hedge sustainability risks.
Crypto Derivatives: With digital assets gaining traction, crypto futures and options are reshaping speculative and hedging opportunities.
AI-Driven Risk Management: Predictive analytics will make hedging more adaptive to real-time market conditions.
Decentralized Finance (DeFi): Blockchain-based derivative platforms are redefining transparency and access.
The future promises both efficiency and complexity—requiring even stronger governance and risk literacy.
Conclusion
The power play between derivatives and hedging defines the heartbeat of modern finance. Derivatives, with their vast potential, empower investors and corporations to manage risk, enhance returns, and navigate uncertainty. Hedging, on the other hand, channels this power responsibly, ensuring stability amid volatility. Yet, when derivatives shift from tools of protection to instruments of speculation, the balance of power tilts dangerously.
Ultimately, the key lies not in choosing between derivatives and hedging, but in mastering their synergy. When wielded wisely, they create a resilient, efficient, and innovative financial system capable of weathering the storms of global uncertainty.
Evolution of Corporate Influence in World TradeIntroduction
The evolution of corporate influence in world trade represents one of the most transformative developments in global economic history. From the early trading companies of the 17th century to today’s multinational conglomerates and digital giants, corporations have continuously reshaped global commerce, policy, and power dynamics. Their role has expanded far beyond mere trade intermediaries — corporations now shape labor markets, technological innovation, geopolitics, environmental policy, and international relations. This essay explores the historical evolution of corporate power, its mechanisms of influence, and the profound implications it has for global trade and governance.
1. The Early Foundations: Mercantilism and Trading Empires
The Rise of Charter Companies
The earliest forms of corporate influence in global trade emerged during the age of mercantilism (16th to 18th centuries). European powers such as Britain, the Netherlands, Portugal, and Spain established state-chartered trading companies to explore and exploit overseas markets.
Notable examples include:
The British East India Company (1600)
The Dutch East India Company (VOC, 1602)
The French East India Company (1664)
These companies enjoyed monopolies granted by royal charter, allowing them to act as quasi-sovereign entities. They could wage wars, negotiate treaties, mint currency, and establish colonies — effectively merging commerce with imperialism.
Corporate Power and Colonial Expansion
Such corporations were instrumental in establishing global trade networks in spices, silk, tea, and other commodities. However, their influence went beyond trade: they facilitated colonial expansion, exploited local populations, and restructured indigenous economies. The intertwining of corporate and state interests laid the foundation for what would later become the modern model of corporate globalization.
2. Industrialization and the Birth of Modern Corporations
Industrial Revolution and Capital Formation
The Industrial Revolution in the 18th and 19th centuries marked the birth of the modern corporation. With advancements in steam power, mechanization, and transport, trade expanded rapidly. To finance large-scale industrial projects, the joint-stock company model emerged, enabling shared ownership and limited liability — key features that made large-scale enterprises sustainable.
Expansion of International Trade
Corporations such as Standard Oil, U.S. Steel, and Siemens became pioneers of industrial capitalism. They drove innovation, mass production, and international competition. Global trade became increasingly structured around industrial goods, rather than raw materials alone. These firms began to establish foreign subsidiaries, export products, and influence global commodity prices.
Corporate-State Symbiosis
Governments supported corporate expansion through trade agreements, colonial protection, and infrastructure development (railways, ports, telegraph lines). This partnership between corporations and states reinforced the idea that corporate success was synonymous with national economic strength.
3. The Early 20th Century: Corporations and Global Power
Monopolies, Trusts, and Regulation
By the early 20th century, corporate concentration led to monopolies and trusts that controlled entire industries. For instance, Standard Oil dominated the petroleum industry, while U.S. Steel shaped the steel market. Such dominance triggered anti-trust movements and regulatory reforms, such as the Sherman Antitrust Act (1890) in the United States, aiming to curb excessive corporate power.
Corporations in Global Conflict
During both World Wars, corporations became strategic actors. Industrial firms produced weapons, vehicles, and logistics for wartime economies. Post-war reconstruction further expanded corporate reach, especially under U.S. leadership. The Marshall Plan (1948), for example, not only rebuilt Europe but also created markets for American corporations, embedding them into global trade networks.
4. The Post-War Era: Multinational Expansion
The Bretton Woods System
After World War II, the establishment of institutions like the International Monetary Fund (IMF), World Bank, and General Agreement on Tariffs and Trade (GATT) provided a stable framework for global commerce. Corporations flourished under this system, expanding operations across borders with relative security.
The Rise of Multinational Corporations (MNCs)
From the 1950s onward, multinational corporations became the dominant players in world trade. Companies like Coca-Cola, IBM, Unilever, and General Motors established production and distribution networks worldwide. They pursued foreign direct investment (FDI) to gain access to new markets, labor, and resources.
Technology and Supply Chains
Technological advancements in communication, shipping, and computing revolutionized corporate operations. The emergence of global supply chains allowed firms to outsource production, reduce costs, and manage logistics more efficiently. Trade became not just about exports and imports but about cross-border production networks — the hallmark of modern globalization.
5. The Late 20th Century: Globalization and Deregulation
Neoliberal Policies and Market Liberalization
The 1980s and 1990s marked a new era of neoliberal globalization. Policies promoted by the World Trade Organization (WTO) and international financial institutions emphasized free trade, privatization, and deregulation. This environment enabled corporations to expand aggressively into emerging markets.
Corporate Mergers and Financialization
Massive mergers and acquisitions consolidated corporate power further. Financial markets became increasingly integrated, allowing corporations to access global capital easily. Corporations not only produced goods but also engaged in complex financial activities — hedging, speculation, and portfolio diversification — amplifying their influence over global capital flows.
The Rise of Emerging Market Corporations
During this period, corporations from emerging economies — such as Samsung (South Korea), Huawei (China), and Tata Group (India) — began to challenge Western dominance. These firms leveraged domestic growth and international partnerships to expand their footprint in world trade.
6. The Digital Age: Tech Giants and Data-Driven Trade
The Internet Revolution
The 21st century has been defined by the rise of the digital economy. Companies like Google, Amazon, Apple, Meta, and Microsoft dominate global commerce through data, platforms, and digital infrastructure. These corporations transcend traditional trade barriers by operating in cyberspace, reshaping consumer behavior and global business models.
E-Commerce and Digital Trade
Digital platforms have revolutionized global trade by enabling small businesses to access international markets with minimal cost. However, large corporations still dominate these ecosystems, often setting rules on pricing, logistics, and data ownership. Amazon’s marketplace, for example, is both a facilitator and a competitor to millions of sellers worldwide.
Data as a Trade Commodity
In the digital era, data has become a new form of economic power. Tech corporations collect, analyze, and monetize vast quantities of consumer information, giving them unprecedented control over market trends, consumer preferences, and even policymaking. The debate over data sovereignty and digital governance illustrates the growing intersection of corporate power and national security.
7. Corporate Influence on Global Policy and Governance
Lobbying and Policy Shaping
Corporations exert significant influence on trade policy through lobbying, think tanks, and participation in international organizations. They shape regulatory standards on intellectual property, environmental protection, and taxation. For instance, global pharmaceutical companies have heavily influenced World Trade Organization (WTO) rules on patent protection.
Public-Private Partnerships (PPPs)
Corporations increasingly collaborate with governments and international institutions on infrastructure, health, and sustainability initiatives. While such partnerships can drive progress, they also blur the lines between public interest and private profit.
Corporate Social Responsibility (CSR)
Amid growing scrutiny, corporations have embraced CSR and ESG (Environmental, Social, and Governance) standards. These frameworks aim to align business goals with global development priorities such as the UN Sustainable Development Goals (SDGs). However, critics argue that CSR is often used as a branding tool rather than a commitment to systemic change.
8. Challenges and Criticisms of Corporate Power
Economic Inequality and Market Dominance
While corporations drive innovation and growth, they also exacerbate economic inequality. Market monopolization, labor exploitation, and wealth concentration undermine equitable development. For instance, tech giants control entire sectors, stifling competition and small business growth.
Environmental Impact
Corporations are major contributors to global environmental degradation, from deforestation to carbon emissions. Although sustainability initiatives have gained traction, corporate-driven globalization continues to prioritize profit over ecological balance.
Tax Avoidance and Regulation Gaps
Through complex financial structures and tax havens, many multinational corporations minimize their tax liabilities. This erodes national revenues, limiting the capacity of governments to invest in public welfare.
9. The Future of Corporate Influence
Sustainability and Green Trade
Corporations are now under pressure to lead the transition to a green economy. Renewable energy firms, electric vehicle manufacturers, and sustainable agriculture companies are emerging as global trade leaders. Future corporate influence will depend on how effectively they balance profit with environmental and social responsibility.
Decentralization and Digital Empowerment
The advent of blockchain, Web3, and decentralized finance (DeFi) may reduce centralized corporate power. These technologies allow peer-to-peer trade, potentially redistributing influence from giant corporations to individuals and small enterprises.
Geopolitical Realignment
The rise of China’s corporate champions (e.g., Alibaba, Tencent, BYD) and Western tech dominance is shaping a new bipolar corporate world order. Geoeconomic competition between these blocs will define the next phase of global trade, where corporations act as proxies for national power.
Conclusion
The evolution of corporate influence in world trade reflects a continuous expansion of economic power and global reach. From colonial trading monopolies to multinational giants and digital empires, corporations have been both engines of prosperity and agents of inequality. Their ability to innovate, integrate markets, and shape global policy has transformed the world economy, but also raised pressing questions about accountability, fairness, and sustainability.
In the coming decades, corporate influence will remain a defining force — but the challenge for global governance lies in ensuring that this influence serves not just shareholders, but society and the planet as a whole.
Digital Assets and Central Bank Digital Currencies (CBDCs)Introduction
The digital revolution has transformed nearly every aspect of modern life — from communication to commerce — and finance is no exception. One of the most profound shifts underway in the global financial landscape is the emergence of digital assets and Central Bank Digital Currencies (CBDCs). These innovations represent the next phase of money’s evolution, where technology and monetary policy converge to redefine how value is stored, transferred, and governed.
While digital assets like cryptocurrencies have emerged from the private sector and decentralized communities, CBDCs represent the formal entry of sovereign governments into the digital money ecosystem. Together, they are reshaping the foundations of the global financial system. This essay explores the nature, development, benefits, risks, and future implications of digital assets and CBDCs, highlighting their distinct roles and their potential to coexist in the financial architecture of the 21st century.
Understanding Digital Assets
Digital assets are electronic representations of value, ownership, or rights that are stored and transacted using digital systems, often based on blockchain or distributed ledger technology (DLT). These assets can represent various forms of value — including cryptocurrencies, security tokens, non-fungible tokens (NFTs), and stablecoins.
The key characteristics of digital assets include:
Digitization: Unlike traditional assets that require physical representation (such as cash or gold), digital assets exist purely in digital form.
Blockchain Technology: Many digital assets operate on decentralized blockchain networks, ensuring transparency, security, and immutability.
Programmability: Digital assets can include smart contracts, allowing automated execution of financial agreements without intermediaries.
Decentralization: Most cryptocurrencies operate without central authorities, relying instead on peer-to-peer verification mechanisms.
Among digital assets, Bitcoin — launched in 2009 — remains the most prominent. It introduced the idea of a decentralized currency not controlled by any government or institution. Following Bitcoin’s success, thousands of other cryptocurrencies emerged, each with unique features and purposes.
Types of Digital Assets
Digital assets can be broadly classified into several categories:
Cryptocurrencies:
Cryptocurrencies like Bitcoin (BTC) and Ethereum (ETH) function as decentralized digital money. They rely on blockchain networks to verify transactions and maintain transparency. Their value is typically determined by market supply and demand rather than by central banks.
Stablecoins:
Stablecoins are designed to minimize price volatility by being pegged to traditional assets like the U.S. dollar, gold, or a basket of currencies. Examples include Tether (USDT) and USD Coin (USDC). They bridge the gap between fiat currency stability and blockchain efficiency.
Security Tokens:
These represent ownership in real-world assets such as stocks, real estate, or bonds, but are traded digitally. Security tokens bring traditional financial instruments into the blockchain ecosystem, offering greater liquidity and accessibility.
Utility Tokens:
These grant access to specific blockchain-based platforms or services. For example, using BNB to pay for transaction fees on Binance.
Non-Fungible Tokens (NFTs):
NFTs represent unique digital items — such as art, collectibles, or intellectual property — that cannot be exchanged on a one-to-one basis like regular tokens.
Central Bank Digital Currencies (CBDCs): Concept and Design
While cryptocurrencies are decentralized and privately created, Central Bank Digital Currencies (CBDCs) are government-issued digital currencies representing a nation’s official currency in electronic form. A CBDC is essentially a digital version of fiat money — issued, regulated, and backed by a country’s central bank.
CBDCs aim to combine the efficiency and innovation of digital payment systems with the stability and trust of traditional central banking. Unlike private cryptocurrencies, CBDCs are legal tender, meaning they must be accepted for all debts, public and private, within the issuing country.
Types of CBDCs
CBDCs can be categorized into two primary forms:
Retail CBDCs:
Intended for use by the general public for everyday transactions — such as payments, savings, and remittances. They function much like digital cash.
Wholesale CBDCs:
Designed for financial institutions and interbank settlements, enhancing efficiency in large-scale payments and cross-border transfers.
Technological Architecture
CBDCs can adopt either a centralized ledger system or a distributed ledger (blockchain).
Centralized systems allow the central bank to maintain complete control over issuance and transactions.
Distributed ledger systems increase transparency and resilience but require sophisticated cybersecurity measures.
Some countries may adopt hybrid models, combining the advantages of both systems to ensure security, privacy, and efficiency.
The Rise of CBDCs: Global Landscape
CBDC development has accelerated rapidly. According to the Bank for International Settlements (BIS), over 130 countries, representing more than 95% of global GDP, are exploring or developing CBDCs.
Leading CBDC Projects
China: The Digital Yuan (e-CNY) is one of the most advanced CBDCs, currently in large-scale pilot testing across major cities.
Europe: The European Central Bank (ECB) is progressing toward launching the Digital Euro to enhance payment efficiency and sovereignty.
India: The Reserve Bank of India (RBI) introduced the e₹ (Digital Rupee) pilot program for wholesale and retail use, focusing on reducing cash dependency.
Bahamas: The Sand Dollar became the world’s first fully operational CBDC in 2020, designed to improve financial inclusion.
Nigeria: The eNaira aims to facilitate faster payments and expand access to digital financial services.
This global momentum reflects the recognition that CBDCs could transform not only domestic payments but also international trade and monetary policy transmission.
Benefits of Digital Assets and CBDCs
1. Financial Inclusion
Digital assets and CBDCs can extend financial services to the unbanked population, particularly in developing countries. With just a smartphone, individuals can access a digital wallet, enabling participation in the economy without needing a traditional bank account.
2. Efficiency and Cost Reduction
Digital currencies streamline payment systems by eliminating intermediaries, reducing transaction times, and lowering costs for both domestic and cross-border payments.
3. Transparency and Security
Blockchain technology provides immutable and traceable records of transactions, reducing fraud and enhancing trust. Governments can track illicit financial activities more effectively.
4. Monetary Policy Innovation
CBDCs offer central banks greater control over monetary policy. They can enable direct stimulus payments, programmable money for targeted spending, and more efficient interest rate transmission.
5. Enhanced Cross-Border Transactions
CBDCs and stablecoins could revolutionize global trade settlements by making cross-border payments faster, cheaper, and more transparent than traditional systems like SWIFT.
6. Reduction in Cash Handling
The digitization of money reduces the costs and logistical challenges of printing, transporting, and securing physical currency.
Challenges and Risks
Despite their potential, digital assets and CBDCs face significant hurdles:
1. Privacy Concerns
CBDCs could give governments access to vast amounts of personal financial data. Balancing transparency and individual privacy is a critical challenge.
2. Cybersecurity Risks
Digital currencies are susceptible to hacking, data breaches, and technical failures. Ensuring robust cybersecurity infrastructure is essential.
3. Financial Stability Risks
The widespread adoption of digital currencies could disrupt traditional banking systems by reducing deposits, affecting banks’ ability to lend.
4. Technological Infrastructure
Developing and maintaining secure digital ecosystems requires significant investment, especially in developing countries with limited digital infrastructure.
5. Interoperability
Without global standards, different CBDCs may not easily interact with one another, limiting their effectiveness in international trade.
6. Regulatory Uncertainty
The evolving regulatory environment for digital assets creates uncertainty for investors and institutions. Clear and consistent regulations are necessary to foster confidence.
CBDCs vs. Cryptocurrencies
While both CBDCs and cryptocurrencies exist digitally, their core philosophies diverge sharply.
Feature Cryptocurrencies CBDCs
Issuer Private or decentralized networks Central banks
Control Decentralized Centralized
Legal Tender No Yes
Volatility High Stable
Transparency Public blockchain Permissioned or restricted access
Purpose Alternative to traditional money Digital evolution of existing money
CBDCs may eventually coexist with cryptocurrencies, serving different purposes — CBDCs for stable, regulated payments and crypto assets for investment, innovation, or decentralized finance (DeFi).
Digital Assets and CBDCs: Impact on the Global Economy
The integration of digital currencies is expected to reshape global finance in several ways:
Redefining the Role of Banks:
Commercial banks might face reduced deposit bases if individuals hold CBDCs directly with central banks. This could alter the structure of credit markets and financial intermediation.
Enhancing Cross-Border Trade:
CBDCs can simplify foreign exchange and international remittances, potentially bypassing traditional intermediaries and reducing transaction times from days to seconds.
Geopolitical Influence:
Countries pioneering CBDC technology could gain strategic advantages in global finance. For example, China’s Digital Yuan could challenge the dominance of the U.S. dollar in international trade.
Acceleration of De-dollarization:
CBDCs could support the trend of de-dollarization by promoting local currency usage in international settlements, reducing dependence on the U.S. dollar.
Innovation in Financial Services:
The programmable nature of digital currencies can foster innovation in areas like automated taxation, welfare distribution, and smart contracts.
The Road Ahead: The Future of Digital Finance
The evolution toward a fully digital monetary ecosystem appears inevitable. However, achieving a balanced system that combines innovation, inclusion, and stability will require global cooperation.
Central banks, regulators, and private innovators must collaborate to establish interoperability frameworks, cybersecurity standards, and data privacy protections. Moreover, education and digital literacy will be critical to ensure equitable access to these new financial tools.
In the long run, the coexistence of digital assets, CBDCs, and traditional money will likely define a hybrid financial ecosystem — one that blends decentralization and regulation, efficiency and security, innovation and oversight.
Conclusion
Digital assets and Central Bank Digital Currencies (CBDCs) are more than technological innovations; they represent a paradigm shift in how value circulates across the globe. Digital assets, driven by decentralization and market innovation, have democratized finance and expanded access to wealth creation. Meanwhile, CBDCs offer the potential to modernize monetary systems, improve payment efficiency, and strengthen financial sovereignty.
As we move further into the digital era, the challenge lies not in choosing between these forms of money but in integrating them responsibly. The future of global finance will depend on striking the right balance between innovation and regulation, ensuring that digital currencies enhance — rather than disrupt — global financial stability. The next decade will likely witness a harmonized system where both private digital assets and public CBDCs coexist, shaping the foundation of a more inclusive, transparent, and efficient financial world.

ESG and the Sustainable Investing Revolution1. Understanding ESG Investing
ESG investing is the practice of incorporating environmental, social, and governance factors into investment decisions, alongside traditional financial metrics. The idea is that companies that are responsible stewards of resources, communities, and governance are more likely to deliver sustainable returns over time.
Environmental factors examine how a company impacts nature — such as its carbon footprint, energy efficiency, waste management, and use of renewable resources.
Social factors focus on human capital issues like employee welfare, diversity, community engagement, and respect for human rights.
Governance factors assess corporate ethics, leadership structure, executive pay, transparency, and shareholder rights.
ESG investing doesn’t reject profitability; instead, it broadens the definition of value creation. It recognizes that environmental degradation, social inequality, and poor governance can ultimately undermine financial performance. Hence, ESG acts as a risk management framework that identifies both threats and opportunities.
2. The Historical Evolution of Sustainable Investing
The roots of sustainable investing can be traced back centuries, when religious and ethical groups avoided investing in “sin stocks” such as tobacco, alcohol, or weapons. However, modern ESG investing began to take shape in the 1960s and 1970s, coinciding with rising environmental awareness and civil rights movements.
The Socially Responsible Investing (SRI) movement of the 1980s and 1990s laid the foundation for ESG, as investors began screening out companies with unethical practices. The 21st century saw the formalization of ESG frameworks, with key milestones such as:
2004: The United Nations launched the “Who Cares Wins” initiative, coining the term ESG.
2006: The UN Principles for Responsible Investment (UN PRI) were established, encouraging investors to integrate ESG principles.
2015: The Paris Agreement and UN Sustainable Development Goals (SDGs) set global sustainability targets.
2020s: ESG became mainstream, with trillions of dollars flowing into sustainable funds.
Today, ESG investing is no longer optional; it is an expectation from institutional investors, regulators, and consumers alike.
3. The Drivers Behind the ESG Revolution
Several powerful forces have propelled the ESG revolution forward:
a. Climate Change and Environmental Risks
The increasing frequency of extreme weather events, global warming, and biodiversity loss have made climate risks financially material. Companies that fail to adapt to environmental realities face supply chain disruptions, regulatory fines, and reputational damage. Investors now view climate resilience as a critical factor in long-term valuation.
b. Regulatory and Policy Changes
Governments and financial regulators worldwide have introduced sustainability disclosure requirements. The European Union’s Sustainable Finance Disclosure Regulation (SFDR), India’s Business Responsibility and Sustainability Reporting (BRSR) framework, and U.S. SEC’s climate risk proposals compel companies and funds to be transparent about their ESG performance.
c. Changing Consumer and Investor Preferences
Millennials and Gen Z investors, who prioritize social and environmental impact, are driving demand for ESG products. Similarly, consumers are favoring brands that demonstrate corporate responsibility, pushing companies toward sustainable practices.
d. Technological Advancements
Big data, artificial intelligence, and blockchain technologies have improved ESG measurement, reporting, and transparency. For instance, satellite imagery helps track deforestation, while blockchain verifies supply chain ethics.
e. Corporate Accountability
The rise of shareholder activism and public scrutiny has made it harder for corporations to ignore ESG concerns. Shareholders are voting for climate resolutions, demanding diversity on boards, and insisting on ethical governance.
4. ESG Investment Strategies
ESG investing is not a single approach but a spectrum of strategies tailored to investor goals and risk appetite. The main strategies include:
a. Negative Screening
Excluding industries or companies that fail ESG criteria — such as fossil fuels, weapons, or tobacco — from portfolios. This traditional SRI approach aligns investments with ethical principles.
b. Positive Screening
Selecting companies that perform better than peers on ESG metrics. For example, choosing renewable energy firms over oil producers.
c. ESG Integration
Embedding ESG considerations into fundamental analysis alongside financial data. This approach seeks to identify ESG risks and opportunities that may affect long-term returns.
d. Thematic Investing
Focusing on specific sustainability themes, such as clean energy, electric vehicles, gender equality, or water conservation.
e. Impact Investing
Investing directly in projects or enterprises that generate measurable social and environmental benefits, alongside financial returns — such as microfinance, green bonds, or sustainable infrastructure.
f. Shareholder Advocacy
Using ownership rights to influence corporate behavior through voting, dialogue, and engagement.
5. ESG Metrics and Reporting Challenges
While ESG investing has grown rapidly, one major challenge remains: standardization. There is no single global framework for ESG reporting, leading to inconsistencies and “greenwashing.”
Several frameworks attempt to address this issue:
Global Reporting Initiative (GRI)
Sustainability Accounting Standards Board (SASB)
Task Force on Climate-related Financial Disclosures (TCFD)
International Sustainability Standards Board (ISSB)
Despite progress, ESG ratings can still vary widely between providers. A company rated “AAA” by one agency might receive a lower rating from another, reflecting different methodologies. Investors must therefore exercise due diligence and avoid overreliance on a single rating source.
6. ESG Performance and Returns
A persistent myth surrounding ESG investing is that it sacrifices financial returns. However, multiple studies have shown the opposite. Companies with strong ESG profiles often demonstrate:
Lower cost of capital
Greater operational efficiency
Stronger risk management
Better long-term profitability
During the COVID-19 pandemic, ESG funds outperformed traditional funds, underscoring their resilience. Sustainable businesses tend to attract loyal customers, committed employees, and long-term investors — all of which enhance financial stability.
7. The Rise of Green Finance and Innovation
The ESG revolution has spurred innovation across financial markets. Green finance — encompassing green bonds, sustainability-linked loans, and ESG ETFs — is now a multi-trillion-dollar industry.
Green Bonds: Used to finance environmentally friendly projects like renewable energy, energy-efficient buildings, and sustainable transportation.
Sustainability-linked Loans: Offer lower interest rates to borrowers who meet ESG performance targets.
ESG ETFs: Provide diversified exposure to companies with high ESG scores, democratizing sustainable investing for retail investors.
Additionally, carbon trading, renewable energy funds, and social impact bonds are transforming how capital flows toward sustainability goals.
8. Regional Perspectives on ESG Investing
a. United States
The U.S. ESG market is driven by institutional investors and corporate disclosure requirements. While political debates occasionally challenge ESG mandates, major asset managers like BlackRock and Vanguard continue to advocate for sustainability integration.
b. Europe
Europe leads the ESG revolution with stringent regulations, sustainability benchmarks, and investor awareness. The EU Taxonomy defines what qualifies as sustainable, ensuring clarity and preventing greenwashing.
c. Asia-Pacific
In Asia, ESG adoption is rapidly accelerating. Countries like Japan, Singapore, and India have launched ESG funds and mandatory disclosure frameworks. India’s BRSR mandate for top-listed companies is a key milestone in corporate sustainability reporting.
d. Emerging Markets
ESG investing is unlocking opportunities in developing countries through clean energy transitions, inclusive finance, and social impact projects. However, challenges include data quality and regulatory gaps.
9. The Role of Technology in ESG Advancement
Technology has become a game-changer for sustainable investing.
Artificial Intelligence (AI) analyzes massive ESG datasets for insights.
Blockchain enhances transparency in supply chains and ESG reporting.
Fintech platforms allow investors to track the real-world impact of their portfolios.
Smart grids and IoT enable efficient energy usage and carbon tracking.
These innovations empower investors to make data-driven sustainability decisions, enhancing accountability and trust.
10. Challenges and Criticisms of ESG Investing
Despite its popularity, ESG investing faces several criticisms:
a. Greenwashing
Some companies exaggerate their sustainability credentials to attract investors, leading to misleading claims.
b. Data Inconsistency
Different ESG rating systems and lack of standardization create confusion.
c. Short-Termism
Investors may focus on ESG scores rather than long-term impact.
d. Political Backlash
In certain regions, ESG is seen as politically motivated, sparking debates about the role of capitalism in social change.
e. Implementation Complexity
Integrating ESG into traditional investment frameworks requires expertise, reliable data, and alignment with financial objectives.
11. The Future of ESG and Sustainable Investing
The future of ESG investing lies in greater integration, standardization, and impact measurement. Key trends include:
Mandatory ESG disclosures across global markets.
AI-driven ESG analytics for precision and transparency.
Integration with the circular economy, emphasizing resource reuse and waste reduction.
Focus on social equity, including gender inclusion, human rights, and diversity.
Alignment with global net-zero targets by 2050.
As capital continues to flow into sustainable investments, ESG will reshape not only financial markets but also the broader global economy.
12. Conclusion: A New Era of Responsible Capitalism
The ESG and Sustainable Investing Revolution marks the dawn of a new era — one where profit and purpose coexist. It challenges the outdated notion that financial success must come at the expense of the environment or society. Instead, it promotes responsible capitalism, where investors, corporations, and governments collaborate to create a resilient and inclusive economy.
In the coming decades, ESG will not merely be an investment trend but a core determinant of global economic stability. The revolution has already begun — and those who embrace sustainability today will be the market leaders of tomorrow.
The future of finance is not just about earning returns; it’s about earning them responsibly — ensuring that growth today does not compromise the prosperity of future generations.

De-Dollarization and Global Currency ShiftsIntroduction
For over seven decades, the U.S. dollar has been the undisputed king of global finance — the preferred reserve currency, the benchmark for international trade, and the foundation of global capital markets. However, recent years have seen increasing talk and tangible actions toward de-dollarization — the gradual movement away from dependence on the U.S. dollar in global trade, finance, and reserves. This shift is not merely theoretical but increasingly visible in trade agreements, reserve allocations, and cross-border payment systems. Understanding this process requires exploring its historical roots, current dynamics, major players, and the profound implications for the global economy.
1. Historical Dominance of the U.S. Dollar
The dollar’s dominance began after World War II, cemented through the Bretton Woods Agreement of 1944, which established the dollar as the central currency in the international monetary system. Under this system, other currencies were pegged to the dollar, which itself was backed by gold at a fixed rate of $35 per ounce. The U.S. economy, being the largest and most stable, became the anchor of global trade and finance.
Even after the Nixon Shock of 1971, when the U.S. abandoned the gold standard, the dollar maintained its supremacy due to America’s economic might, deep financial markets, and the establishment of the petrodollar system — where oil and other commodities were priced and traded in U.S. dollars. This gave the U.S. an “exorbitant privilege,” enabling it to run large deficits and influence global financial flows without losing credibility.
2. The Concept of De-Dollarization
De-dollarization refers to the global trend of countries reducing their reliance on the U.S. dollar for international trade, reserves, and financial transactions. It encompasses several dimensions:
Trade De-dollarization: Using alternative currencies for bilateral or multilateral trade settlements.
Financial De-dollarization: Diversifying reserves and foreign assets away from the dollar.
Institutional De-dollarization: Creating mechanisms that bypass U.S.-dominated systems like SWIFT.
While the dollar still dominates, de-dollarization is gradually reshaping the landscape, driven by economic pragmatism, geopolitical tensions, and the desire for monetary sovereignty.
3. Factors Driving De-Dollarization
a. Geopolitical Motivations
The most significant catalyst has been geopolitics. The U.S. has frequently used the dollar as a geopolitical weapon, imposing sanctions on nations like Russia, Iran, and Venezuela. This weaponization of the dollar has alarmed countries that fear similar vulnerabilities. For example, after Russia’s exclusion from the SWIFT system in 2022, Moscow and Beijing accelerated moves to use their national currencies for trade.
b. Economic Diversification
Emerging economies, especially China, India, Brazil, and Russia, are seeking greater autonomy in financial dealings. Holding large dollar reserves exposes them to U.S. monetary policy and inflation risks. Diversifying into gold, yuan, or euro assets reduces exposure to dollar volatility.
c. Rise of Alternative Economic Blocs
The BRICS alliance (Brazil, Russia, India, China, and South Africa) has become a strong advocate for a multipolar currency system. Their growing share of global GDP and trade makes it feasible to trade among themselves in local currencies, reducing the dollar’s centrality.
d. Technological Innovation and Digital Currencies
Blockchain technology and Central Bank Digital Currencies (CBDCs) are providing infrastructure for cross-border payments independent of the dollar system. China’s digital yuan and experiments by the European Central Bank and Reserve Bank of India are examples of monetary innovation accelerating de-dollarization.
e. U.S. Fiscal and Monetary Policies
Massive U.S. debt, persistent deficits, and inflationary pressures have raised concerns about long-term dollar stability. As the Federal Reserve’s interest rate policies cause volatility in global markets, many nations seek alternatives to reduce vulnerability to U.S. economic cycles.
4. Key Players in the De-Dollarization Movement
China
China is at the forefront of de-dollarization. Through its Belt and Road Initiative (BRI), it has expanded yuan-denominated trade and investment. The Cross-Border Interbank Payment System (CIPS) is Beijing’s alternative to SWIFT, facilitating international settlements in yuan. The digital yuan (e-CNY) further strengthens China’s ability to bypass the dollar in trade.
Russia
Following Western sanctions after the annexation of Crimea (2014) and the 2022 Ukraine war, Russia drastically reduced its dollar holdings, increasing reserves in gold and yuan. Russian oil and gas are now traded with countries like China and India in local currencies or through barter mechanisms.
India
India has begun signing bilateral trade agreements that allow settlement in Indian Rupees (INR). For example, the INR-Vostro account system facilitates trade with countries like Russia and Sri Lanka. India’s cautious yet steady participation highlights its interest in a diversified currency regime without abruptly destabilizing its financial relations with the West.
Middle East and Africa
Saudi Arabia, traditionally a key pillar of the petrodollar system, has signaled openness to accepting yuan or euros for oil sales, particularly with China. African nations engaged with BRICS and China’s infrastructure projects are also using local currency or yuan settlements, contributing to the multipolar trend.
European Union
The euro remains the second-most used currency in global reserves. The EU’s promotion of the euro in energy and technology trade aims to strengthen its global role and reduce dependence on U.S. financial systems, particularly in the face of unilateral sanctions.
5. Mechanisms of De-Dollarization
a. Bilateral Currency Swaps
Central banks are entering currency swap agreements, enabling direct trade in local currencies. China has over 40 such agreements worldwide, including with nations like Argentina, Pakistan, and Russia.
b. Local Currency Settlements
Countries like India, Brazil, and Indonesia are developing systems for local currency trade settlements, bypassing the dollar in invoicing and payment processing.
c. Multilateral Platforms
The Asian Infrastructure Investment Bank (AIIB) and the New Development Bank (BRICS Bank) are examples of financial institutions providing loans and investments in local currencies rather than dollars.
d. Gold Accumulation
Several nations have increased gold reserves as a hedge against dollar volatility. Central banks worldwide, led by China and Russia, are buying gold at record levels, viewing it as a neutral asset outside U.S. control.
6. Implications for Global Trade and Finance
a. Reduced Dollar Demand
As trade and financial flows diversify, global demand for U.S. dollars may decline gradually. This could weaken the dollar’s exchange rate and reduce the U.S.’s ability to finance its deficits cheaply.
b. Rise of Multipolar Currency System
A more balanced currency system may emerge, dominated by the U.S. dollar, euro, and Chinese yuan, with regional currencies playing niche roles. This diversification could enhance global stability but complicate exchange rate management and liquidity flows.
c. Shifts in Reserve Composition
According to IMF data, the dollar’s share of global reserves has declined from over 70% in 2000 to about 58% in 2024. This trend is expected to continue as central banks increase allocations to gold, yuan, and other assets.
d. New Trade Alliances
Countries prioritizing local currency trade are forming new alliances and payment networks, reshaping global trade routes. For instance, the India-Russia-China corridor and BRICS payment system are notable examples.
e. Impact on U.S. Influence
De-dollarization could gradually diminish U.S. geopolitical leverage. The ability to impose sanctions, control global liquidity, or influence monetary policy worldwide would be reduced. However, this process will likely be slow, given the depth and liquidity of U.S. financial markets.
7. Challenges and Limitations
While the momentum toward de-dollarization is real, several constraints limit its pace:
a. Lack of Deep Capital Markets
The U.S. still offers the largest, most liquid, and transparent capital markets. Alternatives like the yuan or rupee lack full convertibility, regulatory clarity, and global trust.
b. Network Effects
Once a currency dominates, it benefits from self-reinforcing network effects. Most global commodities are priced in dollars, and firms prefer it due to stability and universal acceptance.
c. Political and Institutional Trust
Many countries still view the U.S. legal and financial framework as safer than those of emerging powers. China’s capital controls and Russia’s geopolitical isolation hinder full global acceptance of their currencies.
d. Technological Fragmentation
Although CBDCs and digital platforms offer alternatives, interoperability and security issues remain unresolved. Competing systems could lead to inefficiency rather than integration.
8. Future Outlook: The Road Ahead
The world is unlikely to see the immediate end of the dollar era, but a gradual rebalancing is underway. The next decade could witness:
A tripolar currency system led by the U.S. dollar, euro, and Chinese yuan.
Expansion of digital and regional currencies for trade within Asia, Africa, and Latin America.
Declining U.S. dominance in global reserves but continued dollar primacy due to market depth.
Growth of commodity-backed and digital settlement systems to stabilize cross-border payments.
The dollar’s resilience should not be underestimated — it remains a symbol of trust, backed by strong institutions and deep markets. Yet, as emerging powers grow and technology disrupts traditional finance, the unipolar dollar era is transforming into a multipolar monetary order.
Conclusion
De-dollarization represents one of the most significant shifts in the global economic landscape of the 21st century. It is not an overnight revolution but a gradual evolution driven by geopolitical tensions, technological progress, and the rise of new economic powers. While the U.S. dollar will likely remain dominant for the foreseeable future, its uncontested supremacy is fading. The emerging multipolar currency world — led by the dollar, yuan, and euro — will redefine global finance, trade, and geopolitics.
In essence, de-dollarization is not just a financial adjustment; it is a statement of sovereignty, resilience, and the world’s ongoing journey toward a more balanced and diversified economic order.

Emerging Market Growth and Capital FlowsIntroduction
Emerging markets (EMs) are the engines of modern global growth. These are nations in transition from developing to developed economic status—countries such as India, China, Brazil, Indonesia, and South Africa—representing dynamic economies characterized by rapid industrialization, expanding middle classes, and evolving financial systems. The term “emerging markets” encapsulates both potential and volatility. On one hand, these economies are drivers of global output, trade, and innovation. On the other, they remain vulnerable to external shocks, geopolitical changes, and fluctuations in global capital flows.
At the heart of emerging market performance lies the intricate relationship between economic growth and capital flows. The interaction between these two factors determines the sustainability of development, the resilience of financial systems, and the prospects for long-term prosperity. Understanding this connection is essential to grasp how global liquidity, investor sentiment, and policy environments shape the trajectory of the world’s most dynamic regions.
The Economic Landscape of Emerging Markets
Emerging markets have witnessed profound transformations over the past three decades. From the liberalization of India’s economy in 1991 to China’s opening up and integration into global supply chains, EMs have become integral to global growth. According to the IMF, emerging and developing economies now account for more than 60% of global GDP (on a purchasing power parity basis), compared to less than 40% in 1990.
Several features distinguish these economies:
Rapid Industrialization and Urbanization – Transitioning from agriculture-based to industrial and service-driven structures, EMs are undergoing a massive structural shift that spurs productivity and consumption.
Demographic Advantage – Younger populations, rising literacy rates, and expanding labor forces fuel consumption and entrepreneurship.
Growing Financial Integration – Enhanced access to global capital markets and increased foreign direct investment (FDI) have improved financing options for infrastructure and business development.
Technological Leapfrogging – Emerging economies often skip traditional stages of development by adopting digital technologies, fintech, and e-commerce at scale.
However, growth in these regions is not linear. EMs are susceptible to capital volatility, commodity price swings, and currency fluctuations—all of which can amplify economic cycles.
Understanding Capital Flows
Capital flows refer to the movement of money across borders for investment, trade, or business production. They are broadly classified into:
Foreign Direct Investment (FDI): Long-term investment in productive assets such as factories, infrastructure, or business ownership. FDI is considered stable and beneficial as it transfers technology, skills, and management expertise.
Foreign Portfolio Investment (FPI): Investments in financial assets like stocks and bonds. While it enhances liquidity and financial depth, FPI can be volatile and prone to sudden reversals.
Official Flows: Movements from governments and international financial institutions (such as IMF or World Bank), including loans, grants, and aid.
Private Debt and Bank Lending: Cross-border loans and credits to corporations or governments, often sensitive to interest rate differentials and credit risk perceptions.
Capital flows are influenced by push and pull factors:
Push factors include global conditions such as low interest rates in developed markets, risk appetite, and monetary policy stances of advanced economies (e.g., U.S. Federal Reserve).
Pull factors relate to domestic fundamentals such as growth potential, political stability, institutional quality, and market reforms in the recipient emerging economy.
Drivers of Growth in Emerging Markets
The robust growth in EMs can be attributed to several structural and cyclical drivers:
1. Demographic and Consumption Power
Emerging markets collectively host nearly 85% of the world’s population. This demographic dividend translates into expanding consumer bases and rising household incomes. For example, India’s middle class is expected to exceed 500 million by 2030, driving demand in housing, technology, healthcare, and mobility.
2. Industrial and Infrastructure Expansion
Investment in roads, ports, energy grids, and digital networks not only boosts productivity but also attracts long-term foreign investors. Governments and development banks play a vital role in facilitating such projects.
3. Trade and Global Integration
EMs have become crucial participants in global supply chains. For instance, Vietnam and Mexico have benefited from shifts in manufacturing away from China, reflecting the China+1 diversification strategy.
4. Financial Deepening and Reforms
Many EMs have liberalized their financial systems, improved central bank independence, and developed domestic capital markets. The establishment of local bond markets in countries like Indonesia and Brazil reduces dependence on foreign borrowing.
5. Technological Adoption
Digital transformation is reshaping emerging economies. Fintech in Africa, e-commerce in Southeast Asia, and digital payments in India have improved financial inclusion, enabling millions to participate in the formal economy.
The Role of Capital Flows in Emerging Market Growth
Capital flows play a dual role in emerging economies: they are both enablers of growth and sources of vulnerability.
Positive Impacts
Financing Development Gaps:
EMs often face domestic savings constraints. Foreign capital fills this gap, enabling investment in infrastructure, technology, and industrial capacity.
Technology and Knowledge Transfer:
FDI brings innovation, managerial skills, and modern production techniques, enhancing competitiveness.
Financial Market Development:
Portfolio inflows contribute to liquidity, improving price discovery and broadening financial participation.
Exchange Rate Stability:
Inflows can strengthen currencies, reducing the cost of imports and helping control inflation.
Negative Impacts and Vulnerabilities
Volatility and Sudden Stops:
Portfolio flows can reverse quickly due to global shocks—known as “sudden stops”. These outflows can trigger currency depreciation, inflation, and financial crises (e.g., 1997 Asian Financial Crisis).
Overvaluation of Assets:
Excessive inflows can inflate asset bubbles in stock or real estate markets, leading to financial instability.
Debt Accumulation:
Easy access to foreign debt may encourage over-borrowing, creating vulnerabilities when global interest rates rise.
Exchange Rate Pressures:
Inflows appreciate local currencies, hurting export competitiveness. Conversely, outflows cause depreciation and capital flight.
Historical Perspective: Episodes of Capital Flow Volatility
1. Asian Financial Crisis (1997–1998):
Large inflows of short-term capital into Southeast Asian economies led to asset bubbles. When global sentiment shifted, rapid outflows caused currency collapses and severe recessions.
2. Global Financial Crisis (2008):
After the crisis, major central banks adopted near-zero interest rates and quantitative easing, prompting massive capital inflows into EMs in search of yield. This “liquidity wave” boosted growth but also heightened vulnerability to reversal.
3. Taper Tantrum (2013):
When the U.S. Federal Reserve signaled tapering of its asset purchases, EM currencies and bond markets experienced sharp sell-offs. This episode underscored how dependent EMs are on global monetary conditions.
4. Pandemic Era and Beyond (2020–2023):
COVID-19 caused the largest capital outflow in EM history in early 2020, followed by a surge in inflows as global liquidity expanded. By 2023–2024, as interest rates in developed markets rose again, EMs faced renewed pressure.
Policy Frameworks and Resilience Strategies
Emerging markets have learned from past crises and built stronger frameworks to manage capital flows and enhance stability.
Flexible Exchange Rate Regimes:
Allowing currencies to adjust to market forces reduces pressure on foreign reserves and discourages speculative attacks.
Foreign Reserve Accumulation:
Countries like China and India maintain large reserves as buffers against capital outflows and external shocks.
Macroprudential Policies:
Tools such as capital requirements, debt limits, and countercyclical buffers mitigate systemic risks in the financial sector.
Capital Controls (Selective):
Some EMs employ temporary restrictions to curb speculative inflows or prevent destabilizing outflows.
Strengthening Domestic Institutions:
Transparent governance, stable legal systems, and credible monetary authorities attract long-term investors.
The Emerging Market Investment Landscape
Global investors are increasingly viewing EMs as essential components of diversified portfolios. Key reasons include:
Higher Growth Potential: EMs typically offer GDP growth rates 2–3 times higher than developed markets.
Valuation Opportunities: Equity and bond markets in EMs often trade at lower valuations relative to fundamentals.
Diversification Benefits: Economic cycles in EMs are not perfectly correlated with those in developed nations, reducing portfolio risk.
However, investors must navigate country-specific risks, including political instability, currency volatility, and regulatory unpredictability. Institutional investors now adopt sophisticated risk assessment frameworks, incorporating environmental, social, and governance (ESG) factors into EM investments.
The Future Outlook: Emerging Markets in a Changing Global Order
The future of emerging markets will be shaped by several transformative trends:
Regional Integration:
Initiatives such as the African Continental Free Trade Area (AfCFTA) and ASEAN Economic Community (AEC) will deepen trade and capital linkages.
Green Transition:
EMs will attract capital for renewable energy, sustainable infrastructure, and climate adaptation—opening vast new investment frontiers.
Digital Economy Expansion:
The rise of digital currencies, fintech ecosystems, and e-commerce will fuel productivity gains and broaden financial inclusion.
Geopolitical Realignments:
As global supply chains diversify away from single-country dependence, countries like India, Vietnam, and Mexico will emerge as key manufacturing hubs.
Resilience through Domestic Capital Markets:
Developing robust local investor bases and bond markets will reduce dependency on volatile foreign inflows.
Conclusion
Emerging market growth and capital flows are inextricably intertwined, reflecting both opportunity and fragility. While capital inflows can accelerate industrialization, innovation, and prosperity, their volatility can destabilize economies if not managed prudently. Over time, emerging economies have become more resilient—adopting flexible exchange rates, prudent fiscal policies, and sound macroeconomic frameworks.
As the global economic order evolves, EMs are expected to contribute more than two-thirds of global growth in the coming decade. The challenge lies in sustaining this momentum through diversification, innovation, and institutional strength. The management of capital flows—ensuring that they are harnessed for productive purposes rather than speculative gains—will define whether emerging markets truly fulfill their promise as the growth engines of the 21st century.

Understanding Psychological LevelsDefinition:
In Trading, Psychological levels are often called round numbers or psy levels.
This is because the price ends in zeros and fives naturally attracting a trader’s attention.
Examples:
• Forex: 1.0000, 1.0500, 1.1000
• Stocks: $50, $100, $150, $200, $250
• Cryptocurrency: $10,000, $15,000, $20,000, $25,000
These levels are crucial as traders instinctively see targets in round numbers. (Or Incremental levels such as 5, 10, 15, 20, 25, 30 and so on...
This causes many buy, sell, and stop orders to cluster around the same price zones, creating self-reinforcing areas of interest in the market. Again, price sits at 113.2k – Psychological level is 115k.
___________________________________________________________________________________
Why Psychological Levels Matter in Trading
1) Human Bias:
Traders and investors often place orders at simple, rounded numbers. This makes their charts and order list “Clean.”
2) Institutional Targeting:
Large groups, whales or organizations use these levels to find liquidity or trigger stops. (Eg, BTC swept 125k before dumping)
3) Market Memory:
When a Psychological level reacts, traders remember it, and it often becomes relevant again in the future. (Turns into a prev liquidity sweep.)
5) Order Clustering:
Stop losses, take profits, and pending orders frequently build up around these areas. (As above, it builds liquidity.)
__________________________________________________________________________________
How to Identify Psychological Levels
Begin with marking clean, round (or quarterly) numbers on your chart. These are often major levels such as 4.0000, 5.0000, or 6.0000.
See the example below:
Then identify the midpoints/quarter points between them, like 4.5, 5.5, 6.5, 7.5, 8.5
See the example below:
For stronger assessments, look for psychological levels that align with other forms & tools of technical confluence—such as previous S & R, Supply/Demand, Highs & Lows, Fibonacci retracements, trendlines, or volume clusters.
See the example below:
When multiple forms of technical evidence converge near a round number, the level tends to have greater impact.
__________________________________________________________________________________
Trading Around Psychological Levels
When price approaches a psychological level, three common behaviors can occur:
1) Rejection:
Price touches the level and reverses quickly, suggesting strong defense by buyers or sellers. (Liquidity Sweep)
2) Break and Retest:
Price breaks through the level, then revisits it to confirm it as new support or resistance.
3) Compression or Grind:
Price consolidates near the level before a breakout as liquidity builds up.
Practical Application:
Enable alerts slightly before major psychological levels to observe reactions in real time (for example, 4.45 instead of 4.5 ). Wait for confirmation using price action such as a clear rejection wick, an engulfing candle, or a BOS (Break of Structure). Combine this analysis with liquidity or other forms of technical tools for a stronger assessment.
__________________________________________________________________________________
Trader Behavior at These Levels
Market reactions at psychological levels are largely directed by emotion and herd (Group) behavior. Fear of missing out can push price through a round number with momentum & speed while profit-taking can trigger short-term reversals & rejections. Stop hunts are also common, where smart money briefly pushes prices beyond a round level to collect liquidity before reversing. (From 4.0 up to 4.25 then down again)
Because many traders watch these same levels, reactions often repeat, reinforcing their significance.
__________________________________________________________________________________
Example: BTC/USD for $125k
When Bitcoin approaches $125k, many retail traders view it as a significant threshold. They might place short orders just below it or stop just above. Institutions recognize this and may intentionally push prices above $125k (sweeping $126k) to trigger those stops and fill large positions.
Once that liquidity is collected, price can reverse, and the $125k area may later serve as a new resistance zone.
This type of liquidity hunt and reversal pattern occurs frequently across all markets.
__________________________________________________________________________________
Practical Tips
1) Never trade purely based on a round number. Always wait for confirmation through structure or price action. (Retests, MSS, BOS, candle patterns etc)
2) Use alerts & alarms rather than fixed lines; prices often wick slightly above or below the exact level.
3) On higher timeframes, psychological levels often act as major turning zones. On lower timeframes, they tend to attract short-term reactions. (Lower the time frame, the more reactions = constant noise)
4) Combine psychological levels with liquidity, order flow, or volume analysis for a more complete view.
__________________________________________________________________________________
Summary
Psychological levels are where human reactions and liquidity meet. They represent areas of emotional and institutional/organizational interest rather than fixed points of reversal.
By understanding how traders behave around these zones and observing how price reacts to them, you can determine key movements with greater confidence.

Recap: No Signal? No Problem. Reading Price Like a ProFellow Traders,
I had some time today to do a quick recap — let’s break it down.
Opening Morning
What happened? Exactly what needed to happen: nothing.
No signal. No golden pocket retracements. Nothing worth forcing a trade.
We saw a break of the ORB at 10:40 AM on the 5-minute chart. A bearish candle closed just below that level, but there was no signal giving any conviction of a further move.
Between 10:00 AM and 10:20 AM, the 5-minute candles also showed no real conviction. Even though they played right in the Golden Pocket, there was no close inside the pocket itself.
Looking for confluences in other signals — particularly the 0DTE Context Indicator — price action on both the 5-minute and 15-minute charts never pushed below any of the EMA, SMA, or VWAP lines. Again, no conviction for the bears to step in.
First Entry
I played the waiting game today. My first trade on QQQ 0DTE didn’t happen until 11:05 AM. When I saw price holding above my lines and refusing to break lower, I knew a trade was setting up to the upside.
You’re probably wondering what kind of contracts I took.
I typically trade CALL or PUT options with a Greek Delta of 0.40 or higher, which puts me just under an ITM option. Once I’m in, I aim for a 50% profit target, which can come fast with the right move. The lower the Delta, the higher the risk — so I keep it tight.
If you want more details on how I time those entries, feel free to DM me.
Price Action Confirmation
After entering, I made a few additional plays as price began to push above my 0DTE Context Indicator lines. On the 5-minute chart, the candles between 12:05 PM and 12:20 PM played directly into the Golden Pocket — this gave me strong conviction that price was heading for new highs.
Final Thoughts
Today was a bit tricky. It required more patience and reading the tape than I would have liked. But as traders, we’ll see plenty of days like this. The key is to not overstay your welcome. Don’t force trades. Let price action finish its story before making your move.
I hope these recaps help you better understand how to use the indicators I’ve built. If you have any questions or feedback, drop a comment or DM me — I’d love to hear from you.
Thank you again for the continued support.
— TradeswithB