Mastering Trend Reversals: Morning & Evening Star PatternsSo, you're trying to nail those trend reversals? The Morning and Evening Star patterns are perfect for that. They show up right when the market’s about to shift, giving you a chance to get in before the move really takes off. Let’s break down how these setups work and why they’re such solid tools for traders like you.
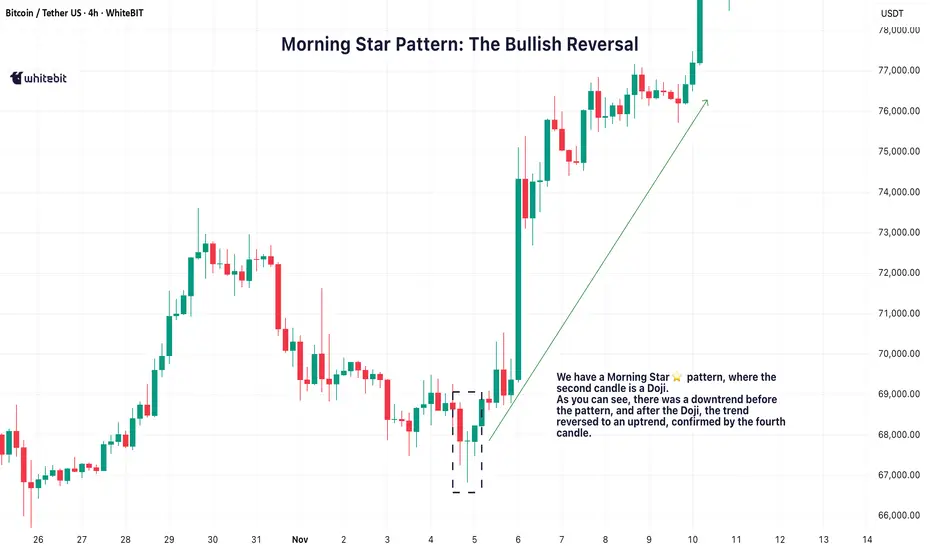
🌅 Morning Star Pattern: The Bullish Reversal
The Morning Star pattern is one of the best ways to catch a trend reversal from bearish to bullish. It usually pops up after a downtrend, signaling that the market is about to make a move to the upside. It’s made up of three candles:
A long red candle that shows the market’s been selling off.
A small candle, often a Doji, that indicates indecision or a pause in the downtrend.
A big green candle that confirms the shift, showing buyers are taking control.
When you spot a Morning Star candlestick pattern, it’s a strong indication that the downtrend might be over and the bulls could be taking over. The third candle plays a crucial role here, confirming that the trend is likely reversing.
🌇 Evening Star Pattern: The Bearish Reversal
On the flip side, the Evening Star pattern is the bearish cousin of the Morning Star. It shows up after an uptrend and signals that the market is ready to start heading down. It also consists of three candles:
A long green candle that continues the uptrend.
A small candle, again often a Doji, that suggests the market’s losing momentum.
A big red candle that confirms the reversal, showing sellers are stepping in.
When you see the Evening Star candlestick pattern, it tells you that the market could be shifting from bullish to bearish. The third candle confirms that the reversal might be taking place.
💡 Trading the Star Patterns
Both the Morning Star trading pattern and Evening Star patterns are great for spotting potential trend reversals, but they shouldn't be relied on as the only signal. To increase the reliability of these patterns, consider confirming them with other indicators like RSI (Relative Strength Index) , MACD (Moving Average Convergence Divergence) , or volume analysis.
For example, if a Morning Star pattern candlestick appears and is followed by increasing volume, it adds strength to the reversal signal. Similarly, if the Evening Star shows up with an overbought RSI, it could provide further confirmation that the market is due for a pullback.
By using these additional tools, you can have more confidence in your analysis and make better-informed decisions.
📈 Why These Patterns Matter
The Morning Star and Evening Star patterns are powerful tools for identifying potential trend reversals. They give traders a visual cue that a market shift could be on the horizon, helping to spot potential turning points.
However, it’s crucial to make your trading decisions based on a combination of factors and not rely solely on these patterns. Always make sure to consider the broader market context and other technical indicators before acting on any pattern.
Chart Patterns
Trades with B – Daily Recap (Nov 6 2025)Ticker: QQQ / NQ1! (5 min & 15 min TF)
Strategy: ORB Pro + Golden Pocket Retest + Volume Filter
Focus: Confirmation Entry + HTF Trend Confluence
🧭 Market Context
The Nasdaq futures (NQ1!) opened with a sharp push into a key supply zone marked by the previous day’s Golden Pocket.
After an early fake push up, the market rolled over cleanly beneath the EMA cluster and the ORB box on both timeframes.
The first true confirmation signal came mid-morning — the 15 min and 5 min timeframes synced short, and the volume aligned perfectly with trend continuation.
🧠 Trade Review
Entry: 11:02 EST QQQ $613 Put (ORB Pro Short Trigger)
Exit: 11:35 EST — ORB extension target hit → secured profit into momentum flush
System Validation: Perfect alignment across EMA trend + HTF bias + retest rejection signal
P/L: +$199.78 net profit ( + $289.94 closed gain – $190.05 entry cost )
This trade was clean — confirmation entry, defined risk, and no over-trading.
📊 Performance Snapshot
Metric Value
Win Rate 100 % (today’s single trade)
Best Trade +$289.94
Largest Loss – $190.05
Net Result +$199.78 (Realized)
Setup Accuracy Excellent – Full confirmation alignment
📈 Chart Breakdown
The ORB Pro short triggered as price retested the upper Golden Pocket zone and failed to hold above the purple EMA band.
Both the 15 min and 5 min charts show a clean EMA curl-down with volume confirmation.
The short target zone was hit precisely before a small midday bounce, validating the system’s filter timing.
💡 Key Takeaways
Wait for alignment – when HTF and LTF agree, you get momentum moves.
Clean entry > early entry – confirmation beat anticipation again.
ORB Pro filter precision – blocked late entries, protecting the green.
🧘♂️ Reflection
“The setup was textbook — patience finally paid off. One trade, one signal, and one profit. The goal now is simple: keep filtering for these perfect alignments and size up responsibly as consistency builds.”
🧩 Next Steps
✅ Focus only on HTF + LTF confirmation signals
✅ Avoid re-entries once target zone is hit
✅ Document each setup screenshot for pattern library

Macroeconomics and Investor Psychology Driving Gold PricesFirstly, macroeconomic policies , particularly monetary policy moves by the U.S ., will continue to have a significant impact on gold prices. Specifically, the upcoming decisions by the Federal Reserve (Fed) regarding interest rate cuts are expected to create positive momentum for gold, as investors turn to gold as a safe-haven asset in a low-interest-rate environment.
Secondly, the independence of the Fed is a key factor, not only directly influencing confidence in the USD but also strongly affecting trust in U.S. institutions. The stability and transparency of the Fed's policy decisions will continue to create significant market volatility, directly impacting gold prices.
In addition, gold is becoming increasingly attractive to investors due to the combination of two key factors. First, the increasing national debt in many countries is becoming a major risk, as global fiscal sustainability is in question, making gold a more reliable safe-haven asset. Second, the erosion and weakening of international systems and standards have led to diminishing confidence in financial systems and international approaches. This has further strengthened gold's position as a safe asset in the eyes of investors.
Another important factor influencing gold prices is the psychology of seeking global risk hedging . In the context of concerns about "bubbles" in the AI technology sector , if AI technology proves to be a bubble and bursts, gold and other assets will become even more attractive as strategic safe-haven assets.
With all these factors in play, gold is not only an attractive investment choice but also a strategic asset during times of financial and global economic instability.

US Dollar's Abnormal BehaviorWhy am I saying it abnormal
- because typically DXY tends to weaken with a rate cuts
- In the last 2 month - there were 2 rate cuts,
- but since those "cuts", a declining dollar begins to show upward corrections (or started getting strong)
- Yesterday - ADP released a very strong labor statistics +42K from -29K in the previous month
- Now dollar must continue to strengthen & rise upon such positive data...........
- But today, DXY started with a gap-down and outlook looks further bearish today

Market analysis using bitcoin dominance & usdt dominance chartsWe aim to conduct an in-depth analysis of the correlations among four key indicators used to interpret the complex dynamics and investor sentiment in the cryptocurrency market — Bitcoin Dominance, USDT Dominance, TOTAL3, and the Coinbase Premium — and to share insights on how these can be effectively utilized in real trading strategies.
By analyzing these four indicators together, traders can identify the overall market trend, gauge the vitality of the altcoin market, and assess institutional participation, which provides a foundation for developing mid- to long-term trading strategies.
First, please click Boost (🚀) so that more people can see this post.
💡Understanding the Key Indicators
Bitcoin Dominance: CRYPTOCAP:BTC.D
The ratio of Bitcoin’s market capitalization to the total cryptocurrency market capitalization.
It represents Bitcoin’s market strength relative to altcoins.
USDT Dominance: CRYPTOCAP:USDT.D
The ratio of Tether (USDT) market capitalization to the total cryptocurrency market capitalization.
It helps identify risk-on/risk-off sentiment among investors and assess the level of market liquidity.
TOTAL3: CRYPTOCAP:TOTAL3
The total market capitalization of all altcoins excluding Bitcoin (BTC) and Ethereum (ETH).
It directly reflects the overall momentum of the altcoin market.
Coinbase Premium Index: TradingView Indicator
An indicator showing the price difference of BTC between Coinbase and other major exchanges (e.g., Binance).
It is used to indirectly gauge institutional buying pressure (positive premium) or selling pressure (negative premium) in the U.S. market.
⚙️Interaction of Indicators and Trading Strategies
These four indicators exhibit specific patterns under different market conditions.
By analyzing them comprehensively, traders can identify medium- and long-term trading opportunities.
Correlation between BTC price and indicators:
BTC price vs BTC.D: Complex correlation.
BTC price vs USDT.D: Mostly inverse correlation (USDT.D rising = market uncertainty and BTC decline)
BTC price vs TOTAL3: Mostly Positive correlation (BTC rise = TOTAL3 rise)
BTC price vs Coinbase Premium: Mostly Positive correlation (sustained positive premium = continued BTC uptrend)
✔️Scenario 1: Bullish Phase📈 (Bitcoin-led Rally)
BTC.D rises: Capital concentrates into Bitcoin
USDT.D falls: Increased risk appetite, cash inflows grow
TOTAL3 moves sideways or slightly upward: Altcoins remain weak or unresponsive
Coinbase Premium rises and stays positive: Institutional buying inflow
Interpretation:
Strong institutional buying of Bitcoin drives the market, with capital shifting from stablecoins into BTC.
Altcoins may lag behind this movement initially.
Strategy:
If the Coinbase Premium remains positive even during minor BTC corrections, it favors building long BTC positions.
When the positive premium persists and BTC breaks key resistance levels, it can be interpreted as a strong buy signal.
During early stages, focus primarily on Bitcoin rather than altcoins.
✔️Scenario 2: Strong Bull Market📈 (Altcoins Join the Rally)
BTC.D declines: Capital rotates from Bitcoin to altcoins
USDT.D declines: Ongoing risk appetite and continuous inflows
TOTAL3 rises: Peak momentum in the altcoin market
Coinbase Premium remains positive: Continuous liquidity inflow
Interpretation:
As Bitcoin stabilizes or trends upward, capital starts flowing aggressively into altcoins.
The rise in TOTAL3 reflects broad-based strength across the altcoin market.
Strategy:
Select fundamentally strong altcoins and build positions gradually.
During this phase, large-cap and small-cap thematic groups may experience rotational pumps — monitoring related narratives is crucial.
✔️Scenario 3: Bearish Market📉
BTC.D rises: Altcoins fall more sharply as BTC declines
USDT.D rises: Strengthened risk aversion and increased cash positions
TOTAL3 declines: Deepening weakness in the altcoin market
Coinbase Premium drops and stays negative: Institutional selling or halted buying
Interpretation:
Heightened market anxiety leads investors to liquidate risk assets and move into stable holdings such as USDT.
Institutional selling pressure pushes the Coinbase Premium negative or maintains it in a downward trend.
Altcoins are likely to experience the greatest losses in this phase.
Strategy:
Reduce crypto exposure or convert positions to stable assets (USDT) for risk management.
During technical rebounds, consider trimming positions or cautiously taking short opportunities (with higher risk).
✔️Scenario 4: Sideways or Correction Phase
BTC.D moves sideways: Range-bound consolidation
USDT.D moves sideways: Persistent risk aversion and lower market volume
TOTAL3 moves sideways: Altcoin market remains flat or slightly weak
Coinbase Premium stable: Fluctuates between positive and negative values
Interpretation:
The market enters a wait-and-see phase with sideways movement or mild correction.
The Coinbase Premium’s neutrality reflects uncertainty in institutional capital flows.
Strategy:
Monitor BTC and TOTAL3 reactions at major support levels before re-entering positions.
It may be prudent to stay on the sidelines until clear institutional accumulation or positive catalysts emerge to restore sentiment.
🎯TradingView Chart Setup and Usage Tips
Multi-Chart Layout: Use TradingView’s multi-chart feature to display BTCUSDT, BTC.D, USDT.D, and TOTAL3 simultaneously for comparative analysis. (Apply Coinbase Premium as an additional indicator.)
Timeframes: For short-term analysis, use 1H, 4H, or 1D; for medium- to long-term, use 1W or 1M charts. Confidence increases when multiple indicators align across the same timeframe.
Trendlines and Support/Resistance: Draw trendlines, support, and resistance on each indicator chart to identify key inflection points. Breakouts on USDT.D or BTC.D often signal major market shifts.
Supplementary Indicators: Combine RSI, MACD, or other technical indicators to detect divergences or overbought/oversold zones for added precision.
⚡Analytical Value and Considerations
Comprehensive Market Insight: Analyzing all four indicators together enhances overall market understanding.
Leading vs Lagging Indicators: Coinbase Premium can serve as a leading signal, while dominance and market cap metrics act as coincident indicators reflecting current conditions.
Probabilistic Nature: These indicators are not predictive tools but should be interpreted within a broader context of market variables.
Risk Management: Always apply stop-loss measures and manage exposure carefully. Be prepared for deviations from expected market behavior.
🌍Conclusion
Bitcoin Dominance, USDT Dominance, TOTAL3, and the Coinbase Premium Index are fundamental components in decoding the complex structure of the cryptocurrency market.
Analyzing them in conjunction enables a deeper understanding of market sentiment, anticipation of upcoming opportunities and risks, and the development of a more intelligent and stable trading strategy.
💬 If you found this analysis insightful, share your thoughts in the comments!
🚀 Don’t forget to hit Boost to support the post!
🔔 Follow to make sure you don’t miss the next market insight!
Understanding the Link Between War and Global Trade1. Historical Context: How War Shaped Trade Evolution
From the ancient Silk Road to modern-day global supply chains, trade has always been influenced by conflict. In medieval times, wars between empires often revolved around control of trade routes and access to resources such as spices, gold, or oil. The European colonial wars, for example, were largely driven by competition over global trade dominance.
In the 20th century, the two World Wars significantly reshaped global trade structures. After World War II, the devastation of Europe and Asia prompted the creation of new international trade institutions, such as the General Agreement on Tariffs and Trade (GATT) and later the World Trade Organization (WTO). These frameworks aimed to stabilize trade, rebuild economies, and prevent future conflicts through economic cooperation. Thus, while wars disrupt trade in the short term, they often lead to long-term structural changes in the global economic order.
2. Disruption of Supply Chains and Production
One of the most immediate impacts of war on trade is the disruption of global supply chains. Armed conflicts damage infrastructure—ports, roads, factories, and energy grids—making it difficult to produce and transport goods.
For instance, the ongoing Russia–Ukraine conflict has severely affected global trade in agricultural commodities like wheat, sunflower oil, and fertilizer. Both nations are major suppliers, and the conflict led to food price inflation worldwide. Similarly, wars in the Middle East often disrupt the oil supply, causing energy prices to surge globally and impacting industries dependent on stable fuel costs.
In addition to physical destruction, wars create logistical bottlenecks. Shipping routes may become unsafe due to blockades or military attacks, forcing traders to take longer, more expensive routes. Insurance premiums for shipping through conflict zones rise dramatically, adding further costs to international trade.
3. Trade Sanctions and Economic Warfare
In modern conflicts, nations increasingly use economic tools instead of direct military engagement. Trade sanctions, embargoes, and restrictions are often deployed as part of economic warfare.
For example, Western countries imposed extensive sanctions on Russia after its invasion of Ukraine in 2022. These sanctions targeted its energy exports, banking system, and access to international technology. While intended to pressure the Russian economy, such actions also disrupted global markets, particularly in Europe, which was heavily dependent on Russian gas.
Similarly, U.S.-China trade tensions illustrate how economic rivalry can take the form of trade wars rather than armed wars. Though not a traditional conflict, such economic confrontations can have similar destabilizing effects—reducing global trade efficiency, increasing tariffs, and forcing companies to diversify their supply chains.
4. Inflation, Commodity Prices, and Market Volatility
War creates economic uncertainty, which directly affects trade through market volatility and inflation. Investors tend to move away from risky markets during conflict, leading to currency fluctuations and reduced capital flow into affected regions.
Commodity prices—especially energy, metals, and agricultural products—often spike during wars. For instance, the Gulf Wars and the recent Russia–Ukraine war caused sharp increases in oil prices, which in turn raised the cost of transportation and manufacturing globally. These price shocks ripple through the entire global economy, reducing consumer spending power and slowing down international trade growth.
Inflation also becomes a significant challenge for importing countries, as the cost of raw materials and energy increases. Central banks may respond by tightening monetary policy, which can further slow global economic growth and trade expansion.
5. Shift in Trade Alliances and Global Power Dynamics
Wars often lead to the restructuring of global trade alliances. Countries may realign their economic partnerships based on political interests or security concerns.
For example, after the Cold War, the U.S. and Western Europe expanded trade with former Soviet bloc countries, integrating them into the global economy. In contrast, the Russia–Ukraine war has prompted Europe to seek energy independence from Russia, shifting its focus toward renewable energy and alternate suppliers like the Middle East, the U.S., and Africa.
China’s Belt and Road Initiative (BRI) can also be viewed as a strategic move to secure trade routes and minimize dependency on regions prone to conflict. Thus, wars accelerate geopolitical realignments that redefine global trade routes and dependencies for decades.
6. War-Induced Innovation and Industrial Transformation
Interestingly, wars have historically driven technological and industrial innovation, which later benefits global trade. Military research often leads to advancements in technology, logistics, and communication systems that are later adapted for civilian and commercial use.
For instance, World War II spurred innovations in aviation, shipping, and computing that laid the foundation for the modern global logistics industry. Similarly, the Cold War competition led to breakthroughs in electronics and space technology, which later revolutionized global communication and e-commerce.
In this sense, while wars initially disrupt trade, they can inadvertently stimulate industrial modernization and efficiency in the post-war period, enabling countries to rebuild stronger economic foundations.
7. Humanitarian and Labor Market Impacts
The human toll of war has a direct bearing on global trade through its effects on labor markets and migration patterns. Conflicts displace millions of people, leading to refugee crises and labor shortages in war-torn regions. At the same time, countries receiving refugees may experience labor surpluses or integration challenges.
For example, wars in Syria and Ukraine have caused large-scale migration toward Europe, affecting labor availability and domestic consumption patterns. Moreover, war reduces productivity as skilled workers flee conflict zones and industries struggle to operate under unstable conditions.
The resulting humanitarian crises also place financial burdens on neighboring countries, international aid organizations, and trade partners, altering the flow of goods, services, and capital in global markets.
8. Long-Term Economic Recovery and Reconstruction
Post-war periods often bring massive reconstruction efforts, which can revitalize trade. Rebuilding destroyed infrastructure creates demand for construction materials, machinery, and skilled labor, attracting global investment.
The Marshall Plan after World War II is a notable example—U.S. aid helped rebuild Western Europe, boosting transatlantic trade and fostering long-term economic growth. Similarly, post-war Japan and Germany transformed into industrial powerhouses due to international support and domestic reforms.
However, recovery depends on the scale of destruction, political stability, and international cooperation. Prolonged wars without resolution, such as those in parts of the Middle East and Africa, tend to keep trade volumes suppressed for extended periods.
9. Globalization, Interdependence, and the Future of Trade
In today’s interconnected world, the global economy is more interdependent than ever. This interdependence acts as both a deterrent to war and a source of vulnerability. On one hand, nations that are economically linked are less likely to engage in conflict due to the high mutual costs involved. On the other hand, when conflicts do occur, their ripple effects are felt globally—no economy remains isolated.
For instance, the Russia–Ukraine conflict affected everything from European gas prices to Asian fertilizer supplies and African grain imports. This has sparked debates about deglobalization, supply chain diversification, and strategic autonomy, as countries seek to reduce their exposure to geopolitical shocks.
Conclusion
The link between war and global trade is a complex web of disruption, adaptation, and transformation. While war undeniably brings destruction and economic instability, it also catalyzes long-term structural changes in trade systems, innovation, and geopolitical power dynamics. Modern conflicts, unlike historical ones, are fought as much with economic tools as with weapons, highlighting how trade itself has become a battleground for global influence.
As nations navigate the challenges of the 21st century—geopolitical tensions, resource competition, and economic sanctions—the future of global trade will depend on how effectively the world balances economic interdependence with security concerns. Ultimately, peace remains the most powerful driver of sustainable global trade, while war serves as a costly reminder of its fragility.

Global Currency Trends and Challenges1. The Dynamics of Global Currency Trends
Currencies fluctuate continuously due to multiple factors including interest rates, inflation, trade balances, and investor sentiment. In recent years, global currency trends have reflected the broader transitions in the world economy:
a. The Strength of the U.S. Dollar (USD):
The U.S. dollar continues to dominate as the world’s primary reserve currency, accounting for about 58% of global foreign reserves. Its dominance is supported by the stability of the U.S. economy and the depth of its financial markets. However, the dollar’s strength often creates challenges for emerging markets as it raises the cost of imports and foreign debt repayment.
b. The Rise of the Chinese Yuan (CNY):
China has made consistent efforts to internationalize the yuan (renminbi). Through trade settlements, central bank swap agreements, and inclusion in the IMF’s Special Drawing Rights (SDR) basket, the yuan has become an increasingly influential currency in Asia and beyond. The Belt and Road Initiative further enhances its role in regional trade.
c. The Euro’s Resilience (EUR):
Despite political fragmentation and energy crises, the euro remains the second most traded and held currency. The European Central Bank (ECB) has strengthened its credibility through unified monetary policies, although economic disparities among EU member states still pose challenges to its long-term stability.
d. Emerging Market Currencies:
Currencies like the Indian Rupee (INR), Brazilian Real (BRL), and Indonesian Rupiah (IDR) are gaining attention as their economies expand. Yet, these currencies often face volatility due to external factors such as oil prices, foreign investment flows, and geopolitical tensions.
2. Key Global Currency Trends Shaping the Future
a. Shift Toward De-Dollarization:
Many nations are reducing their dependence on the U.S. dollar for trade settlements and reserves. Countries such as Russia, China, and India are increasingly using local currencies for bilateral trade. The establishment of regional payment systems like the BRICS Pay initiative signals a long-term effort to diversify away from dollar dominance.
b. Digital and Central Bank Digital Currencies (CBDCs):
The introduction of digital currencies is transforming how money circulates globally. China’s digital yuan pilot, the European Central Bank’s digital euro project, and the U.S. discussions around a digital dollar show that CBDCs are becoming integral to future monetary systems. They promise faster transactions, greater transparency, and lower cross-border costs but also raise privacy and cybersecurity concerns.
c. Volatility Amid Global Uncertainty:
Geopolitical conflicts, such as the Russia–Ukraine war and Middle East tensions, continue to affect currency markets. These events drive investors toward “safe-haven” currencies like the U.S. dollar, Swiss franc (CHF), and Japanese yen (JPY), increasing volatility in emerging markets.
d. Inflation and Interest Rate Cycles:
Central banks across the globe are battling inflation through aggressive rate hikes. The U.S. Federal Reserve’s monetary tightening has strengthened the dollar, while other currencies have weakened comparatively. Such divergence in interest rate policies creates significant volatility in Forex markets and impacts global capital flows.
e. Technological Integration and Algorithmic Trading:
Advanced analytics and artificial intelligence have changed how currency trading operates. Algorithmic and high-frequency trading (HFT) dominate modern Forex markets, improving liquidity but sometimes amplifying short-term volatility.
3. Major Challenges Facing Global Currencies
a. Inflationary Pressures:
Post-pandemic recovery spending and geopolitical disruptions have triggered persistent inflation across major economies. Currency depreciation is often both a symptom and a cause of inflation, creating a feedback loop that destabilizes developing economies. For example, high inflation in Argentina and Turkey has severely eroded the value of their local currencies.
b. Sovereign Debt and Fiscal Imbalances:
Excessive government borrowing, especially in developing nations, can undermine currency stability. Investors demand higher returns to offset perceived risks, leading to capital flight and exchange rate depreciation. Countries with high external debt face added challenges when the dollar strengthens, as it raises the cost of servicing foreign liabilities.
c. Currency Wars and Competitive Devaluations:
Some nations deliberately devalue their currencies to make exports more competitive, leading to “currency wars.” While this may temporarily boost exports, it can trigger retaliatory devaluations by other nations and disrupt global trade equilibrium.
d. Geopolitical Fragmentation:
Trade conflicts, sanctions, and regional disputes have made currency management more complex. For instance, sanctions on Russia have accelerated the shift toward non-dollar settlements. Similarly, tensions between the U.S. and China have influenced exchange rate policies and investor confidence in Asian markets.
e. The Digital Currency Disruption:
While digital currencies offer efficiency, they also threaten the traditional banking system. Decentralized cryptocurrencies like Bitcoin and Ethereum challenge the authority of central banks, while CBDCs raise questions about data security, financial surveillance, and cross-border regulatory coordination.
4. Regional Perspectives on Currency Challenges
a. North America:
The U.S. dollar’s global dominance remains, but its high value has hurt American exporters. Canada and Mexico, heavily tied to U.S. trade, face indirect pressures from U.S. interest rate policies.
b. Europe:
The eurozone’s challenge lies in maintaining economic cohesion. Energy dependency, especially on imports, continues to pressure the euro. The U.K. pound has also faced volatility post-Brexit due to trade uncertainty.
c. Asia-Pacific:
Asian economies are at the center of global currency evolution. China’s controlled yuan regime, India’s managed float system, and Japan’s ultra-loose monetary stance make the region diverse and influential. However, regional currencies remain vulnerable to U.S. policy changes and commodity price shocks.
d. Latin America and Africa:
These regions experience chronic currency instability due to high inflation, low reserves, and political risks. However, some nations are exploring local currency trade and digital payment systems to stabilize transactions and reduce reliance on the dollar.
5. The Way Forward: Managing Currency Stability
To navigate the future of global currencies, coordinated strategies are essential:
a. Strengthening Monetary Cooperation:
International institutions like the IMF and World Bank must enhance collaboration among central banks to stabilize currency markets during crises.
b. Promoting Transparent Policies:
Countries should maintain credible fiscal and monetary policies to attract investor confidence and reduce speculative volatility.
c. Managing the Digital Transition:
As CBDCs become more common, global frameworks must ensure interoperability, privacy protection, and cyber resilience.
d. Diversification of Reserves:
Central banks are gradually increasing holdings in gold, the euro, and the yuan to balance their portfolios against dollar fluctuations.
Conclusion
Global currency trends reflect the dynamic balance of economic power, technological progress, and geopolitical change. While the U.S. dollar remains dominant, the rise of digital currencies and regional trade systems is reshaping the international monetary landscape. Challenges like inflation, debt, and political tension will continue to test the stability of global currencies. The future will likely see a more diversified, digital, and interconnected currency system — one that demands cooperation, innovation, and adaptability from all nations involved.

How MNCs Influence Global Trade Patterns1. Understanding Multinational Corporations (MNCs)
A multinational corporation is a company that owns or controls production, distribution, or service facilities in more than one country. Examples include Apple, Toyota, Unilever, and Tata Group. These corporations operate with a global strategy — sourcing materials where they are cheapest, producing goods where labor is most efficient, and selling in markets that offer the best demand.
Unlike domestic firms that focus solely on their home markets, MNCs operate with a worldwide perspective, blending international business practices with local adaptation. This gives them a competitive edge and allows them to significantly impact global trade dynamics.
2. MNCs as Drivers of International Trade
MNCs are the backbone of global trade. They account for a large portion of world exports and imports. According to global trade estimates, nearly two-thirds of international trade occurs within multinational networks — either between parent companies and their subsidiaries or among affiliates of the same corporate group.
By setting up production units across borders, MNCs effectively convert domestic production processes into international trade. For example, when Apple designs iPhones in the U.S., manufactures components in South Korea and China, and sells them worldwide, it creates multiple layers of trade transactions across countries. This production and supply chain integration magnifies global trade volumes and diversifies trade routes.
3. The Role of Foreign Direct Investment (FDI)
Foreign Direct Investment (FDI) is one of the primary ways MNCs influence trade patterns. Through FDI, MNCs invest in foreign markets to establish subsidiaries, acquire local firms, or build production facilities. These investments promote trade in two ways:
Export-Oriented Investment: MNCs set up production bases in developing countries to manufacture goods for export, thus increasing the host country’s export capacity.
Import-Substituting Investment: They also establish local operations to produce goods that were previously imported, reducing a country’s dependency on foreign goods.
For instance, automobile giants like Hyundai or Suzuki have established plants in India, not only to serve domestic markets but also to export vehicles to other regions. This has reshaped India’s position in the global automotive trade network.
4. Integration of Global Value Chains (GVCs)
One of the most significant contributions of MNCs to global trade is the creation of Global Value Chains (GVCs) — systems where production is fragmented across multiple countries. Each country participates in a specific stage of production based on its comparative advantage.
For example:
Raw materials are sourced from Africa.
Components are manufactured in China.
Assembly happens in Vietnam.
Products are marketed and sold in Europe and North America.
This interconnected production model has increased trade in intermediate goods (parts and components) and services (like logistics and IT support). The rise of GVCs means that the trade between countries today is not just about finished goods but also about value-added processes at each stage of production.
5. Technology Transfer and Innovation Diffusion
MNCs play a vital role in transferring technology and innovation across borders. When a multinational sets up a subsidiary in a developing country, it often brings with it advanced technologies, managerial expertise, and global best practices. This leads to productivity improvements in the host economy and helps integrate it into the global trade system.
For example, when semiconductor companies like Intel or TSMC establish units in emerging markets, they introduce sophisticated manufacturing methods. Over time, local firms adopt these innovations, raising the overall technological capacity and enhancing the country’s trade competitiveness.
6. Shaping Trade Policies and Economic Diplomacy
Due to their economic power, MNCs often influence trade and investment policies in both home and host countries. They lobby for favorable regulations, tariff reductions, and improved trade infrastructure. Their global reach gives them leverage in shaping bilateral and multilateral trade agreements.
For example, major technology firms like Google, Microsoft, and Amazon often advocate for data transfer and digital trade rules that benefit cross-border e-commerce and cloud services. Similarly, manufacturing giants push for lower tariffs and better intellectual property protections to facilitate smooth global operations.
7. Labor and Resource Allocation Across Borders
MNCs influence global labor and resource allocation by situating different functions in regions that offer maximum efficiency. They often:
Establish manufacturing in low-cost labor regions (like Southeast Asia).
Maintain R&D and management centers in high-skill economies (like the U.S. or Germany).
Source raw materials from resource-rich regions (like Africa or Latin America).
This distribution of work leads to economic specialization, where countries develop industries aligned with their strengths. While it fosters global interdependence, it can also create vulnerabilities — for example, over-reliance on certain regions for critical components (as seen during the COVID-19 supply chain crisis).
8. Impact on Emerging and Developing Economies
For developing nations, MNCs can be both a blessing and a challenge.
Positive impacts include:
Job creation and skill development.
Improved infrastructure and export potential.
Access to global markets and technologies.
However, challenges arise when MNCs dominate local markets, repatriate profits instead of reinvesting locally, or exploit labor and natural resources. Policymakers in developing countries must therefore balance attracting foreign investment with protecting domestic economic interests.
9. MNCs and Trade in Services
Traditionally, international trade was dominated by goods. Today, MNCs have expanded trade in services, including finance, telecommunications, logistics, and IT. For example, companies like Accenture, Infosys, and Amazon Web Services operate globally, exporting knowledge-based and digital services that are less constrained by geography.
This shift from goods to services trade has diversified global commerce and allowed developing economies with strong human capital to integrate into the global economy more effectively.
10. Environmental and Ethical Dimensions
Global trade expansion through MNCs has also raised environmental and ethical concerns. Large-scale production across multiple countries often leads to resource depletion, pollution, and carbon emissions. Additionally, differences in labor laws between nations can lead to exploitation.
In response, many MNCs have adopted sustainability frameworks and ESG (Environmental, Social, and Governance) principles. For example, companies like Unilever and Tesla have integrated eco-friendly practices into their global supply chains. Consumers and investors now reward corporations that demonstrate responsible global trade behavior.
11. The Future of MNCs in Global Trade
The next phase of MNC-driven trade will be shaped by digital transformation, geopolitical shifts, and supply chain resilience.
Digitalization will enable even small businesses to join global markets through e-commerce and AI-driven logistics.
Geopolitical tensions (like U.S.-China decoupling) may lead MNCs to diversify their supply chains to new regions such as India, Vietnam, or Mexico.
Sustainability pressures will push MNCs to adopt greener trade practices.
MNCs that adapt to these trends will continue to dominate international trade, while countries that align their policies with these shifts will benefit the most.
Conclusion
Multinational corporations are not just participants in global trade — they are architects of it. Their global operations integrate economies, influence policy, and determine the direction of international commerce. From creating global value chains to driving technological progress, MNCs have fundamentally reshaped how the world trades.
However, their influence also comes with responsibilities — to ensure fair competition, ethical labor practices, and sustainable development. As globalization evolves, MNCs will remain central to the world economy, continuously redefining global trade patterns in an increasingly interconnected world.
Role of the Stock Market in the Global Economy1. Capital Formation and Economic Growth
At the heart of every growing economy is capital — the financial resource required to fund new ventures, expand industries, and support infrastructure development. The stock market plays a fundamental role in capital formation by allowing companies to raise funds from the public through the issuance of shares. Instead of relying solely on banks or private investors, businesses can access large pools of capital by becoming publicly listed.
When investors buy shares, they effectively fund a company’s operations and expansion. This capital helps businesses invest in research and development, open new branches, or enter global markets. Over time, such investments lead to economic growth, job creation, and increased productivity. A thriving stock market, therefore, is both a cause and a consequence of strong economic performance.
2. Wealth Creation and Distribution
The stock market provides individuals and institutions the opportunity to invest in the success of corporations and, by extension, the economy itself. When stock prices rise, investors gain wealth through capital appreciation and dividends. This wealth creation boosts consumer confidence and spending, which fuels demand in the economy.
However, stock markets also play a role in wealth distribution. Institutional investors such as pension funds, mutual funds, and insurance companies invest heavily in equities, ensuring that ordinary individuals indirectly benefit through retirement plans and insurance policies. This allows wealth to spread across different layers of society, supporting long-term financial stability and social welfare.
3. Reflection of Economic Health
The stock market is often viewed as a barometer of economic performance. Rising stock indices generally signal optimism, investor confidence, and expectations of economic growth. Conversely, a falling market often reflects economic slowdowns, inflationary pressures, or geopolitical tensions.
Central banks, policymakers, and financial institutions closely monitor stock market movements to gauge the effectiveness of fiscal and monetary policies. For instance, a strong stock market may indicate that companies are performing well and consumers are confident, while a sharp decline could prompt governments to take corrective actions such as interest rate adjustments or stimulus packages.
In this way, the stock market doesn’t just mirror the economy—it influences it. Positive sentiment can attract foreign investment, boost domestic consumption, and encourage corporate expansion, creating a feedback loop that reinforces economic progress.
4. Global Capital Flow and Interconnected Markets
In the modern globalized economy, stock markets are deeply interconnected. Major exchanges like the New York Stock Exchange (NYSE), London Stock Exchange (LSE), Tokyo Stock Exchange (TSE), and National Stock Exchange (NSE) in India are linked through international trade, investment funds, and cross-border listings.
This interconnection facilitates global capital flows, where investors can diversify their portfolios across countries and sectors. For example, an investor in Europe can easily invest in Asian technology companies or U.S. pharmaceuticals. This global mobility of capital promotes financial integration, enhances liquidity, and helps balance growth across regions.
However, this interdependence also means that shocks in one market can ripple across the world. Events such as the 2008 financial crisis or the 2020 pandemic-induced sell-off demonstrated how global markets react collectively, affecting currencies, commodities, and economic stability worldwide.
5. Encouraging Corporate Governance and Transparency
Publicly listed companies are required to adhere to strict regulatory standards and disclose financial information periodically. This transparency builds investor trust and encourages good corporate governance. Shareholders have voting rights and can hold management accountable for their decisions.
Through these mechanisms, the stock market promotes ethical business practices, deters fraud, and supports long-term sustainability. The demand for transparency also leads companies to improve efficiency, maintain profitability, and focus on innovation—key drivers of global economic progress.
6. Facilitating Innovation and Entrepreneurship
Stock markets serve as engines of innovation by channeling funds into promising startups and expanding companies. Technology giants such as Apple, Amazon, and Tesla once relied on equity markets to raise funds for growth. Venture capitalists and private equity firms also use the stock market as an exit route—selling their stakes once companies go public.
By providing liquidity and valuation benchmarks, stock exchanges encourage entrepreneurial risk-taking. This continuous cycle of funding and innovation fosters competitiveness, drives technological advancement, and creates new industries that redefine the global economic landscape.
7. Risk Management and Portfolio Diversification
The stock market offers a range of financial instruments—equities, derivatives, exchange-traded funds (ETFs), and index funds—that help investors manage risk and diversify portfolios. Diversification across sectors, countries, and asset classes reduces exposure to localized downturns and ensures more stable returns.
Institutional investors, such as sovereign wealth funds and hedge funds, play a crucial role in stabilizing markets through sophisticated risk management strategies. In turn, this contributes to financial stability on a global scale, as markets with deeper and more liquid stock exchanges can absorb shocks more efficiently.
8. Impact on Employment and Business Expansion
The growth of the stock market directly influences employment and business opportunities. Companies that successfully raise funds through public offerings can expand their operations, hire more workers, and invest in innovation. This leads to job creation across multiple sectors, from manufacturing to technology and services.
Additionally, stock market activity generates employment within the financial ecosystem—brokers, analysts, fund managers, accountants, and regulatory bodies all contribute to economic productivity. The market thus becomes a catalyst for broader development, connecting individual prosperity with national growth.
9. Role in Monetary and Fiscal Policy Transmission
Governments and central banks use the stock market as an indicator and transmission channel for economic policy. For example, when central banks lower interest rates, borrowing becomes cheaper, boosting corporate profits and driving up stock prices. Similarly, expansionary fiscal policies like tax cuts can increase disposable income, which in turn enhances market performance.
Stock markets amplify the impact of these policies by influencing wealth effects—when investors feel wealthier due to rising portfolio values, they tend to spend more, stimulating the economy further. Thus, markets act as a bridge through which policy measures reach real economic outcomes.
10. Challenges and Risks
While stock markets bring immense benefits, they are not without risks. Speculative bubbles, market volatility, insider trading, and unequal access to information can distort the market’s role in supporting economic health. Excessive dependence on stock performance may also lead to short-termism, where companies prioritize quarterly profits over long-term sustainability.
Moreover, the globalization of markets means that crises can spread quickly across borders, as seen in the 2008 global financial crisis. Therefore, maintaining regulatory oversight, investor education, and market transparency is vital to ensure stability and fair growth.
Conclusion
The stock market is much more than a platform for trading shares—it is the lifeblood of the global economy. By enabling capital formation, encouraging innovation, reflecting economic trends, and promoting good governance, it supports long-term economic development.
At the same time, its interconnectedness means that nations must collaborate to ensure fair practices, transparency, and financial stability. When functioning efficiently, the stock market not only drives growth but also acts as a mirror of human progress and economic resilience—shaping the future of the global economy in every trade and transaction.

Sector-Wise Performance: Winners and Losers in a Recession1. Consumer Staples – The Recession-Resilient Winner
One of the most consistent winners during a recession is the consumer staples sector. This includes companies that produce essential goods such as food, beverages, cleaning products, and personal care items. No matter how bad the economy gets, people still need to eat, brush their teeth, and maintain basic hygiene.
Examples: Procter & Gamble, Nestlé, and Hindustan Unilever often maintain stable revenues even when luxury sectors collapse.
Why it survives:
Demand for basic necessities remains constant.
Consumers may switch from premium to affordable brands, but overall spending on essentials doesn’t fall drastically.
Predictable cash flows make these companies attractive to defensive investors.
Investor takeaway: During economic downturns, defensive sectors like consumer staples tend to outperform broader markets and serve as safe havens for portfolio stability.
2. Healthcare – A Pillar of Stability
The healthcare sector also tends to weather recessions well. People do not stop buying medicines or seeking medical attention due to economic hardship. Hospitals, pharmaceutical companies, and medical equipment manufacturers often continue to generate revenue even when consumer sentiment is weak.
Examples: Johnson & Johnson, Pfizer, and major hospital chains maintain steady performance during recessions.
Why it survives:
Healthcare demand is largely inelastic (not sensitive to economic changes).
Aging populations and chronic diseases ensure consistent demand.
In some cases, recessions can increase stress-related health issues, indirectly boosting demand for certain treatments.
Investor takeaway: Healthcare stocks often act as defensive assets. They provide consistent dividends and stable earnings, making them ideal for investors seeking protection from volatility.
3. Utilities – The Safe but Slow Sector
Utilities such as electricity, water, and gas providers are among the most stable industries during recessions. These services are essential for daily living, and their demand rarely fluctuates with economic cycles.
Why it survives:
Energy and water are indispensable, regardless of income levels.
Many utility companies have regulated pricing structures, ensuring steady revenue.
High dividend yields attract investors seeking safety.
Investor takeaway: Utilities offer reliability and income stability, though they may not deliver high growth. In a recession, they serve as a “safe harbor” for conservative investors.
4. Information Technology – Mixed Performance
The IT sector shows a mixed response during recessions. On one hand, technology is deeply embedded in modern life and business operations. On the other hand, corporations may delay software upgrades or IT spending to cut costs.
Winners within IT:
Cloud computing, cybersecurity, and digital communication firms often continue to grow as businesses seek efficiency and remote solutions.
Subscription-based services (like Microsoft 365, AWS, or Zoom) maintain steady cash flow.
Losers within IT:
Hardware manufacturers and consumer electronics companies may suffer due to reduced discretionary spending.
Startups dependent on venture capital may struggle as funding tightens.
Investor takeaway: Look for tech firms with recurring revenue models and strong balance sheets. They can outperform during recessions and rebound faster afterward.
5. Financial Services – Major Losers
The financial sector is often one of the hardest hit during recessions. Banks, insurance companies, and investment firms experience declines due to loan defaults, reduced credit demand, and falling asset prices.
Why it suffers:
Rising unemployment increases loan delinquencies.
Stock market volatility reduces investment income.
Central banks may lower interest rates, squeezing lending margins.
Examples: During the 2008 global financial crisis, banking giants like Lehman Brothers collapsed, and others like Citigroup required government bailouts.
Investor takeaway: Avoid heavily leveraged or high-risk financial institutions during recessions. Focus on well-capitalized banks with strong liquidity and diversified operations.
6. Real Estate & Construction – A Cyclical Victim
Real estate and construction are highly cyclical sectors that depend on credit availability and consumer confidence. During recessions, both commercial and residential property demand usually declines.
Why it suffers:
High-interest rates (if inflation-driven) make mortgages expensive.
Companies delay expansion plans, lowering commercial property demand.
Property prices may fall due to oversupply and weak investor sentiment.
Exceptions: Affordable housing and rental properties sometimes see steady demand as people downsize from luxury housing.
Investor takeaway: Real estate investment trusts (REITs) with strong cash flow from essential infrastructure (like warehouses or data centers) may perform better than those dependent on office or retail spaces.
7. Consumer Discretionary – The First to Fall
The consumer discretionary sector includes automobiles, luxury goods, entertainment, and travel — all of which are non-essential expenditures. When incomes fall and job insecurity rises, consumers cut back on these first.
Why it suffers:
Reduced household spending on luxury or leisure items.
High inventory levels can lead to heavy discounting and profit erosion.
Companies like automakers, apparel brands, and restaurants often report sharp sales drops.
Examples: The auto and tourism industries saw major declines during the 2020 COVID-19 recession.
Investor takeaway: Avoid heavily cyclical discretionary stocks during downturns. Focus instead on affordable or value-oriented brands that appeal to cost-conscious consumers.
8. Energy Sector – Highly Volatile
The energy sector is deeply tied to global economic activity. Recessions typically reduce industrial output, transportation, and consumption, leading to falling oil and gas demand.
Why it suffers:
Lower demand leads to falling commodity prices.
High fixed costs hurt profitability.
Energy companies may cut capital expenditures, slowing exploration and innovation.
Exceptions: Renewable energy firms and utilities linked to clean energy sometimes remain resilient as governments push green investment even in tough times.
Investor takeaway: Energy stocks can be risky in a recession but may offer opportunities when prices bottom out. Long-term investors can benefit from cyclical rebounds.
9. Industrials – Dependent on Economic Cycles
Industrial companies, including manufacturing, logistics, and heavy equipment firms, are directly affected by economic slowdowns. Orders decline, supply chains contract, and capital investment pauses.
Why it suffers:
Reduced demand for machinery and construction materials.
Dependence on global trade makes them vulnerable to international slowdowns.
Cost-cutting leads to layoffs and reduced capacity utilization.
Investor takeaway: Avoid capital-intensive industrials during recessions. Focus on companies with strong government contracts or exposure to defense and essential infrastructure projects.
10. Communication Services – The Modern Necessity
This sector includes telecom providers, digital media, and online entertainment platforms. In modern recessions, communication services have shown resilience because people still need connectivity for work, study, and entertainment.
Why it survives:
Internet and mobile connectivity are essential utilities today.
Streaming and online gaming often see usage spikes when people stay home.
Advertising revenue may dip, but subscription models offer balance.
Investor takeaway: Companies with recurring revenue, like telecoms or streaming platforms, often perform relatively well compared to traditional media firms reliant on ad income.
Conclusion
Recessions expose the real strength and adaptability of each sector. While consumer staples, healthcare, utilities, and telecom typically emerge as winners, sectors such as financials, real estate, energy, and discretionary goods often become losers due to their sensitivity to income and credit conditions.
For investors, the key lesson is sector rotation — shifting portfolio weight toward defensive and essential industries during downturns, and gradually moving back to cyclical and growth sectors as recovery begins. Understanding these dynamics not only helps preserve capital but also positions investors to capture gains when the economy eventually rebounds.
Understanding Different Types of Global Assets1. Equities (Global Stocks)
Equities represent ownership in a company and are one of the most popular asset classes worldwide. When investors buy shares of a company listed on a stock exchange, they become partial owners and are entitled to a share of profits through dividends and capital appreciation.
Global equity markets include major stock exchanges such as the New York Stock Exchange (NYSE), London Stock Exchange (LSE), Tokyo Stock Exchange (TSE), and National Stock Exchange of India (NSE). Each region offers exposure to different industries and economic cycles.
Developed Market Equities: These include companies from economically stable nations like the U.S., Japan, the U.K., and Germany. They are considered safer but often yield moderate returns.
Emerging Market Equities: Countries like India, Brazil, and China offer higher growth potential but with increased volatility and political risk.
Frontier Market Equities: These are smaller, less developed economies (such as Vietnam or Kenya) with higher risk but potential for exponential growth.
Equity investors often use exchange-traded funds (ETFs) or mutual funds to gain diversified exposure across multiple markets without the need to directly buy international stocks.
2. Fixed-Income Securities (Global Bonds)
Bonds are debt instruments issued by governments, corporations, or financial institutions to raise capital. In return, investors receive periodic interest payments and the principal upon maturity. Global bond markets are vast and serve as a backbone of the financial system, providing stability and predictable income.
There are several types of global bonds:
Sovereign Bonds: Issued by national governments (e.g., U.S. Treasury Bonds, German Bunds, Indian Government Bonds). They are often seen as low-risk investments.
Corporate Bonds: Issued by multinational companies to fund operations or expansion. These carry higher yields but greater default risk.
Municipal and Supranational Bonds: Issued by local governments or institutions like the World Bank or IMF for development projects.
Investors in global bonds must consider interest rate differentials, currency fluctuations, and credit risk. For instance, a bond issued in Japanese yen might perform differently when converted back to U.S. dollars depending on exchange rate movements.
3. Commodities
Commodities are physical goods such as metals, energy resources, and agricultural products that serve as essential inputs in global production. They are traded on exchanges like the London Metal Exchange (LME), Chicago Mercantile Exchange (CME), and Multi Commodity Exchange (MCX) in India.
The main commodity categories include:
Energy Commodities: Crude oil, natural gas, and coal dominate global trade. Oil prices, in particular, affect inflation, production costs, and currency values worldwide.
Precious Metals: Gold, silver, and platinum are seen as “safe-haven” assets that investors flock to during economic uncertainty.
Industrial Metals: Copper, aluminum, and zinc are key materials for manufacturing and construction.
Agricultural Commodities: Wheat, corn, coffee, and cotton play crucial roles in global food supply chains.
Commodity prices are highly sensitive to geopolitical tensions, supply-demand imbalances, and natural events like droughts or hurricanes. Investors can access commodities through futures contracts, ETFs, or commodity-focused mutual funds.
4. Currencies (Foreign Exchange or Forex Market)
The foreign exchange (forex) market is the largest financial market in the world, with daily trading volumes exceeding $7 trillion. Currencies are traded in pairs, such as EUR/USD or USD/JPY, reflecting the relative value of one currency against another.
Forex trading allows investors to speculate on currency movements or hedge international investments against exchange rate risk. For example, a U.S. investor with European assets may buy euros to protect against a weakening dollar.
Major currency pairs include:
Major Pairs: USD/EUR, USD/JPY, GBP/USD — most liquid and widely traded.
Minor Pairs: Non-USD combinations like EUR/GBP or AUD/JPY.
Exotic Pairs: Combine a major currency with one from an emerging economy, such as USD/INR or EUR/THB.
Forex markets are influenced by interest rates, inflation, trade balances, and political stability. Central banks also play a crucial role in currency valuation through monetary policies and interventions.
5. Real Estate (Global Property Markets)
Real estate is another essential global asset class that provides income through rent and appreciation in property value. Investors can access real estate directly (by buying physical property) or indirectly (through Real Estate Investment Trusts – REITs).
Global real estate markets vary greatly by region:
Developed Markets: Properties in cities like New York, London, or Singapore offer stability but are expensive.
Emerging Markets: Cities in India, Vietnam, or Brazil provide higher yields but with greater risk due to economic and legal uncertainties.
Real estate investments are influenced by interest rates, urbanization trends, and government policies. REITs make it easier for investors to diversify globally without the challenges of direct ownership.
6. Alternative Assets
Alternative investments include asset classes outside traditional stocks and bonds. These are often less liquid but can provide diversification and high returns.
Common types of alternatives include:
Private Equity: Investments in privately held companies before they go public.
Hedge Funds: Pooled funds using complex strategies like long/short positions or arbitrage.
Venture Capital: Early-stage investments in startups with high growth potential.
Infrastructure Assets: Investments in public utilities, transportation, and renewable energy projects.
Collectibles: Art, wine, or rare coins can also serve as alternative assets with niche market value.
Institutions and high-net-worth investors use alternatives to hedge market volatility and achieve uncorrelated returns.
7. Digital Assets (Cryptocurrencies and Tokenized Assets)
In the last decade, digital assets have revolutionized global investing. Cryptocurrencies like Bitcoin, Ethereum, and Solana are decentralized digital currencies that operate on blockchain technology. They allow peer-to-peer transactions without intermediaries like banks.
Beyond crypto, tokenization enables real-world assets such as real estate, art, or stocks to be represented digitally on blockchain networks. This enhances liquidity, transparency, and accessibility.
However, digital assets carry high volatility and regulatory uncertainty. Governments and financial institutions are gradually shaping frameworks to integrate them into mainstream finance through Central Bank Digital Currencies (CBDCs) and regulated exchanges.
8. Derivatives
Derivatives are financial instruments whose value derives from an underlying asset such as stocks, bonds, commodities, or currencies. Common derivatives include futures, options, swaps, and forwards.
They are used primarily for hedging (risk management) or speculation. For instance, a company importing oil may use futures contracts to lock in prices and protect against future price increases. Traders, on the other hand, may speculate on these price changes for profit.
Derivatives markets are essential for global financial stability, allowing participants to manage exposures effectively, though misuse can amplify systemic risk.
9. The Importance of Diversification Across Global Assets
Diversification is the cornerstone of smart investing. By spreading investments across multiple asset classes and geographies, investors reduce exposure to regional downturns or sector-specific risks. For example, when global equities face a correction, safe-haven assets like gold or U.S. Treasuries often rise, cushioning overall portfolio losses.
A balanced global portfolio might include:
40% equities (across regions),
30% bonds,
10% commodities,
10% real estate,
10% alternatives or digital assets.
This mix provides both growth and stability in an uncertain global environment.
Conclusion
Understanding the different types of global assets is fundamental for building a resilient and diversified portfolio. Each asset class — equities, bonds, commodities, currencies, real estate, alternatives, digital assets, and derivatives — behaves differently under various economic conditions.
The key to successful global investing lies in recognizing the interconnections among these assets, managing risks intelligently, and adapting to market shifts driven by globalization, technology, and geopolitics. As financial markets evolve, investors who understand the structure and behavior of global assets will be better positioned to capture opportunities and weather uncertainties with confidence.
How Global Markets Are Responding to Economic Shifts1. Price discovery and the immediate reaction
When new economic data or events arrive (jobs reports, CPI numbers, trade disruptions, or political shocks), markets move almost instantaneously to incorporate the information. High-frequency trading and algorithmic strategies often amplify initial moves — a surprise inflation print can trigger a sharp sell-off in bonds and a near-instant repricing of interest rate expectations. Equities typically show the widest variance by sector: interest-rate sensitive sectors (real estate, utilities) fall faster when rates spike, while commodity producers and cyclical industries may rally if the data imply stronger demand.
2. Interest rates and bond market mechanics
The bond market is the backbone of market response. Expectations about central bank policy — the path of short-term rates and the pace of balance-sheet actions — are priced into government yields globally. If inflation surprises on the upside or central banks signal tighter policy, yields rise and bond prices fall. This yields shock affects everything: higher yields increase the discount rate used to value equities, lower present values of future corporate earnings, and raise borrowing costs for companies and households. Conversely, signs of slowing growth or deflation risk push yields down, often boosting long-duration assets (growth stocks, long bonds).
3. Equity markets: winners, losers, and rotation
Stock markets reflect both macro outlooks and company-level fundamentals. In a growth-acceleration scenario, cyclicals, industrials, and small-cap stocks often outperform as investors rotate into riskier, higher-beta assets. In a growth-slowdown, defensive sectors (consumer staples, health care) and dividend-paying stocks usually offer relative safety. Market breadth and leadership shifts matter: when a handful of mega-cap tech companies are driving indices, the headline index may mask a narrower market. Active managers watch these leadership signals to rotate exposures.
4. Currency markets and capital flows
Currencies are real-time indicators of comparative economic strength and monetary policy. A central bank expected to raise rates will typically see its currency appreciate as yield-seeking capital flows in. Conversely, risk-off episodes trigger “flight-to-safety” flows toward reserve currencies (commonly the US dollar), pushing emerging-market and commodity-linked currencies lower. Persistent trade imbalances, capital controls, and sovereign risk perceptions also shape currency moves, which then feed back into inflation and corporate earnings through import costs and translation effects.
5. Commodities and real assets
Commodities react to both demand expectations and supply shocks. Energy prices surge with geopolitical tensions or supply disruptions, while industrial metals track global manufacturing health. Inflationary episodes often raise real asset prices — commodities and real estate can act as inflation hedges — but the relationship isn’t perfect and depends on real yields and growth expectations. Agricultural commodities can respond to weather and logistics as much as to macro demand.
6. Volatility, risk premia, and the cost of hedging
Economic shifts increase uncertainty, and volatility is the market’s “fear gauge.” Rising volatility raises the cost of hedging (options become more expensive), which alters trading strategies and risk management. Investors demand higher risk premia for holding volatile assets; this can push required returns up and valuations down. Institutional players often recalibrate portfolio risk — reducing leverage, increasing cash, or buying volatility protection — which can exacerbate short-term price moves.
7. Credit markets and corporate financing
Corporate bond spreads widen when growth fears or credit concerns rise, reflecting higher default risk or liquidity premiums. Tighter credit conditions hurt leveraged companies first, possibly slowing investment and hiring. Conversely, easier financial conditions (lower borrowing costs, ample liquidity) support refinancing, M&A activity, and risk-taking. The health of the banking system and non-bank lenders matters: stress in credit intermediation channels can transmit shocks to the broader economy quickly.
8. Policy responses and market feedback loops
Markets react not just to events but to the expected policy responses. Central banks and fiscal authorities monitor market signals closely. Sometimes markets move because investors anticipate policy easing or tightening; other times, central banks move because markets have moved (e.g., to restore stability). This two-way feedback can create virtuous cycles (confidence begets investment) or vicious ones (sell-offs trigger credit tightening). Transparency and forward guidance from policymakers help stabilize expectations, but surprises still cause sharp market adjustments.
9. Structural and technological influences
Market structure and technology have changed how responses unfold. Algorithmic trading, ETFs, and passive investment have altered liquidity patterns; large flows in and out of ETFs can amplify moves in underlying assets. Global interconnectedness means shocks travel faster — a manufacturing slowdown in one region quickly impacts supply chains and corporate earnings elsewhere. At the same time, data availability and analytics allow investors to react faster and to hedge with more precise instruments.
10. Longer-term asset allocation shifts
Sustained economic shifts—like a multi-year inflation regime change, deglobalization, or energy transition—reconfigure long-term allocations. Investors may favor real assets, shorten duration in fixed income, overweight certain regions, or increase allocations to alternatives (private equity, infrastructure) that offer different risk-return profiles. Pension funds and insurers, with long-dated liabilities, pay special attention to regime shifts because they directly affect funding ratios and required returns.
Conclusion — pragmatic lessons for investors
Markets are efficient at processing new information, but they are not always rational. Short-term reactions can be loud and disorderly; medium-term trends matter more for portfolios. Key practical takeaways: (1) watch interest-rate expectations and real yields — they shape valuations across assets; (2) track leadership and breadth in equity markets — it tells you if moves are broad-based or concentrated; (3) manage liquidity and hedging costs — volatility can spike unexpectedly; and (4) focus on scenario planning rather than prediction. A disciplined, diversified approach that explicitly considers how different assets respond to rate, growth, and inflation shocks will navigate economic shifts more successfully than one that chases yesterday’s winners.

Liquidity, Efficiency, and Fair Value - THE SECRETS OF TRADINGIn this video I go through the BTCUSDT chart again to highlight the 3 core principles of how the market moves. It really is as simple as this. All the other gimmicks out there, all the news, it is all nonsense for the most part if you are doing anything less than long-term investing. At the very least, seeing the markets through this lens is going to allow you to see how those other tools are used to manipulate the masses for the most part. You may argue that your or your mentor's or this guy you say on social media is using a system with those tools, and that they work. Yes, if you find the right combination of factors, and good risk management, and a bit of luck, you can find a positive edge in the market. Whether it is one that lasts forever in any market or any timeframe, that is another question. But for me, I prefer to actually understand why it rains and when it will rain rather than to say "cloud grey... rain coming".
Enjoy!
R2F Trading

STAY IN THE WAVE TO CATCH THE WAVE - THE ART OF RANGE MANAGEMENTHey Everyone,
Here at GVFX, we are currently buying dips. What that means is that we buy on the dips and therefore only concentrate on long positions/buys. As mentioned before, having both sell and buy positions open in your account will affect your psychology and in turn, your trading decisions.
Now a question that typically arises here is why would it still be advisable to buy when the market is pushing down? Firstly, let me assure you that the same algorithms, experience and strategies that we use with our bullish directional bias also gives us the heads up, or down if you will, on when the market is going down. Don't think for a moment that we only know how to analyse a bull market or up trends. We share trade ideas for both Bullish and Bearish moves but choose not to hedge out of choice.
In my experience, it is much safer to get out of a stuck buy position than a stuck sell position. That's not to mention the clean PSYCHOLOGICAL PROFILE that is achieved when trading in just one direction. And although hedging can in theory work, it requires years of experience and in the end, is simply not worth the effort and psychological stress.
Let us look at an example of the current short/mid term trend to further highlight this point. When you have short-term bearish momentum down, we take buys from key supports or MAs which act as dips. Remember that the market does not go up or down in a straight line (with the rare exception of short-lived parabolic moves). So, when the market is going down and hits one of our key levels, a buy from that point will go back up for 30 to 40 pips (this number of pips has been calibrated based on back testing) before resuming back down.
You can think of it like this. The market moves in a zigzag manner. The zig is that part of the leg which is going down to create lower lows (if the downward trend is continuing). The zag is that part of the leg which takes a breather and pushes back up with momentum for our entry and quick pip-take range to create a lower high (if the downward trend is continuing) before heading back down again. We catch the right and safest waves (buys) in and out and surf to success. When price hits a key structural support or stops creating lower lows and lower highs, we then reassess for entries with a wider range of pip capture.
Hope this post helps our followers to understand how we ride waves by staying committed to one direction in order to always fall naturally into the wave rather then chasing a wave!!
GoldViewFX

The FX Professor Charting Process in Action The FX Professor Charting Process in Action 🧠📊
In this educational breakdown, I walk you through how I build levels and structure a chart from scratch — FXPROFESSOR style — using ZECUSD as a live example 📉📈
1. The process always starts with selecting the deepest chart history possible — the further back in time, the more reliable the zones. In this case, I favored Kraken's ZEC chart as it gave me data dating back to 2017 versus 2021. That’s a critical edge.
2. From there, we built 4 major levels based on clean support/resistance flips across time — using both daily and 12-hour zooms to confirm.
I emphasized that we:
Don’t chase pumps (this isn’t a trade setup, it’s a lesson)
Layer in levels from the oldest clean structure possible
Validate using Fibonacci wedge confirmations 🔍
As seen on the chart:
Breakouts came after respecting legacy zones
3, Fibonacci aligned near perfectly with my second level, confirming 0.618 golden zone projections and showing confluence into 687 as a potential upside target (should continuation happen)
Most traders slap fibs high to low — I use it differently. Structure first. Fibs second.
This chart is not a signal — it’s a masterclass in technical charting logic and how to anchor your analysis around real price memory and reaction zones.
4. Alerts. Thank God there is Tradingview.
5. Food for Thought 🍃
Most traders skip history and jump into price action with no memory. But a chart without memory is a trade without a thesis. Structure beats speed. Every. Single. Time. 📚
Disclaimer: I’m just sharing wisdom, not instructions. No licenses, no guarantees — just years of trading scars and precision chartwork. Be smart, protect your capital, and don’t copy blindly....Remember to PLAY the LEVELS
One Love,
The FXPROFESSOR 💙

A Tutorial on LIQUIDITY and EFFICIENCYLike I've mentioned in the past, these are the 2 core concepts of how the market moves. When you begin to understand them, you start to understand where price HAS to go. That may sound arrogant, but I am last the person to say anything about the market with certainty unless I am actually certain. It is akin to understanding why and how the sun comes up in the morning and goes down at night. Because you understand the science behind it, you are able to say with certainty where and when it will happen. (Unless you believe some flat earther stuff like the sun is a hot air balloon ride away...
So, I hope you find this video educational. Remember, successful trading is about consistency, discipline, and hard work. It is about making profit and minimizing risk. It isn't about winning or losing, or being right or wrong.
Take care,
- R2F Trading

How to use BTC Coinbase premium index indicator on tradingview1. What is the Coinbase Premium Index?
The Coinbase Premium Index is a metric that measures the price difference between a specific cryptocurrency listed on Coinbase and the price of Bitcoin on other major exchanges (especially Binance).
⌨︎ Calculation method:
(Coinbase BTC price - Other exchange BTC price) / Other exchange BTC price * 100
Positive premium: Occurs when the Coinbase price is higher than on other exchanges.
Negative premium: Occurs when the Coinbase price is lower than on other exchanges.
📌 If this content was helpful, please show your support with a boost and comments. Your encouragement is a great motivator for creating better analysis and content.
We will continue to upload various content such as chart analysis, trading strategies, and Bitcoin short-term signals, so please follow us.
2. Causes of Coinbase Premium
✔️ The main causes of Coinbase Premium are as follows:
Institutional investor demand: Coinbase is one of the largest regulated cryptocurrency exchanges in the U.S., and many institutional investors (hedge funds, asset management firms, etc.) purchase cryptocurrencies through Coinbase.
Large-scale buy orders from institutional investors can temporarily drive up prices on Coinbase, creating a premium.
Fiat currency inflow: Coinbase primarily facilitates USD-based transactions and is the most accessible platform for U.S. investors.
When new fiat currency flows into the cryptocurrency market, a strong inflow through Coinbase can lead to a premium.
Market sentiment and liquidity: If U.S. market investor sentiment is stronger than in other regions at certain times, or if liquidity on Coinbase is temporarily low, a price difference may occur.
Restrictions on fund movement: Due to anti-money laundering (AML) regulations, there may be time and cost restrictions on fund transfers between exchanges.
This limits arbitrage opportunities and helps maintain the premium.
Network congestion and fees: During cryptocurrency network congestion, transaction speeds may slow down or fees may increase, making rapid arbitrage between exchanges difficult.
3. How to Use the Coinbase Premium Index in Trading
The Coinbase Premium Index can primarily be used to predict market trends for major cryptocurrencies like Bitcoin (BTC).
📈 Bull market signal (positive premium):
Institutional buying inflow: A consistently high positive premium may indicate sustained buying pressure from institutional investors.
This can be interpreted as a signal of an overall market uptrend.
Trend reversal: If a negative premium persists in a bear market and then suddenly turns positive or its magnitude increases, it can be seen as a signal that a trend reversal is imminent, along with the inflow of institutional investors and improved market sentiment.
Bottom buying opportunity: If the Bitcoin price is falling and the Coinbase premium starts to rise above 0%, and at the same time, the daily net inflow into ETFs like BlackRock iShares Bitcoin Trust (IBIT) or Fidelity Wise Origin Bitcoin Trust (FBTC) significantly increases, this could signal a strong buying opportunity at the bottom.
📉 Bear market signal (negative premium):
Institutional selling pressure or decreased interest: A consistently low negative premium may indicate high selling pressure from institutional investors or decreasing interest in Bitcoin.
This can be interpreted as a signal of a market downtrend.
Bearish reversal signal: If a positive premium persists in a bull market and then turns negative or its magnitude sharply increases, it could be a top signal, indicating that institutional investors are taking profits or new buying inflows are decreasing.
Overbought/Correction signal: For example, if the Bitcoin price is soaring and the Coinbase premium turns negative, and at the same time, large net outflows are observed from ETFs such as BlackRock IBIT or Fidelity FBTC, it can be judged that the market is overbought or there is a possibility of correction, and a sell position can be considered.
4. Points to Note
🚨 When using the Coinbase Premium Index, pay attention to the following:
Combination with other indicators: The Coinbase Premium Index is just one auxiliary indicator.
A comprehensive judgment should be made by analyzing other technical analysis indicators such as moving averages, RSI, MACD, trading volume, as well as on-chain data and macroeconomic indicators.
Importance of ETF inflow/outflow data: Bitcoin spot ETFs from major asset managers such as BlackRock and Fidelity are one of the most direct indicators of actual institutional investor fund flows.
Analyzing these ETF's daily net inflow/outflow data along with the Coinbase premium can provide a more accurate understanding of institutional buying/selling pressure in the market.
Short-term volatility: The premium can fluctuate rapidly due to subtle changes in the market in the short term.
It is important to observe long-term trends rather than reacting too sensitively to temporary premium changes over a short period.
Changes in market conditions: The cryptocurrency market changes very rapidly.
There is no guarantee that patterns that were valid in the past will necessarily be valid in the future.
Various factors such as regulatory environments, policy changes of major exchanges, and the emergence of new market participants can affect the premium.
Limited scope of application: The Coinbase Premium Index tends to reflect the demand of institutional investors, mainly for Bitcoin. Its influence may be limited for altcoins.
5. Using the Coinbase Premium Index in TradingView
TradingView is a popular platform that provides various technical indicators and chart analysis tools. On TradingView, there are many custom indicators that can monitor the Coinbase Premium Index in real time.
These indicators usually calculate the price difference between Coinbase and Binance spot assets (e.g., BTCUSD/BTCUSDT) and display it in a separate panel at the bottom of the chart.
📊 TradingView indicator usage tips:
Search for indicators: Click the 'Indicators' button on the TradingView chart and type keywords such as 'Coinbase premium' or 'Coinbase vs Binance' in the search bar to find relevant indicators.
Real-time monitoring: These indicators retrieve real-time Bitcoin spot price data from Coinbase and Binance, calculate the premium, and visually display it on the chart. This allows investors to instantly confirm market price differences and incorporate them into their trading strategies.
Combination with other indicators: A powerful advantage of TradingView is that multiple indicators can be overlaid on one chart.
You can add the Coinbase Premium Index indicator along with the Bitcoin price chart, and if necessary, refer to BlackRock and Fidelity ETF inflow/outflow data separately to attempt multi-faceted analysis.
Alert settings: Use TradingView's alert function to set alerts when the Coinbase premium exceeds a certain level or enters/exits a certain range.
This helps to grasp market changes in real time and respond accordingly.
In conclusion, the Coinbase Premium Index is an indicator that can offer insight into the movements of institutional investors in the U.S. market, one of the major players in the cryptocurrency space.
When combined with Bitcoin spot ETF inflow/outflow data from major asset management firms such as BlackRock and Fidelity, it can significantly help to more clearly understand the actual flow of institutional funds and to judge market strength and the possibility of trend reversals.
However, rather than blindly trusting it, it is wise to use it as a supplementary tool to enhance a comprehensive understanding of the market by utilizing it with other analysis tools.

Educational Video pt. 2 Found a couple trades and gave some good reasoning on why I would take them ..... 'like' this video

Educational video. Hit the 'LIKE' button if this helped you.This is my thought process on how to trade. If you would like me to post more recorded videos like this.. or even when I am in a trade , please feel free to 'COMMENT' below this video. This is my logic on the market and this is why my name is NASDAQNYK. You dont need 20 indicators on your charts, you dont need anything but your eyes and 3 confluences to determine your typical entry and exit. Trading is only hard when you make it hard.

Enhancing citizen experience using chatGPT in the Tokyo metropolIn 2023 the Tokyo metropolitan government (TMG) embanked on a series of pilots looking at using chatGPT for text creation idea generations and other clerical work significantly the (TMG) ALSO release four foundation guidelines to aid staff in their approach to using genAI.with thanks to apolitical a sosial learning network for government,for writing up these finding we know the principles were
DON'T input confidential information
don't genarate that infringes copyright
always verify and validate response given by AI independtly
if you directly use response genarated by AI indicate response were created using AI
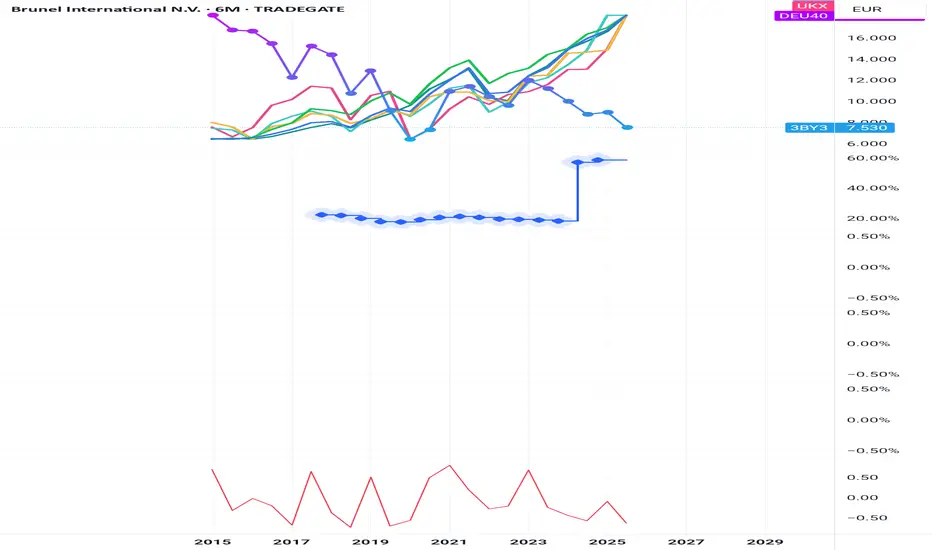
AI in Trading: Hype, Hope, and Hard Truths# TradingView Post: AI in Trading (TradingView Formatting)
"I just made a ChatGPT trading bot that's up 300% in backtests!"
I see this exact post at least 5 times a week. And every time, I know exactly how it ends—blown account, confused trader, and another person convinced that "AI doesn't work in trading."
Here's the uncomfortable truth: AI absolutely works in trading. Just not the way most people think.
The problem isn't the technology—it's that everyone's obsessed with the sexiest part (predicting the next candle) while ignoring the parts that actually make money.
After building dozens of systematic strategies for clients across crypto, forex, and equities, I've learned this: the hard part of trading isn't generating signals. It's managing risk, optimizing execution, and knowing when your edge has disappeared.
Let me show you where AI actually creates alpha—and why your "predictive model" probably won't.
━━━━━━━━━━━━━━━━━━━━━━
The Real Problem With AI Signal Generation
Before we get to what works, let's talk about why most AI trading bots fail:
The Data Problem:
Markets are non-stationary (the game changes constantly)
You need 10,000+ samples for reliable ML models
But market regimes shift every 200-500 bars
You're essentially training on data from a different game
The Overfitting Trap:
Your LSTM "learned" patterns that existed once and may never repeat
95% backtest accuracy? That's usually a red flag, not a green light
Walk-forward testing reveals most models have zero predictive power out-of-sample
The Competition Reality:
Renaissance Technologies has PhDs, decades of data, and billions in infrastructure
Your GPU and 2 years of OHLCV data isn't competing with that
By the time a pattern is obvious enough for simple ML to find, it's arbitraged away
Can pure signal generation work? Yes—but it's the hardest application of AI in trading, not the easiest.
━━━━━━━━━━━━━━━━━━━━━━
Where AI Actually Adds Value (The Unsexy Truth)
Here's what nobody tells you: institutional quant funds use AI heavily, just not for predicting price direction. They use it for the operational advantages that compound over thousands of trades.
1. Position Sizing & Risk Management
Traditional fixed-percentage position sizing (risk 2% per trade) ignores market reality. Sometimes 2% is too aggressive, sometimes it's leaving money on the table.
I've tested reinforcement learning models that dynamically adjust position sizes based on:
Current market volatility regime (VIX, ATR percentiles)
Correlation breakdown between portfolio assets
Recent strategy performance and drawdown depth
Portfolio heat distribution across sectors
Real result from a client system: 23% reduction in maximum drawdown vs. fixed sizing, with nearly identical total returns. The AI wasn't predicting price—it was predicting when the edge was strongest and sizing accordingly.
2. Execution Optimization
This is where prop shops and hedge funds actually deploy ML. Not for signals—for getting better fills.
What ML handles:
Predicting optimal order slicing (VWAP vs. TWAP vs. aggressive IOC)
Detecting liquidity windows in crypto markets (when to place limit orders vs. market orders)
Minimizing slippage on larger positions
Predicting short-term volatility spikes that would hurt execution
Practical example: A simple gradient boosting model analyzing order book depth, bid-ask spread, and recent volume patterns can save 5-15 basis points per trade. On a $100K position, that's $50-150 saved per execution. Over 1,000 trades per year? That's $50K-150K in improved performance.
3. Regime Detection & Strategy Allocation
Stop trying to predict the next candle. Instead, predict the type of market environment you're in.
Use unsupervised learning (K-means clustering, Hidden Markov Models, Gaussian Mixture Models) to identify:
High volatility vs. low volatility regimes
Trending vs. mean-reverting environments
Risk-on vs. risk-off sentiment periods
Correlation expansion/contraction across assets
Why this matters: A moving average crossover that prints money in trending markets will destroy your account in choppy, range-bound conditions. A mean reversion strategy that works beautifully in low volatility will get steamrolled during breakouts.
Implementation: Train an ensemble model on market features (volatility, correlation, volume patterns, momentum indicators). When it detects Regime A, allocate to Strategy Set 1. When it detects Regime B, switch to Strategy Set 2. When confidence is low, reduce exposure across the board.
4. Feature Engineering & Dynamic Signal Weighting
You have 50 technical indicators on your chart. Which ones actually matter right now ?
This changes constantly:
RSI works until the market trends hard, then it's a disaster
Volume patterns matter way more in crypto than traditional equities
Correlation indicators are useless until suddenly they're everything (crisis periods)
Different lookback periods perform differently across volatility regimes
ML solution: Use ensemble methods (Random Forests, XGBoost) to dynamically weight and combine signals based on recent regime and performance.
Instead of: "Buy when RSI < 30"
You get: "Buy when the ensemble model says momentum + volume + volatility features align, weighted by recent regime performance"
Client example: Combined 12 traditional strategies (each with proven edge) with an ML meta-strategy that allocated capital between them. The ML didn't find new edges—it figured out which existing edges to use when. Result: Sharpe ratio improved from 1.1 to 1.7 over 3 years live.
━━━━━━━━━━━━━━━━━━━━━━
The Hybrid Approach That Actually Works
After building systems that survive real markets (not just backtests), here's the architecture that works:
Layer 1 - Core Signals (Traditional Quant):
Mean reversion strategies based on statistical patterns
Momentum breakout systems with volume confirmation
Arbitrage opportunities and structural edges
These are your "alpha generators" with proven statistical edge
Layer 2 - AI Risk Management:
Reinforcement learning for dynamic position sizing
ML models for stop-loss placement and profit-taking
Volatility prediction for exposure adjustment
Layer 3 - AI Strategy Allocation:
Regime detection to switch between strategy sets
Performance-based weighting of different approaches
Correlation analysis for portfolio construction
Layer 4 - AI Execution:
Order optimization based on current liquidity
Slippage prediction and mitigation
Timing of trade execution within the day
Real system I deployed for a crypto client:
Core: 8 different mean reversion + momentum strategies (all traditionally backtested)
AI Layer: Reinforcement learning for position sizing based on volatility regime
ML Layer: Random forest classifier for regime detection (trending vs. ranging vs. high volatility)
Execution: Gradient boosting model for order placement timing
Result: Sharpe ratio improved from 1.2 to 1.8 over 3 years of live trading, max drawdown reduced by 31%
The AI didn't find magic price prediction patterns. It made better decisions about when to trade , how much to risk , and how to execute .
━━━━━━━━━━━━━━━━━━━━━━
What You Should Actually Build
If you're serious about AI in trading, here's my recommendation:
Start here (High ROI, Lower Difficulty):
Build a regime detection system first
Create position sizing rules that adapt to volatility
Optimize your execution (especially in crypto)
Test strategy allocation across different market conditions
Only then consider (High Difficulty, Questionable ROI):
Pure price prediction models
Red flags to avoid:
Any model with >90% backtest accuracy (probably overfit)
Systems that don't account for transaction costs and slippage
Strategies that haven't been walk-forward tested
Anything that can't explain why it should work
━━━━━━━━━━━━━━━━━━━━━━
The Bottom Line
If someone's selling you an AI system that "predicts market direction with 95% accuracy," run away. That's either overfitted garbage or a scam.
If someone's using AI to dynamically manage risk, optimize execution, detect regime changes, and intelligently allocate between proven strategies? That's actually how professionals use it.
The unsexy truth: The best use of AI in trading isn't prediction—it's decision-making around the edges that already exist.
Stop chasing the signal generation hype. Start thinking about the full trading pipeline. That's where the real alpha is hiding.
━━━━━━━━━━━━━━━━━━━━━━
💬 Question for the community: Are you using AI for signal generation or operational optimization? What's been your experience?
🔔 Follow for more quant reality checks—no hype, just data and systems that work in production
📩 Building systematic strategies that need to survive real markets? I specialize in risk-aware ML systems, hybrid quant approaches, and turning backtests into production-ready code. DM me to discuss your project.
━━━━━━━━━━━━━━━━━━━━━━

The Double Bottom Trap That Traders Might Miss1. The Comfort Zone of Classic Patterns
Few formations attract traders’ attention like a double bottom. It’s one of those timeless chart patterns that promise hope after a long decline—a visual story of selling exhaustion followed by a bullish reversal.
But markets rarely reward what’s obvious. In futures trading, especially when examining instruments like Bitcoin Futures (BTC) and Micro Bitcoin Futures (MBT), patterns are only half the story. What truly moves price isn’t just the shape on the chart—it’s the order flow behind it.
That’s where understanding FO (Filled Orders) and UFO (UnFilled Orders) becomes essential. Both represent past and potential liquidity imbalances, and reading their relationship can transform how traders interpret “classic” setups.
2. The Bitcoin Setup: A Tale of Two Bottoms
The current BTC daily chart paints what seems like a textbook double bottom. Two price troughs form near the same horizontal area around $104,000, setting up the typical “W” shape many traders see as a bullish reversal pattern.
However, when we dig deeper into the order flow structure, the illusion begins to fade.
A FO Support level exists near $103,860, meaning that this area previously attracted enough buyers to halt a decline—but those orders have already been filled and we know this given the fact that price turned at that price level before.
The next UFO Support zone sits much lower, around $95,640. That’s where unfilled buy orders are expected to remain waiting, untouched.
This distinction matters. While FO zones mark previous turning points, UFO zones highlight potential turning points that still contain resting liquidity. In simple terms, FO areas represent “used energy,” while UFO areas represent “stored energy.”
3. FO vs. UFO – The Order Flow Reality Check
Let’s define these two concepts with precision:
FO (Filled Orders): Price zones where significant buying or selling already occurred. These levels once reversed price, but because those orders were executed, fewer remain to defend the level again.
UFO (UnFilled Orders): Price zones containing pending buy or sell orders not yet triggered. They represent areas of fresh imbalance and therefore carry a higher probability of influencing future price moves.
In our Bitcoin case, the FO Support around $103,860 has done its job already—it stopped price before. But now, the unfilled buying interest lies lower, implying that the market may need to travel down to reach fresh demand at $95,640.
On the other side, UFO Resistance hovers near $112,410, enveloping the top of the double bottom structure. Should the price rebound toward that level, sellers waiting there could re-enter the scene, potentially capping any bullish recovery.
The conclusion? This pattern isn’t as bullish as it looks.
4. When Bullish Shapes Hide Bearish Probabilities
Most traders spot the double bottom and immediately think “trend reversal.” Yet, the distance between FO and UFO levels tells a more subtle story.
Since FO Support levels carry reduced strength after being tested, they’re more likely to break than hold. In this context, the probability favors a downside continuation rather than an immediate bounce.
If price breaches $103,860, the next probable destination becomes the UFO Support at $95,640. Only then, after reaching that pocket of unfilled demand, might a significant rebound have higher odds.
It’s a reminder that technical patterns, while valuable, must always be filtered through liquidity context. A pattern without order flow validation is like reading the market’s outline without its story.
5. Quantitative Insight: A Probabilistic Lens
Think of this in probabilistic terms:
When FO zones sit above UFO zones, the market often continues toward the unfilled liquidity.
When UFO zones lie closer to current price, reversals occur faster because demand (or supply) is still waiting to be executed.
In our example, BTC shows a larger gap between FO and UFO support levels, signaling lower immediate reversal odds. The chart may appear bullish, but the underlying order flow distribution points to weakness first, strength later.
This is not a prediction—it’s an observation of potential. It allows traders to structure their expectations based on where fresh participation is more likely to emerge.
6. Risk Management: Navigating the Trap
For traders considering setups around this structure, risk management is crucial.
Entry awareness: Avoid entering long positions purely because a double bottom “looks bullish.” Consider waiting for evidence of unfilled demand being triggered (confirmation at or near UFO Support).
Stop-loss placement: Stops below FO Support can easily be hunted in liquidity sweeps; better to align risk control with genuine unfilled demand areas.
Reward-to-risk thinking: A test of the UFO Support near $95,640 could later offer a more favorable upside-to-downside ratio than buying prematurely at $104,000.
Remember, pattern-based entries without liquidity confirmation often carry poor asymmetry—small upside with large downside risk.
7. Futures Structure and Margin Awareness
Both BTC and MBT represent Bitcoin exposure via futures contracts, but their sizing differs dramatically.
BTC equals 5 Bitcoin per contract, making it suitable for larger, institutional players. (1 Tick = 5 = $25. Required Margin = $132,500)
MBT, the Micro Bitcoin Futures, equals 0.1 Bitcoin per contract, offering flexibility for smaller accounts and finer position scaling. (1 Tick = 5 = $0.50. Required Margin = $2,600)
Understanding margin requirements is essential—these products are leveraged instruments, and small price changes can result in large percentage gains or losses.
8. Key Takeaway: The Hidden Lesson
This entire setup illustrates a powerful educational point:
Chart patterns may draw the eye, but order flow tells the truth.
The double bottom may invite buyers, but the imbalance between FO and UFO zones exposes an underlying weakness. Traders who rely solely on visual patterns may walk straight into a trap. Those who align patterns with liquidity insights, however, read the market at a deeper level.
In the current context, BTC and MBT might need to visit lower support levels before finding true stability. Watching how price behaves around these unfilled order zones will reveal whether this double bottom turns into a lasting floor—or just another false start.
When charting futures, the data provided could be delayed. Traders working with the ticker symbols discussed in this idea may prefer to use CME Group real-time data plan on TradingView: www.tradingview.com - This consideration is particularly important for shorter-term traders, whereas it may be less critical for those focused on longer-term trading strategies.
General Disclaimer:
The trade ideas presented herein are solely for illustrative purposes forming a part of a case study intended to demonstrate key principles in risk management within the context of the specific market scenarios discussed. These ideas are not to be interpreted as investment recommendations or financial advice. They do not endorse or promote any specific trading strategies, financial products, or services. The information provided is based on data believed to be reliable; however, its accuracy or completeness cannot be guaranteed. Trading in financial markets involves risks, including the potential loss of principal. Each individual should conduct their own research and consult with professional financial advisors before making any investment decisions. The author or publisher of this content bears no responsibility for any actions taken based on the information provided or for any resultant financial or other losses.

Emotional Trading AreaBehavior Analysis combined with your price-action trading skills can help tremendously in making your trading decisions. I believe that candlestick wicks (shadow) show us where traders will act emotionally before executing their trades. These wicks indicate earlier price rejection and create and area where emotions take over before execution. Decision time.
